An official website of the United States government
 United States Department of Labor
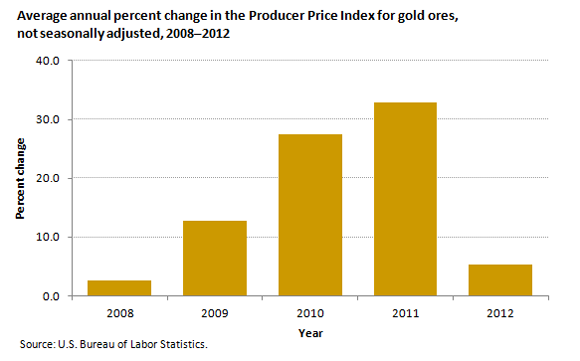
Between 2008 and 2012, the value of gold increased dramatically, and the Producer Price Index (PPI) for gold ores rose 101.1 percent.

| Year | Average annual percent change |
|---|---|
2008 | 2.6 |
2009 | 12.8 |
2010 | 27.4 |
2011 | 32.8 |
2012 | 5.4 |
After rising 2.6 percent in 2008, the PPI for gold increased 12.8 percent in 2009, as the economic and financial problems of the most recent recession continued. The Federal Reserve engaged in a policy of quantitative (or monetary) easing in an effort to inject liquidity into the U.S. economy, which helped lower the value of the dollar, one of the main alternatives to gold. As a result of the economic contraction and monetary easing, many investors put their money into gold, which increased its value in the weak economic environment.
From September 2010 to September 2011, gold prices jumped 50.6 percent, mainly the result of speculation surrounding an uneven recovery and volatility in the U.S. financial markets, with gold reaching an all-time high of $1,917.90 per ounce in August 2011. In 2012, price increases for gold slowed, rising less than they had in each of the previous 4 years. The 5.4-percent increase in 2012 was the smallest yearly gain since the 2.6-percent advance in 2008.
These data are from the Producer Price Index program. To learn more, see “Gold prices during and after the Great Recession” (HTML) (PDF), by Brian Hergt, Beyond the Numbers, February 2013.
Bureau of Labor Statistics, U.S. Department of Labor, The Economics Daily, Gold prices rise more than 100 percent since 2008 at https://www.bls.gov/opub/ted/2013/ted_20130305.htm (visited February 02, 2026).

