
An official website of the United States government
An official website of the United States government
The .gov means it's official.
Federal government websites often end in .gov or .mil. Before sharing sensitive information,
make sure you're on a federal government site.
The site is secure.
The
https:// ensures that you are connecting to the official website and that any
information you provide is encrypted and transmitted securely.
The Producer Price Index for finished goods decreased 0.7 percent in April, seasonally adjusted. Prices for finished goods fell 0.6 percent in March and increased 0.7 percent in February.
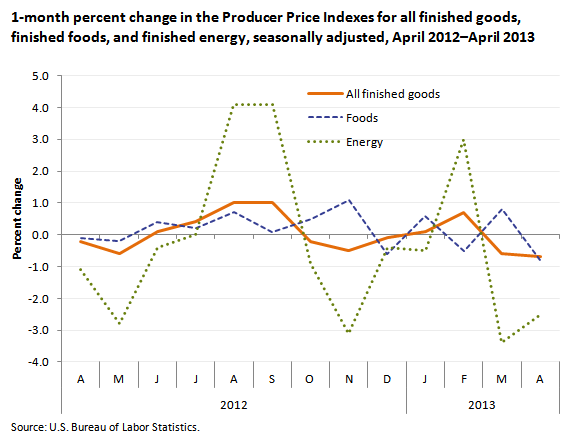
| Month | All finished goods | Foods | Energy |
|---|---|---|---|
Apr 2012 | -0.2 | -0.1 | -1.1 |
May 2012 | -0.6 | -0.2 | -2.8 |
Jun 2012 | 0.1 | 0.4 | -0.4 |
Jul 2012 | 0.4 | 0.2 | 0.0 |
Aug 2012 | 1.0 | 0.7 | 4.1 |
Sep 2012 | 1.0 | 0.1 | 4.1 |
Oct 2012 | -0.2 | 0.5 | -0.9 |
Nov 2012 | -0.5 | 1.1 | -3.1 |
Dec 2012 | -0.1 | -0.6 | -0.4 |
Jan 2013 | 0.1 | 0.6 | -0.5 |
Feb 2013 | 0.7 | -0.5 | 3.0 |
Mar 2013 | -0.6 | 0.8 | -3.4 |
Apr 2013 | -0.7 | -0.8 | -2.5 |
Prices for finished consumer foods moved down 0.8 percent in April, the largest decrease since a 1.0-percent drop in May 2011. Half of the April decline can be traced to the index for fresh and dry vegetables, which fell 10.6 percent. Lower meat prices also were a major factor in the decrease in the index for finished consumer foods.
The index for finished energy goods moved down 2.5 percent in April after falling 3.4 percent in March. Over ninety percent of the April decrease is attributable to gasoline prices, which dropped 6.0 percent. Lower prices for home heating oil and residential electric power also were factors in the decline in the index for finished energy goods.
These data are from the BLS Producer Price Index program. To learn more, see "Producer Price Indexes — April 2013" (HTML) (PDF), news release USDL-13-0928. All producer price indexes are routinely subject to revision once, 4 months after original publication, to reflect the availability of late reports and corrections by respondents.
Bureau of Labor Statistics, U.S. Department of Labor, The Economics Daily, Producer prices for finished goods decrease 0.7 percent in April 2013 at https://www.bls.gov/opub/ted/2013/ted_20130516.htm (visited July 27, 2026).
