
An official website of the United States government
An official website of the United States government
The .gov means it's official.
Federal government websites often end in .gov or .mil. Before sharing sensitive information,
make sure you're on a federal government site.
The site is secure.
The
https:// ensures that you are connecting to the official website and that any
information you provide is encrypted and transmitted securely.
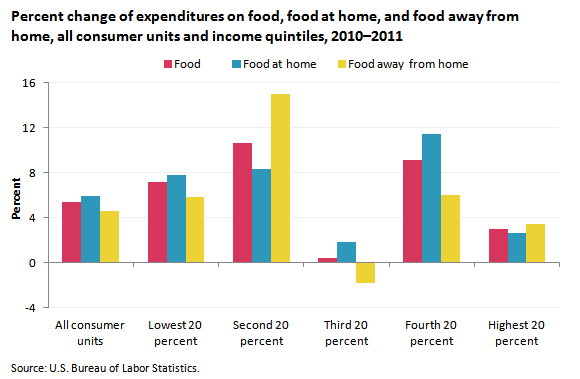
In 2011, food expenditures increased for all consumers and income quintiles. (Income quintiles group consumer units according to their income; each quintile consists of one-fifth, or 20 percent, of consumer units.) The second income quintile registered the largest percentage increase in food expenditures, an increase of 10.6 percent from $4,214 in 2010, to $4,659 in 2011. This reflected an 8.3-percent increase in food-at-home spending and a 15.0-percent increase in food-away-from-home expenditures.
| Category | All consumer units | Lowest 20 percent | Second 20 percent | Third 20 percent | Fourth 20 percent | Highest 20 percent |
|---|---|---|---|---|---|---|
2010 | ||||||
Food | $6,129 | $3,309 | $4,214 | $5,596 | $6,843 | $10,676 |
Food at home | 3,624 | 2,270 | 2,816 | 3,433 | 3,917 | 5,683 |
Food away from home | 2,505 | 1,039 | 1,398 | 2,164 | 2,926 | 4,993 |
2011 | ||||||
Food | $6,458 | $3,547 | $4,659 | $5,620 | $7,466 | $10,991 |
Food at home | 3,838 | 2,448 | 3,051 | 3,496 | 4,364 | 5,828 |
Food away from home | 2,620 | 1,099 | 1,608 | 2,125 | 3,103 | 5,163 |
Percent change from 2010 to 2011 | ||||||
Food | 5.4% | 7.2% | 10.6% | 0.4% | 9.1% | 3.0% |
Food at home | 5.9 | 7.8 | 8.3 | 1.8 | 11.4 | 2.6 |
Food away from home | 4.6 | 5.8 | 15.0 | -1.8 | 6.0 | 3.4 |
The third income quintile barely increased overall food expenditures (0.4 percent). This quintile's 1.8-percent increase in food-at-home expenditures was mostly offset by a 1.8-percent decrease in food-away-from-home expenditures. The fourth income quintile had the largest percentage increase in food-at-home expenditures, 11.4 percent, from $3,917 in 2010 to $4,364 in 2011.
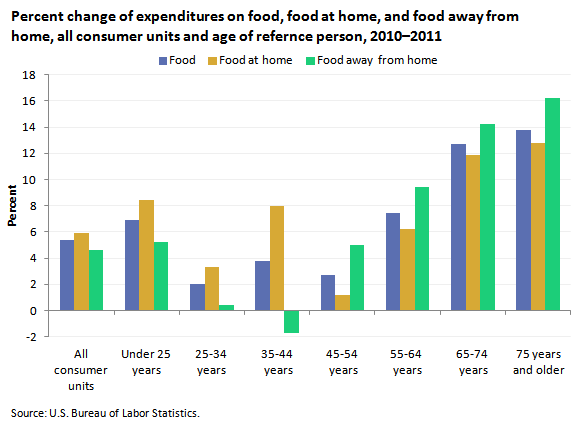
There was an increase in food expenditures across all age groups between 2010 and 2011. The two oldest age groups (65 to 74 years old and 75 and older) had the highest percentage increase in overall food expenditures, with spending rising 12.7 percent for the 65- to 74-year-old age group and 13.8 percent for the 75-and-older age group. For both of these age groups, the over-the-year percentage increase was higher for food-away-from-home expenditures than for food-at-home expenditures.
| Category | All consumer units | Under 25 years | 25-34 years | 35-44 years | 45-54 years | 55-64 years | 65-74 years | 75 years and older |
|---|---|---|---|---|---|---|---|---|
2010 | ||||||||
Food | $6,129 | $4,073 | $6,091 | $7,483 | $7,230 | $6,068 | $5,148 | $3,873 |
Food at home | 3,624 | 2,197 | 3,338 | 4,255 | 4,369 | 3,681 | 3,213 | 2,643 |
Food away from home | 2,505 | 1,876 | 2,753 | 3,227 | 2,861 | 2,387 | 1,935 | 1,230 |
2011 | ||||||||
Food | $6,458 | $4,354 | $6,211 | $7,765 | $7,424 | $6,520 | $5,804 | $4,408 |
Food at home | 3,838 | 2,382 | 3,447 | 4,594 | 4,421 | 3,908 | 3,594 | 2,980 |
Food away from home | 2,620 | 1,973 | 2,764 | 3,171 | 3,003 | 2,611 | 2,210 | 1,429 |
Percent change from 2010 to 2011 | ||||||||
Food | 5.4% | 6.9% | 2.0% | 3.8% | 2.7% | 7.4% | 12.7% | 13.8% |
Food at home | 5.9 | 8.4 | 3.3 | 8.0 | 1.2 | 6.2 | 11.9 | 12.8 |
Food away from home | 4.6 | 5.2 | 0.4 | -1.7 | 5.0 | 9.4 | 14.2 | 16.2 |
These data come from the Consumer Expenditure Survey. To learn more, see "Consumer Expenditures in 2011" (PDF), BLS Report 1042. Consumer units include families, single persons living alone or sharing a household with others but who are financially independent, or two or more persons living together who share expenses.
Bureau of Labor Statistics, U.S. Department of Labor, The Economics Daily, Consumer expenditures on food in 2011 at https://www.bls.gov/opub/ted/2013/ted_20130607.htm (visited July 16, 2026).
