An official website of the United States government
 United States Department of Labor
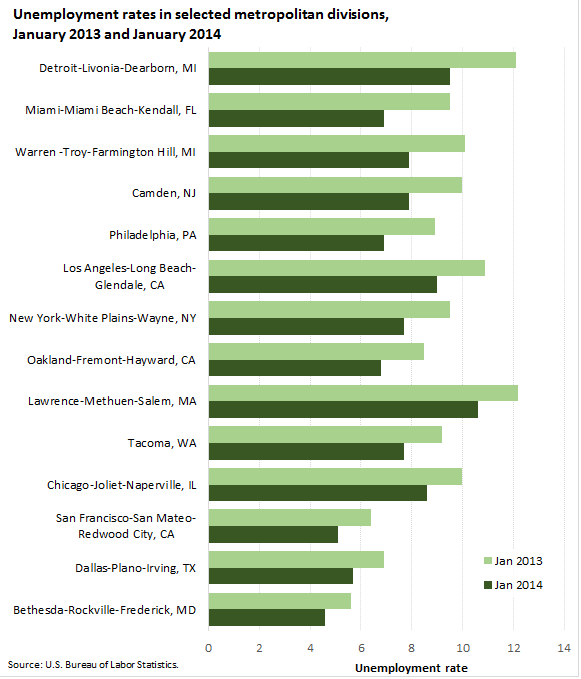
Unemployment rates were lower in January 2014 than a year earlier in 367 of 372 metropolitan areas, higher in 3 areas, and unchanged in 2 areas. The national unemployment rate was 7.0 percent in January, not seasonally adjusted, down from 8.5 percent a year earlier.

| Metropolitan Division | Jan 2013 | Jan 2014 | Difference |
|---|---|---|---|
Detroit-Livonia-Dearborn, MI | 12.1 | 9.5 | -2.6 |
Miami-Miami Beach-Kendall, FL | 9.5 | 6.9 | -2.6 |
Warren -Troy-Farmington Hill, MI | 10.1 | 7.9 | -2.2 |
Camden, NJ | 10.0 | 7.9 | -2.1 |
Philadelphia, PA | 8.9 | 6.9 | -2.0 |
Los Angeles-Long Beach-Glendale, CA | 10.9 | 9.0 | -1.9 |
New York-White Plains-Wayne, NY | 9.5 | 7.7 | -1.8 |
Oakland-Fremont-Hayward, CA | 8.5 | 6.8 | -1.7 |
Lawrence-Methuen-Salem, MA | 12.2 | 10.6 | -1.6 |
Tacoma, WA | 9.2 | 7.7 | -1.5 |
Chicago-Joliet-Naperville, IL | 10.0 | 8.6 | -1.4 |
San Francisco-San Mateo-Redwood City, CA | 6.4 | 5.1 | -1.3 |
Dallas-Plano-Irving, TX | 6.9 | 5.7 | -1.2 |
Bethesda-Rockville-Frederick, MD | 5.6 | 4.6 | -1.0 |
Eleven of the most populous metropolitan areas are made up of 34 metropolitan divisions, which are essentially separately identifiable employment centers. All 34 metropolitan divisions had over-the-year jobless rate decreases in January.
The largest of these declines occurred in Detroit-Livonia-Dearborn, Michigan, and Miami-Miami Beach-Kendall, Florida (-2.6 percentage points each). Twenty-three other divisions had rate decreases of 1.0 percentage point or more.
These metropolitan area data are from the Local Area Unemployment Statistics program and are not seasonally adjusted. To learn more, see “Metropolitan Area Employment and Unemployment — January 2014” (HTML) (PDF), news release USDL-14-0435.
Bureau of Labor Statistics, U.S. Department of Labor, The Economics Daily, Metropolitan area unemployment in January 2014 at https://www.bls.gov/opub/ted/2014/ted_20140327.htm (visited February 22, 2026).

