
An official website of the United States government
An official website of the United States government
The .gov means it's official.
Federal government websites often end in .gov or .mil. Before sharing sensitive information,
make sure you're on a federal government site.
The site is secure.
The
https:// ensures that you are connecting to the official website and that any
information you provide is encrypted and transmitted securely.
The Producer Price Index for final demand advanced 0.6 percent in April, seasonally adjusted, following a 0.5-percent rise in March and a 0.1-percent decline in February. The increase in final demand prices can be traced to the indexes for final demand goods and final demand services, both of which advanced 0.6 percent in April.
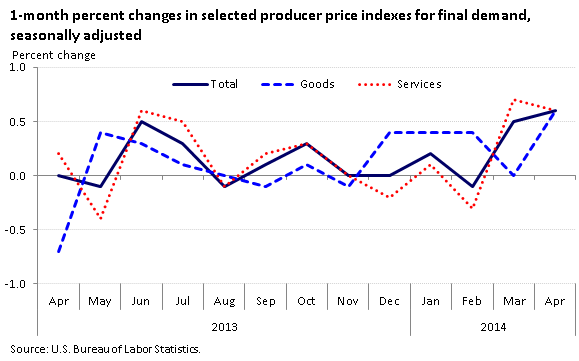
| Month | Total | Goods | Services |
|---|---|---|---|
Apr 2013 | 0.0 | -0.7 | 0.2 |
May 2013 | -0.1 | 0.4 | -0.4 |
Jun 2013 | 0.5 | 0.3 | 0.6 |
Jul 2013 | 0.3 | 0.1 | 0.5 |
Aug 2013 | -0.1 | 0.0 | -0.1 |
Sep 2013 | 0.1 | -0.1 | 0.2 |
Oct 2013 | 0.3 | 0.1 | 0.3 |
Nov 2013 | 0.0 | -0.1 | 0.0 |
Dec 2013 | 0.0 | 0.4 | -0.2 |
Jan 2014 | 0.2 | 0.4 | 0.1 |
Feb 2014 | -0.1 | 0.4 | -0.3 |
Mar 2014 | 0.5 | 0.0 | 0.7 |
Apr 2014 | 0.6 | 0.6 | 0.6 |
Leading the broad-based increase in the index for final demand goods was the index for final demand foods, which rose 2.7 percent. Prices for final demand goods less foods and energy and for final demand energy also increased in April, 0.3 percent and 0.1 percent, respectively. Much of the increase in the index for final demand services can be attributed to margins for final demand trade services, which climbed 1.4 percent in April.
Over the 12-month period from April 2013 to April 2014, the index for final demand moved up 2.1 percent, not seasonally adjusted, the largest 12-month advance since a 2.4-percent increase in March 2012. Over that same period, the index for final demand goods rose 2.5 percent and the index for final demand services rose 2.0 percent.
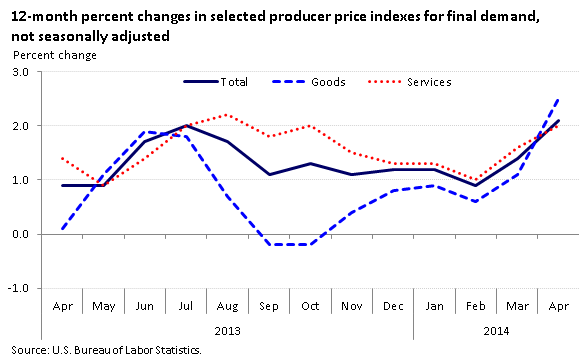
| Month | Total | Goods | Services |
|---|---|---|---|
Apr 2013 | 0.9 | 0.1 | 1.4 |
May 2013 | 0.9 | 1.1 | 0.9 |
Jun 2013 | 1.7 | 1.9 | 1.4 |
Jul 2013 | 2.0 | 1.8 | 2.0 |
Aug 2013 | 1.7 | 0.7 | 2.2 |
Sep 2013 | 1.1 | -0.2 | 1.8 |
Oct 2013 | 1.3 | -0.2 | 2.0 |
Nov 2013 | 1.1 | 0.4 | 1.5 |
Dec 2013 | 1.2 | 0.8 | 1.3 |
Jan 2014 | 1.2 | 0.9 | 1.3 |
Feb 2014 | 0.9 | 0.6 | 1.0 |
Mar 2014 | 1.4 | 1.1 | 1.6 |
Apr 2014 | 2.1 | 2.5 | 2.0 |
These data are from the BLS Producer Price Indexes program. To learn more, see "Producer Price Indexes — April 2014" (HTML) (PDF), news release USDL‑14‑0810. All producer price indexes are routinely subject to revision once, 4 months after original publication, to reflect the availability of late reports and corrections by respondents. Final demand includes goods, services, and construction which are sold for personal consumption, capital investment, government purchases, and export. Intermediate demand includes goods, services, and maintenance and repair construction sold to businesses, excluding capital investment.
Bureau of Labor Statistics, U.S. Department of Labor, The Economics Daily, Producer prices up 0.6 percent in April at https://www.bls.gov/opub/ted/2014/ted_20140516.htm (visited July 14, 2026).
