
An official website of the United States government
An official website of the United States government
The .gov means it's official.
Federal government websites often end in .gov or .mil. Before sharing sensitive information,
make sure you're on a federal government site.
The site is secure.
The
https:// ensures that you are connecting to the official website and that any
information you provide is encrypted and transmitted securely.
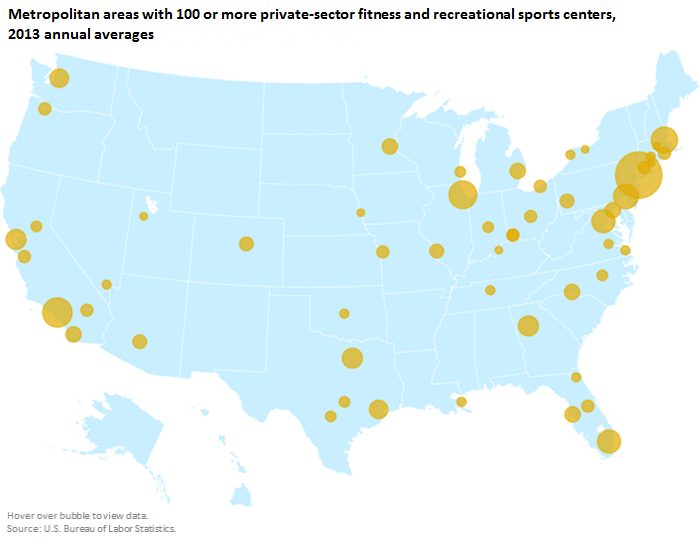
A new year, a fresh start; many Americans set New Year’s resolutions—including fitness goals—once the holiday season ends. You may find your local fitness or recreation center more crowded than usual during the first few weeks of January. Or you may be a first-time visitor. Fifty-three metropolitan areas had more than 100 private-sector fitness and recreational sports centers in 2013.
| Metropolitan Statistical Area | Establishments |
|---|---|
| New York-Newark-Jersey City, NY-NJ-PA | 2,460 |
| Los Angeles-Long Beach-Anaheim, CA | 1,004 |
| Chicago-Naperville-Elgin, IL-IN-WI | 935 |
| Boston-Cambridge-Newton, MA-NH | 827 |
| Philadelphia-Camden-Wilmington, PA-NJ-DE-MD | 743 |
| Washington-Arlington-Alexandria, DC-VA-MD-WV | 698 |
| Miami-Fort Lauderdale-West Palm Beach, FL | 675 |
| Atlanta-Sandy Springs-Roswell, GA | 518 |
| San Francisco-Oakland-Hayward, CA | 506 |
| Dallas-Fort Worth-Arlington, TX | 491 |
| Seattle-Tacoma-Bellevue, WA | 430 |
| Houston-The Woodlands-Sugar Land, TX | 421 |
| Minneapolis-St. Paul-Bloomington, MN-WI | 354 |
| Baltimore-Columbia-Towson, MD | 352 |
| Detroit-Warren-Dearborn, MI | 336 |
| Tampa-St. Petersburg-Clearwater, FL | 329 |
| Charlotte-Concord-Gastonia, NC-SC | 309 |
| San Diego-Carlsbad, CA | 304 |
| St. Louis, MO-IL | 300 |
| Phoenix-Mesa-Scottsdale, AZ | 284 |
| Pittsburgh, PA | 279 |
| Denver-Aurora-Lakewood, CO | 266 |
| Cincinnati, OH-KY-IN | 238 |
| Portland-Vancouver-Hillsboro, OR-WA | 235 |
| Providence-Warwick, RI-MA | 230 |
| Bridgeport-Stamford-Norwalk, CT | 230 |
| Riverside-San Bernardino-Ontario, CA | 230 |
| Cleveland-Elyria, OH | 221 |
| Orlando-Kissimmee-Sanford, FL | 221 |
| San Jose-Sunnyvale-Santa Clara, CA | 212 |
| Columbus, OH | 210 |
| Kansas City, MO-KS | 203 |
| Sacramento--Roseville--Arden-Arcade, CA | 201 |
| Austin-Round Rock, TX | 193 |
| Raleigh, NC | 189 |
| Indianapolis-Carmel-Anderson, IN | 176 |
| San Antonio-New Braunfels, TX | 174 |
| Milwaukee-Waukesha-West Allis, WI | 169 |
| Hartford-West Hartford-East Hartford, CT | 158 |
| Nashville-Davidson--Murfreesboro--Franklin, TN | 148 |
| Richmond, VA | 147 |
| Virginia Beach-Norfolk-Newport News, VA-NC | 147 |
| Jacksonville, FL | 146 |
| New Orleans-Metairie, LA | 142 |
| Oklahoma City, OK | 139 |
| Buffalo-Cheektowaga-Niagara Falls, NY | 130 |
| Las Vegas-Henderson-Paradise, NV | 125 |
| Rochester, NY | 121 |
| Louisville-Jefferson County, KY-IN | 120 |
| Omaha-Council Bluffs, NE-IA | 119 |
| New Haven-Milford, CT | 114 |
| Salt Lake City, UT | 111 |
| Worcester, MA-CT | 106 |
The number of fitness and recreational sports centers ranged from 106 in Worcester, Massachusetts-Connecticut, to 2,460 in New York-Newark-Jersey City, New York-New Jersey-Pennsylvania. The Los Angeles-Long Beach-Anaheim, California, area had 1,004 fitness and rec centers. Chicago-Naperville-Elgin, Illinois-Indiana-Wisconsin, had 935 centers.
In 2013, about 523,600 people worked at private-sector fitness and recreational sports centers, up from 448,500 in 2001. Sporting goods stores employed 272,800 in 2013, up from 207,800 in 2001.
| Year | Fitness and recreational sports centers | Sporting goods stores | Sporting and athletic goods manufacturing | Sporting goods merchant wholesalers |
|---|---|---|---|---|
| 2001 | 448,473 | 207,803 | 65,821 | 46,802 |
| 2002 | 457,966 | 207,029 | 62,559 | 48,454 |
| 2003 | 464,652 | 207,184 | 59,556 | 48,058 |
| 2004 | 476,461 | 213,462 | 57,042 | 48,060 |
| 2005 | 481,591 | 219,701 | 53,074 | 48,310 |
| 2006 | 491,616 | 234,756 | 52,892 | 49,098 |
| 2007 | 500,001 | 245,706 | 51,828 | 50,113 |
| 2008 | 502,694 | 250,817 | 48,725 | 48,958 |
| 2009 | 497,730 | 236,757 | 42,922 | 45,901 |
| 2010 | 488,412 | 236,700 | 41,345 | 44,367 |
| 2011 | 493,993 | 246,885 | 41,482 | 45,416 |
| 2012 | 506,218 | 257,810 | 41,435 | 47,660 |
| 2013 | 523,593 | 272,824 | 42,301 | 49,510 |
Employment in sporting and athletic goods manufacturing declined from 2001 to 2013. Employment at sporting goods wholesalers ranged between 44,400 and 50,100 over the 13-year period.
These data are from the Quarterly Census of Employment and Wages (QCEW) program. You can get more industry employment data for the nation, states, counties, and metropolitan areas through the QCEW data viewer tool.
Bureau of Labor Statistics, U.S. Department of Labor, The Economics Daily, Employment in fitness and recreational sport centers in 2013 at https://www.bls.gov/opub/ted/2015/employment-in-fitness-and-recreational-sport-centers-in-2013.htm (visited July 14, 2026).
