An official website of the United States government
 United States Department of Labor
An official website of the United States government
United States Department of Labor

The .gov means it's official.
Federal government websites often end in .gov or .mil. Before sharing sensitive information,
make sure you're on a federal government site.

The site is secure.
The
https:// ensures that you are connecting to the official website and that any
information you provide is encrypted and transmitted securely.


The Producer Price Index (PPI) program measures the average change over time in the selling prices received by domestic producers for their output. The prices included in the PPI are from the first commercial transaction for many products and some services.
PPI for final demand components, 1-month percent change, September 2026
Commodity
1-month percent change
Goods
2.6%
Foods
1.2%
Fresh fruits and melons
3.7%
Fresh and dry vegetables
41.0%
Meats
-0.2%
Processed poultry
-3.7%
Dairy products(1)
-1.1%
Soft drinks(1)
0.4%
Energy
10.8%
Residential electric power
1.4%
Residential natural gas
0.5%
Gasoline
20.3%
Jet fuel(1)
15.4%
Home heating oil and distillates
18.8%
No. 2 diesel fuel
21.0%
Goods less foods and energy
0.3%
Industrial chemicals
0.9%
Pharmaceutical preparations(1)
0.0%
Passenger cars
0.1%
Trucks, 14,000 lbs. and under
0.3%
Aircraft and aircraft equipment
0.4%
Cigarettes, including nontobacco(1)
0.0%
Services
0.8%
Trade services
1.4%
Machinery and equipment and parts and supplies wholesaling(1)
2.7%
Food and alcohol retailing
2.6%
Health and beauty retailing, including optical goods(1)
0.6%
Apparel, jewelry, footwear, and accessories retailing
-0.8%
Automobiles and automobile parts retailing
1.9%
Fuels and lubricants retailing
-25.0%
Transportation and warehousing services
3.4%
Rail transportation of freight and mail(1)
0.0%
Truck transportation of freight(1)
3.8%
Water transportation of freight(1)
0.8%
Air transportation of freight(1)
-0.7%
Courier, messenger, and U.S. postal service
1.0%
Airline passenger services
5.0%
Less trade, transportation, and warehousing
0.3%
Loan services (partial)
-0.2%
Securities brokerage, dealing, investment advice, and related services(1)
-2.0%
Portfolio management(1)
0.4%
Outpatient care (partial)
0.0%
Inpatient care
0.3%
Traveler accommodation services
5.6%
Footnotes
(1) Not seasonally adjusted.
Note: All data are subject to revision up to 4 months after originally published.

Total
+2.6%(p) in Sep 2026

Foods
+1.2%(p) in Sep 2026
Energy
+10.8%(p) in Sep 2026
Core goods
+0.3%(p) in Sep 2026
Total
+0.8%(p) in Sep 2026
Transportation and warehousing
+3.4%(p) in Sep 2026
Trade
+1.4%(p) in Sep 2026
Other
+0.3%(p) in Sep 2026
Construction
unchanged in Sep 2026
Processed goods
+2.5%(p) in Sep 2026
Unprocessed goods
+8.4%(p) in Sep 2026
Services
+0.9%(p) in Sep 2026
Stage 4 intermediate demand
+1.1%(p) in Sep 2026
Stage 3 intermediate demand
+1.1%(p) in Sep 2026
Stage 2 intermediate demand
+3.9%(p) in Sep 2026
Stage 1 intermediate demand
+2.2%(p) in Sep 2026
Motor vehicles
+0.2%(p) in Sep 2026
Pharmaceutical preparations
unchanged in Sep 2026
Gasoline
+20.3%(p) in Sep 2026
Meats
-0.2%(p) in Sep 2026
Industrial chemicals
+0.9%(p) in Sep 2026
Lumber
-1.0%(p) in Sep 2026
Steel mill products
+2.2%(p) in Sep 2026
Diesel fuel
+21.0%(p) in Sep 2026
Prepared animal feeds
+2.3%(p) in Sep 2026
Crude petroleum
+28.3%(p) in Sep 2026
Grains
+17.4%(p) in Sep 2026
Carbon steel scrap
+0.6%(p) in Sep 2026
Outpatient healthcare
unchanged in Sep 2026
Inpatient healthcare services
+0.3%(p) in Sep 2026
Food and alcohol retailing
+2.6%(p) in Sep 2026
Apparel and jewelry retailing
-0.8%(p) in Sep 2026
Airline passenger services
+5.0%(p) in Sep 2026
Securities brokerage, dealing, investment, and related services
-2.0%(p) in Sep 2026
Business loans (partial)
+0.1%(p) in Sep 2026
Legal services
+0.3%(p) in Sep 2026
Truck transportation of freight
+3.8%(p) in Sep 2026
Machinery and equipment wholesaling
+2.7%(p) in Sep 2026
 Historical Data
 News Release
SA - Seasonally Adjusted
NSA - Not Seasonally Adjusted
p - preliminary
News Release
SA - Seasonally Adjusted
NSA - Not Seasonally Adjusted
p - preliminary
10/15/2026
The Producer Price Index for final demand increased 1.3 percent in September. Prices for final
demand goods rose 2.6 percent, and the index for final demand services advanced 0.8 percent.
Prices for final demand moved up 6.3 percent for the 12 months ended in September.
HTML
|
PDF
|
RSS
|
Charts
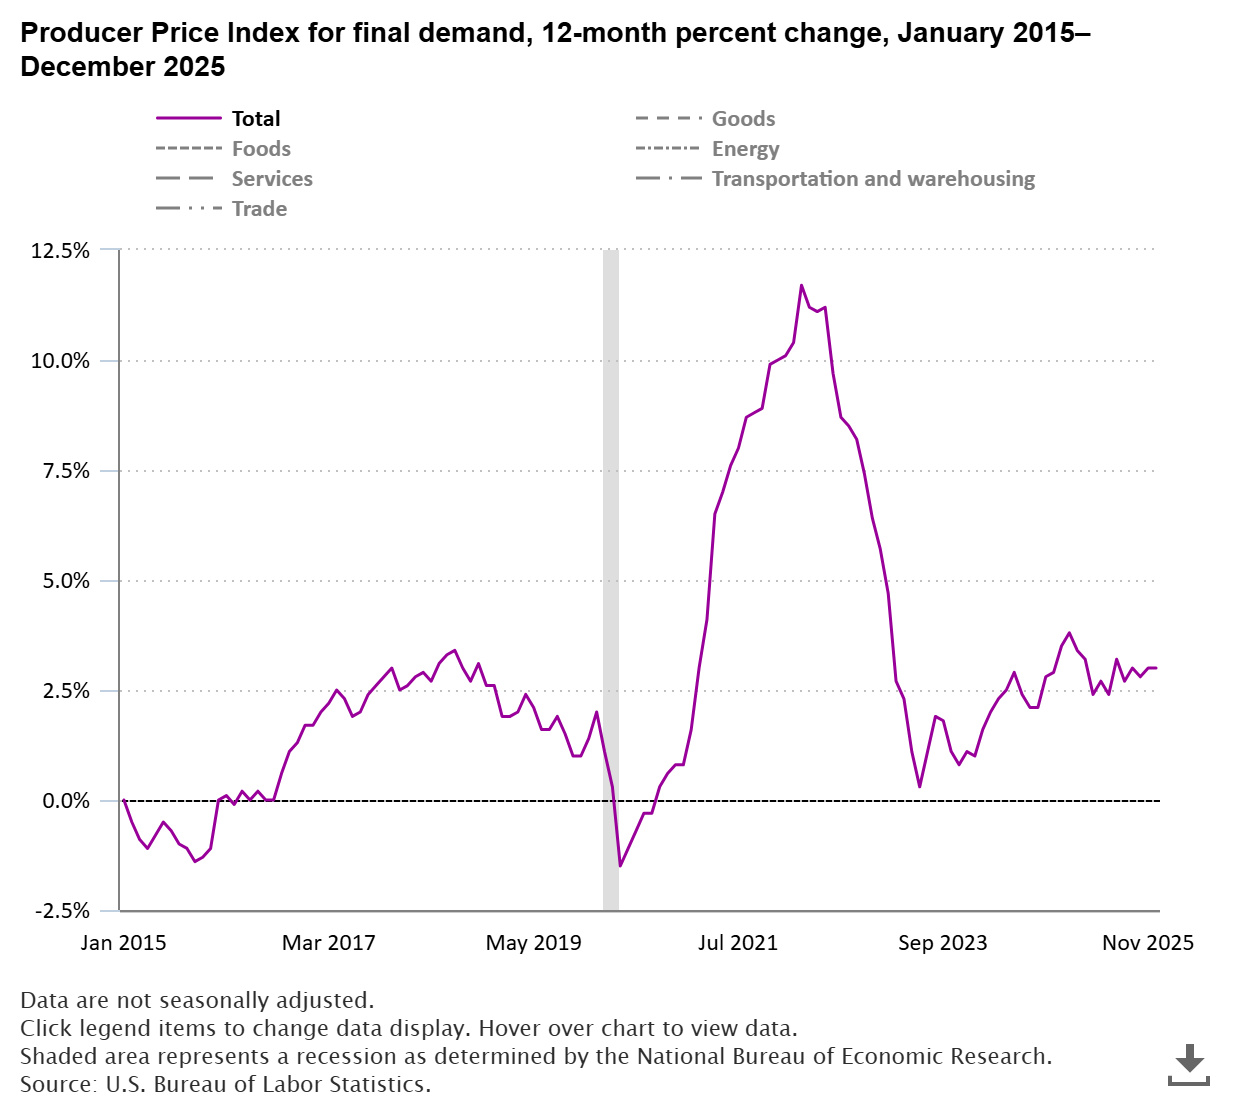
The Producer Price Index for final demand increased 3.0 percent in 2025 after rising 3.5 percent in 2024. Producer prices for goods rose 2.5 percent in 2025, while prices for services increased 3.2 percent. read more »

This Beyond the Numbers article will examine the price movement of steel in three phases: March 2020–August 2020, when the pandemic shock set in and steel prices fell; September 2020–December 2021, when the economy began to rebuild and steel prices surged; and January 2022–May 2023, when economic activity expanded but steel prices generally moved lower. read more »

This Spotlight on Statistics reviews historical establishment, employment, and wage trends for the amusement and theme parks industry. Additionally, productivity, consumer expenditures for entertainment fees and admissions, and producer prices for select amusement and theme parks products are reviewed. read more »