An official website of the United States government
An official website of the United States government
The .gov means it's official.
Federal government websites often end in .gov or .mil. Before sharing sensitive information,
make sure you're on a federal government site.
The site is secure.
The
https:// ensures that you are connecting to the official website and that any
information you provide is encrypted and transmitted securely.
21-361-NEW
Monday, March 01, 2021
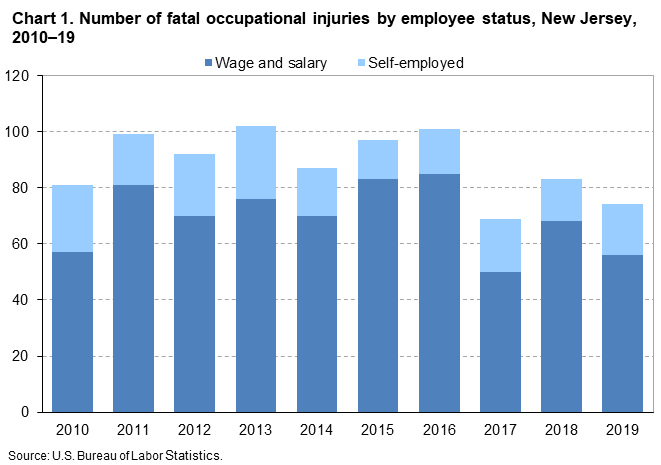
Fatal work injuries totaled 74 in 2019 for New Jersey, the U.S. Bureau of Labor Statistics reported today. Chief Regional Economist Martin Kohli noted that the number of work-related fatalities in New Jersey was down from 83 in the previous year. Fatal occupational injuries in the state have ranged from a high of 145 in 1993 to a low of 69 in 2017. (See chart 1.)
Nationwide, a total of 5,333 fatal work injuries were recorded in 2019, a 2 percent increase from the 5,250 in 2018, according to the results from the Census of Fatal Occupational Injuries (CFOI) program. The 5,333 fatal occupational injuries in 2019 represents the largest annual number since 2007.
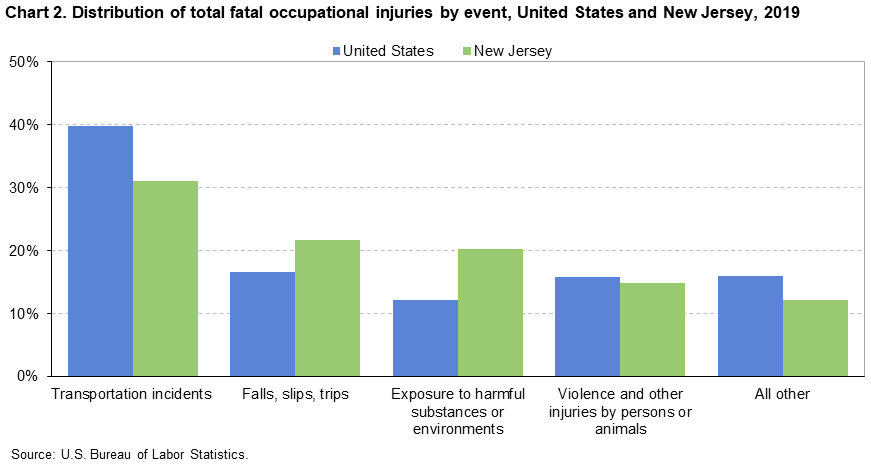
Fatal event or exposureIn New Jersey, transportation incidents resulted in 23 fatal work injuries, and falls, slips, and trips accounted for 16 fatalities. These two major categories accounted for 53 percent of all workplace fatalities in the state. (See table 1.) Worker deaths from transportation incidents were down from 32 in 2018. The number of worker fatalities due falls, slips, and trips was unchanged from 2018.
Exposures to harmful substances or environments was the third-most frequent fatal work event with 15 fatalities, up from 12 in 2018. Violence and other injuries by persons or animals resulted in 11 work-related deaths compared to 13 in 2018.
Nationally, transportation incidents were the most frequent fatal workplace event in 2019, accounting for 40 percent of fatal work injuries. (See chart 2.) Falls, slips, and trips was the second-most common fatal event (17 percent), followed by violence and other injuries by persons or animals (16 percent).
IndustryThe private construction industry sector had the highest number of fatalities in New Jersey with 18. (See table 2.) Exposure to harmful substances resulted in 7 of the 18 fatalities in the industry. The administrative and support and waste management and remediation services industry sector had 12 workplace deaths, the second highest total for any sector in New Jersey.
OccupationThe construction and extraction occupational group had the highest number of workplace fatalities with 22. (See table 3.) Construction trades workers accounted for 19 of the 22 fatalities among construction and extraction workers. The transportation and material moving occupational group had the second- highest number of workplace fatalities with 19. Motor vehicle operators accounted for 11 of the work-related deaths within the transportation and material moving group.
Additional highlightsInformation in this release incorporates revisions to both the North American Industry Classification System (NAICS) and the Standard Occupational Classification codes (SOC). Comparison of data for 2019 to prior years should be done with caution due to these changes, and thus analysis in this release is limited to 2019 for industries and occupations. More information on NAICS can be found at www.bls.gov/bls/naics.htm. More information on SOC can be found at www.bls.gov/soc/2018/home.htm.
Data in this news release are for reference year 2019. No changes in collection procedures or outputs were necessary due to COVID-19. Additional information is available at www.bls.gov/covid19/effects-of-covid-19-on-workplace-injuries-and-illnesses-compensation-and-occupational-requirements.htm.
Background of the program. The Census of Fatal Occupational Injuries (CFOI), part of the Bureau of Labor Statistics (BLS) Occupational Safety and Health Statistics (OSHS) program, is a count of all fatal work injuries occurring in the U.S. during the calendar year. The CFOI uses a variety of state, federal, and independent data sources to identify, verify, and describe fatal work injuries. This ensures counts are as complete and accurate as possible. For the 2019 national data, over 25,100 unique source documents were reviewed as part of the data collection process. For technical information and definitions for the CFOI, see the BLS Handbook of Methods on the BLS website at https://www.bls.gov/opub/hom/cfoi/home.htm and the CFOI definitions at www.bls.gov/iif/oshcfdef.htm.
Federal/State agency coverage. The CFOI includes data for all fatal work injuries, some of which may be outside the scope of other agencies or regulatory coverage. Comparisons between CFOI counts and those released by other agencies should account for the different coverage requirements and definitions used by each agency. For more information on the scope of CFOI, see www.bls.gov/iif/cfoiscope.htm and www.bls.gov/opub/hom/cfoi/concepts.htm.
Acknowledgments. BLS thanks the New Jersey Department of Health for their efforts in collecting accurate, comprehensive, and useful data on fatal work injuries. BLS also appreciates the efforts of all federal, state, local, and private sector entities that provided source documents used to identify fatal work injuries. Among these agencies are the Occupational Safety and Health Administration; the National Transportation Safety Board; the U.S. Coast Guard; the Mine Safety and Health Administration; the Office of Workers’ Compensation Programs (Federal Employees' Compensation and Longshore and Harbor Workers' Compensation divisions); the Federal Railroad Administration; the National Highway Traffic Safety Administration; state vital statistics registrars, coroners, and medical examiners; state departments of health, labor, and industrial relations and workers' compensation agencies; state and local police departments; and state farm bureaus.
Information in this release will be made available to individuals with sensory impairments upon request. Voice phone: (202) 691-5200; Federal Relay Service: (800) 877-8339.
| Event or exposure (1) | 2018 | 2019 | |
|---|---|---|---|
| Number | Number | Percent | |
|
Total |
83 | 74 | 100 |
|
Violence and other injuries by persons or animals |
13 | 11 | 15 |
|
Intentional injury by person |
13 | 11 | 15 |
|
Intentional injury by other person |
6 | 6 | 8 |
|
Shooting by other person--intentional |
3 | 5 | 7 |
|
Stabbing, cutting, slashing, piercing |
1 | 1 | 1 |
|
Self-inflicted injury--intentional |
7 | 5 | 7 |
|
Transportation incidents |
32 | 23 | 31 |
|
Roadway incidents involving motorized land vehicle |
21 | 10 | 14 |
|
Roadway collision with other vehicle |
10 | 4 | 5 |
|
Roadway collision with object other than vehicle |
11 | 6 | 8 |
|
Vehicle struck object or animal on side of roadway |
11 | 6 | 8 |
|
Nonroadway incident involving motorized land vehicles |
-- | 6 | 8 |
|
Falls, slips, trips |
16 | 16 | 22 |
|
Falls on same level |
-- | 3 | 4 |
|
Falls to lower level |
14 | 13 | 18 |
|
Other fall to lower level |
9 | 11 | 15 |
|
Other fall to lower level 11 to 15 feet |
-- | 3 | 4 |
|
Other fall to lower level more than 30 feet |
-- | 3 | 4 |
|
Exposure to harmful substances or environments |
12 | 15 | 20 |
|
Exposure to electricity |
-- | 5 | 7 |
|
Exposure to other harmful substances |
11 | 10 | 14 |
|
Nonmedical use of drugs or alcohol--unintentional overdose |
9 | 8 | 11 |
|
Contact with objects and equipment |
9 | 9 | 12 |
|
Footnotes: |
|||
|
Note: Data for all years are final. Totals for major categories may include subcategories not shown separately. For complete information on how the data are coded and presented see our definitions page at https://www.bls.gov/iif/oshcfdef.htm. Dashes indicate no data reported or data that do not meet publication criteria. CFOI fatal injury counts exclude illness-related deaths unless precipitated by an injury event. |
|||
| Industry (1) | Number | Percent |
|---|---|---|
|
Total |
74 | 100 |
|
Private industry (2) |
72 | 97 |
|
Goods producing |
-- | -- |
|
Construction |
18 | 24 |
|
Construction |
18 | 24 |
|
Service providing (3) |
-- | -- |
|
Trade, transportation, and utilities |
24 | 32 |
|
Wholesale trade |
4 | 5 |
|
Retail trade |
5 | 7 |
|
Professional and business services |
-- | -- |
|
Administrative and support and waste management and remediation services |
12 | 16 |
|
Leisure and hospitality |
4 | 5 |
|
Accommodation and food services |
4 | 5 |
|
Food services and drinking places |
4 | 5 |
|
Restaurants and other eating places |
4 | 5 |
|
Restaurants and other eating places |
4 | 5 |
|
Full-service restaurants |
4 | 5 |
|
Other services, except public administration |
4 | 5 |
|
Other services, except public administration |
4 | 5 |
|
Footnotes: |
||
|
Note: Data for all years are final. Totals for major categories may include subcategories not shown separately. For complete information on how the data are coded and presented see our definitions page at https://www.bls.gov/iif/oshcfdef.htm. Dashes indicate no data reported or data that do not meet publication criteria. CFOI fatal injury counts exclude illness-related deaths unless precipitated by an injury event. |
||
| Occupation (1) | Number | Percent |
|---|---|---|
|
Total |
74 | 100 |
|
Management occupations |
4 | 5 |
|
Architecture and engineering occupations |
3 | 4 |
|
Food preparation and serving related occupations |
3 | 4 |
|
Building and grounds cleaning and maintenance occupations |
5 | 7 |
|
Grounds maintenance workers |
5 | 7 |
|
Grounds maintenance workers |
5 | 7 |
|
Sales and related occupations |
5 | 7 |
|
Supervisors of sales workers |
3 | 4 |
|
First-line supervisors of sales workers |
3 | 4 |
|
Construction and extraction occupations |
22 | 30 |
|
Construction trades workers |
19 | 26 |
|
Carpenters |
6 | 8 |
|
Carpenters |
6 | 8 |
|
Construction laborers |
7 | 9 |
|
Construction laborers |
7 | 9 |
|
Installation, maintenance, and repair occupations |
7 | 9 |
|
Vehicle and mobile equipment mechanics, installers, and repairers |
3 | 4 |
|
Transportation and material moving occupations |
19 | 26 |
|
Motor vehicle operators |
11 | 15 |
|
Driver/sales workers and truck drivers |
11 | 15 |
|
Heavy and tractor-trailer truck drivers |
9 | 12 |
|
Footnotes: |
||
|
Note: Data for all years are final. Totals for major categories may include subcategories not shown separately. For complete information on how the data are coded and presented see our definitions page at https://www.bls.gov/iif/oshcfdef.htm. Dashes indicate no data reported or data that do not meet publication criteria. CFOI fatal injury counts exclude illness-related deaths unless precipitated by an injury event. |
||
| Worker characteristics | 2018 | 2019 | |
|---|---|---|---|
| Number | Number | Percent | |
|
Total |
83 | 74 | 100 |
|
Employee status |
|||
|
Wage and salary workers (1) |
68 | 56 | 76 |
|
Self-employed (2) |
15 | 18 | 24 |
|
Gender |
|||
|
Men |
77 | 69 | 93 |
|
Women |
6 | 5 | 7 |
|
Age (3) |
|||
|
20 to 24 years |
7 | 8 | 11 |
|
25 to 34 years |
10 | 11 | 15 |
|
35 to 44 years |
16 | 8 | 11 |
|
45 to 54 years |
20 | 11 | 15 |
|
55 to 64 years |
19 | 29 | 39 |
|
Race or ethnic origin (4) |
|||
|
White, non-Hispanic |
43 | 35 | 47 |
|
Black or African-American, non-Hispanic |
11 | 12 | 16 |
|
Hispanic or Latino |
22 | 23 | 31 |
|
Asian, non-Hispanic |
4 | 4 | 5 |
|
Footnotes: |
|||
|
Note: Data for all years are final. Totals for major categories may include subcategories not shown separately. For complete information on how the data are coded and presented see our definitions page at https://www.bls.gov/iif/oshcfdef.htm. Dashes indicate no data reported or data that do not meet publication criteria. CFOI fatal injury counts exclude illness-related deaths unless precipitated by an injury event. |
|||
Last Modified Date: Monday, March 01, 2021