An official website of the United States government
An official website of the United States government
The .gov means it's official.
Federal government websites often end in .gov or .mil. Before sharing sensitive information,
make sure you're on a federal government site.
The site is secure.
The
https:// ensures that you are connecting to the official website and that any
information you provide is encrypted and transmitted securely.
25-337-PHI
Thursday, March 06, 2025
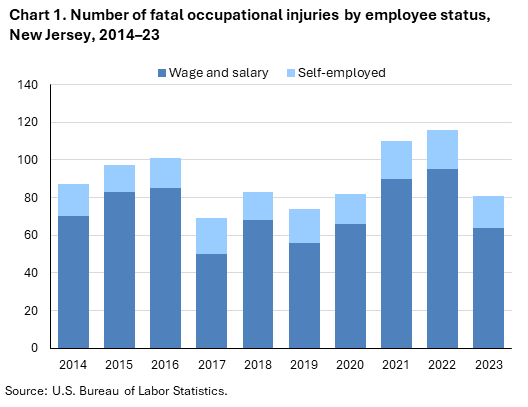
Fatal work injuries totaled 81 in 2023 for New Jersey, the U.S. Bureau of Labor Statistics reported today. Regional Commissioner Alexandra Hall Bovee noted that the number of work-related fatalities in New Jersey was down from the previous year. (See chart 1.) Fatal occupational injuries in the state have ranged from a high of 145 in 1993 to a low of 69 in 2017. Nationwide, a total of 5,283 fatal work injuries were recorded in 2023, a 3.7-percent decrease from 5,486 in 2022, according to the results from the Census of Fatal Occupational Injuries (CFOI).
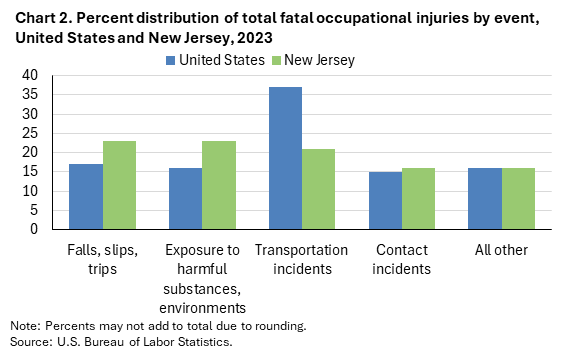
Fatal event or exposureFalls, slips, and trips and exposure to harmful substances or environments were both the most frequent types of fatal events in New Jersey, with 19 fatalities each. Combined, they accounted for 47 percent of all fatal work injuries in the state. Nationally, falls, slips, and trips accounted for 17 percent and exposure to harmful substances or environments was 16 percent. (See chart 2 and table 1.)
Transportation incidents (17) accounted for 21 percent of New Jersey workplace fatalities; nationally the share was 37 percent.
The construction sector had 18 fatalities. (See table 2.)
Falls, slips, and trips resulted in 10 of the 18 construction sector fatalities.
The specialty trade contractors subsector accounted for 11 of the sector’s fatal workplace injuries.
The transportation and material moving occupational group had the highest number of fatal workplace injuries with 19. (See table 3.)
Transportation incidents resulted in 9 of the transportation and material moving fatalities.
Driver/sales workers and truck drivers accounted for 11 of the major group’s fatal workplace injuries.
Wage and salary workers accounted for 79 percent of workplace fatalities in New Jersey; the self-employed comprised the remaining 21 percent. (See chart 1 and table 4.) Nationally, wage and salary workers comprised 83 percent of fatalities.
Males accounted for 95 percent of the work-related fatalities in New Jersey; the national share was 91 percent.
Workers 25-54 years old accounted for 54 percent of the state’s work-related fatalities, compared to 57 percent of on-the-job fatalities nationally.
White non-Hispanics accounted for 63 percent of those who died from a workplace injury. Nationwide, this group accounted for 56 percent of work-related deaths.
The 2022 North American Industry Classification System (NAICS) and the updated Occupational Injury and Illness Classification System (OIICS) were implemented with the release of 2023 data. As a result of these changes, comparisons between 2023 CFOI data and previous years should be made with caution. Refer to the national release technical note for more information.
Background of the program. The Census of Fatal Occupational Injuries (CFOI), part of the Bureau of Labor Statistics (BLS) Occupational Safety and Health Statistics (OSHS) program, is a count of all fatalities resulting from workplace injuries occurring in the U.S. during the calendar year. For technical information and definitions for the CFOI, see the national CFOI release Technical notes, the BLS Handbook of Methods, and the CFOI definitions.
Acknowledgments. BLS thanks the New Jersey Department of Health for their efforts in collecting accurate, comprehensive, and useful data on fatal work injuries. BLS also appreciates the efforts of all federal, state, local, and private sector entities that provided source documents used to identify fatal work injuries nationally. See the national CFOI release Technical Notes for details on cooperating entities.
Information in this release will be made available to individuals with sensory impairments upon request. Voice phone: (202) 691-5200; Telecommunications Relay Service: 7-1-1.
| Event or Exposure (1) | Number | Percent (%) |
|---|---|---|
All events and exposures | 81 | 100 |
Violent acts | 9 | 11 |
Transportation incidents | 17 | 21 |
Pedestrian incidents involving motorized land vehicles | 4 | 5 |
Roadway incidents involving motorized land vehicle | 10 | 12 |
Roadway collision with other vehicle(s) | 4 | 5 |
Roadway collision with object other than vehicle | 6 | 7 |
Collision with object or animal on side of roadway | 6 | 7 |
Falls, slips, trips | 19 | 23 |
Fall to lower level | 15 | 19 |
Other fall to lower level | 12 | 15 |
Other fall to lower level- 6 to 30 feet | 5 | 6 |
Other fall to lower level- more than 30 feet | 3 | 4 |
Exposure to harmful substances, environments | 19 | 23 |
Exposure to harmful substances | 19 | 23 |
Contact incidents | 13 | 16 |
Struck by propelled, falling, or suspended object | 5 | 6 |
Struck, caught, or compressed by running powered equipment | 4 | 5 |
Footnotes: | ||
NOTE: Data for all years are revised and final. Totals for major categories may include subcategories not shown separately. Dashes indicate no data reported or data that do not meet publication criteria. CFOI fatal injury counts exclude illness-related deaths unless precipitated by an injury event. | ||
| Industry | Number | Percent (%) |
|---|---|---|
Total | 81 | 100 |
Private industry (1) | 70 | 86 |
Natural resources and mining | 3 | 4 |
Agriculture, forestry, fishing and hunting | 3 | 4 |
Construction | 18 | 22 |
Construction | 18 | 22 |
Specialty trade contractors | 11 | 14 |
Foundation, structure, and building exterior contractors | 4 | 5 |
Building equipment contractors | 4 | 5 |
Electrical contractors and other wiring installation contractors | 4 | 5 |
Manufacturing | 6 | 7 |
Manufacturing | 6 | 7 |
Trade, transportation, and utilities | -- | -- |
Retail trade | 5 | 6 |
Transportation and warehousing | 12 | 15 |
Truck transportation | 6 | 7 |
General freight trucking | 3 | 4 |
General freight trucking, local | 3 | 4 |
Specialized freight trucking | 3 | 4 |
Specialized freight (except used goods) trucking, local | 3 | 4 |
Transit and ground passenger transportation | 3 | 4 |
Taxi and limousine service | 3 | 4 |
Information | -- | -- |
Financial activities | -- | -- |
Professional and business services | 8 | 10 |
Administrative and support and waste management and remediation services | 5 | 6 |
Educational and health services | -- | -- |
Leisure and hospitality | 4 | 5 |
Arts, entertainment, and recreation | 4 | 5 |
Other services (except public administration) | 7 | 9 |
Other services (except public administration) | 7 | 9 |
Repair and maintenance | 4 | 5 |
Personal and laundry services | 3 | 4 |
Personal care services | 3 | 4 |
Government (2) | 11 | 14 |
Federal government | -- | -- |
State government | -- | -- |
Local government | -- | -- |
Footnotes: | ||
NOTE: Data for all years are revised and final. Totals for major categories may include subcategories not shown separately. Dashes indicate no data reported or data that do not meet publication criteria. CFOI fatal injury counts exclude illness-related deaths unless precipitated by an injury event. | ||
| Occupation (1) | Number | Percent (%) |
|---|---|---|
All occupations | 81 | 100 |
Arts, design, entertainment, sports, and media occupations | 3 | 4 |
Building and grounds cleaning and maintenance occupations | 5 | 6 |
Personal care and service occupations | 5 | 6 |
Farming, fishing, and forestry occupations | 3 | 4 |
Construction and extraction occupations | 16 | 20 |
Supervisors of construction and extraction workers | 5 | 6 |
First-line supervisors of construction trades and extraction workers | 5 | 6 |
First-line supervisors of construction trades and extraction workers | 5 | 6 |
Construction trades workers | 11 | 14 |
Construction laborers | 6 | 7 |
Construction laborers | 6 | 7 |
Installation, maintenance, and repair occupations | 10 | 12 |
Supervisors of installation, maintenance, and repair workers | 3 | 4 |
First-line supervisors of mechanics, installers, and repairers | 3 | 4 |
First-line supervisors of mechanics, installers, and repairers | 3 | 4 |
Other installation, maintenance, and repair occupations | 3 | 4 |
Production occupations | 4 | 5 |
Transportation and material moving occupations | 19 | 23 |
Motor vehicle operators | 14 | 17 |
Driver/sales workers and truck drivers | 11 | 14 |
Heavy and tractor-trailer truck drivers | 8 | 10 |
Passenger vehicle drivers | 3 | 4 |
Taxi drivers | 3 | 4 |
Footnotes: | ||
NOTE: Data for all years are revised and final. Totals for major categories may include subcategories not shown separately. Dashes indicate no data reported or data that do not meet publication criteria. CFOI fatal injury counts exclude illness-related deaths unless precipitated by an injury event. | ||
| Demographic | Number | Percent (%) |
|---|---|---|
Total | 81 | 100 |
Employee status | ||
Wage and salary workers (1) | 64 | 79 |
Self-employed (2) | 17 | 21 |
Sex | ||
Male | 77 | 95 |
Female | 4 | 5 |
Age (3) | ||
Under 16 years | -- | -- |
16 to 17 years | -- | -- |
18 to 19 years | -- | -- |
20 to 24 years | -- | -- |
25 to 34 years | 11 | 14 |
35 to 44 years | 18 | 22 |
45 to 54 years | 15 | 19 |
55 to 64 years | 21 | 26 |
65 years and over | 11 | 14 |
Race or ethnic origin (4) | ||
White, non-Hispanic | 51 | 63 |
Black or African-American, non-Hispanic | -- | -- |
Hispanic or Latino | 20 | 25 |
American Indian or Alaska Native, non-Hispanic | -- | -- |
Asian, non-Hispanic | -- | -- |
Native Hawaiian or Pacific Islander, non-Hispanic | -- | -- |
Footnotes: | ||
NOTE: Data for all years are revised and final. Totals for major categories may include subcategories not shown separately. Dashes indicate no data reported or data that do not meet publication criteria. CFOI fatal injury counts exclude illness-related deaths unless precipitated by an injury event. | ||
Last Modified Date: Thursday, March 06, 2025