An official website of the United States government
An official website of the United States government
The .gov means it's official.
Federal government websites often end in .gov or .mil. Before sharing sensitive information,
make sure you're on a federal government site.
The site is secure.
The
https:// ensures that you are connecting to the official website and that any
information you provide is encrypted and transmitted securely.
25-339-PHI
Thursday, March 06, 2025
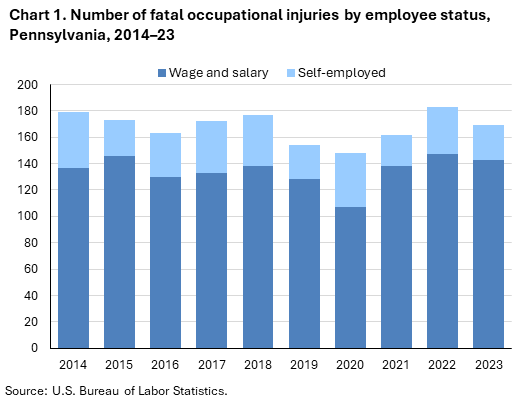
Fatal work injuries totaled 169 in 2023 for Pennsylvania, the U.S. Bureau of Labor Statistics reported today. Regional Commissioner Alexandra Hall Bovee noted that the number of work-related fatalities in Pennsylvania was down from the previous year. (See chart 1.) Fatal occupational injuries in the state have ranged from a high of 354 in 1994 to a low of 148 in 2020. Nationwide, a total of 5,283 fatal work injuries were recorded in 2023, a 3.7-percent decrease from 5,486 in 2022, according to the results from the Census of Fatal Occupational Injuries (CFOI).
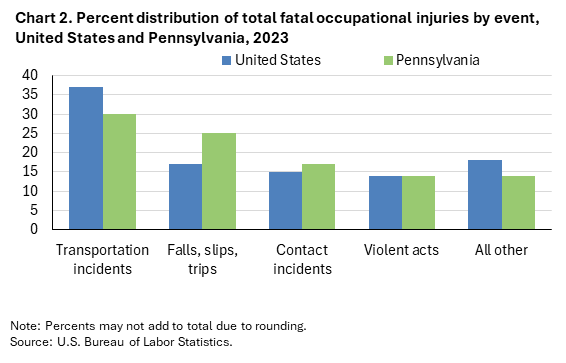
Fatal event or exposureTransportation incidents (50) were the most frequent type of fatal event in Pennsylvania, accounting for 30 percent of all fatal work injuries in the state. Nationally the share was 37 percent. (See chart 2 and table 1.)
Falls, slips, and trips (43) accounted for 25 percent of Pennsylvania workplace fatalities; nationally the share was 17 percent.
The construction sector had the highest number of fatalities with 30. (See table 2.)
Falls, slips, and trips resulted in 16 of the 30 construction sector fatalities.
The specialty trade contractors subsector accounted for 17 of the sector’s fatal workplace injuries.
The transportation and material moving occupational group had the highest number of fatal workplace injuries with 46. (See table 3.)
Transportation incidents resulted in 30 of the transportation and material moving fatalities.
Motor vehicle operators accounted for 32 of the major group’s fatal workplace injuries.
Wage and salary workers accounted for 85 percent of workplace fatalities in Pennsylvania; the self-employed comprised the remaining 15 percent. (See chart 1 and table 4.) Nationally, wage and salary workers comprised 83 percent of fatalities.
Males accounted for 89 percent of fatal workplace injuries in Pennsylvania, similar to the national share of 91 percent.
Workers 25-54 years old accounted for 51 percent of the state’s work-related fatalities, compared to 57 percent of on-the-job fatalities nationally. Workers 55 years and older accounted for 42 percent of the state’s work-related fatalities in 2023, compared to 35 percent of on-the-job fatalities nationally.
White non-Hispanics accounted for 71 percent of those who died from a workplace injury. Nationwide, this group accounted for 56 percent of work-related deaths.
The 2022 North American Industry Classification System (NAICS) and the updated Occupational Injury and Illness Classification System (OIICS) were implemented with the release of 2023 data. As a result of these changes, comparisons between 2023 CFOI data and previous years should be made with caution. Refer to the national release technical note for more information.
Background of the program. The Census of Fatal Occupational Injuries (CFOI), part of the Bureau of Labor Statistics (BLS) Occupational Safety and Health Statistics (OSHS) program, is a count of all fatalities resulting from workplace injuries occurring in the U.S. during the calendar year. For technical information and definitions for the CFOI, see the national CFOI release Technical notes, the BLS Handbook of Methods, and the CFOI definitions.
Acknowledgments. BLS thanks the Pennsylvania Department of Health for their efforts in collecting accurate, comprehensive, and useful data on fatal work injuries. BLS also appreciates the efforts of all federal, state, local, and private sector entities that provided source documents used to identify fatal work injuries nationally. See the national CFOI release Technical Notes for details on cooperating entities.
Information in this release will be made available to individuals with sensory impairments upon request. Voice phone: (202) 691-5200; Telecommunications Relay Service: 7-1-1.
| Event or Exposure (1) | Number | Percent (%) |
|---|---|---|
All events and exposures | 169 | 100 |
Violent acts | 24 | 14 |
Homicides (violent acts by other person) | 11 | 7 |
Shooting by other person | 9 | 5 |
Stabbing, cutting, slashing by other person | 1 | 1 |
Suicides (intentional self-harm) | 13 | 8 |
Intentional self-harm-- shooting | 8 | 5 |
Intentional self-harm-- hanging, strangulation, asphyxiation | 5 | 3 |
Transportation incidents | 50 | 30 |
Aircraft incidents | 1 | 1 |
In-flight crash, collision | 1 | 1 |
Low altitude entanglement | 1 | 1 |
Pedestrian incidents involving motorized land vehicles | 15 | 9 |
Pedestrian struck by vehicle in nonroadway area | 8 | 5 |
Pedestrian struck by forward-moving vehicle in nonroadway area | 4 | 2 |
Roadway incidents involving motorized land vehicle | 28 | 17 |
Roadway collision with other vehicle(s) | 12 | 7 |
Roadway collision with other vehicle(s)-intersecting, turning | 1 | 1 |
Roadway collision with other vehicle(s)-moving in same direction | 1 | 1 |
Roadway collision with other vehicle(s)-moving in opposite directions, oncoming | 7 | 4 |
Roadway collision with other vehicle(s)-moving and standing vehicle | 3 | 2 |
Roadway collision with object other than vehicle | 11 | 7 |
Collision with object or animal on side of roadway | 11 | 7 |
Roadway noncollision incident | 5 | 3 |
Roadway noncollision- vehicle overturn | 3 | 2 |
Nonroadway incidents involving motorized land vehicles | 6 | 4 |
Nonroadway collision with object other than vehicle | 3 | 2 |
Nonroadway noncollision incident | 3 | 2 |
Falls, slips, trips | 43 | 25 |
Fall to lower level | 28 | 17 |
Fall to lower level resulting in exposure or contact | 1 | 1 |
Fall to lower level resulting in exposure or contact- less than 6 feet | 1 | 1 |
Other fall to lower level | 25 | 15 |
Other fall to lower level- 6 to 30 feet | 10 | 6 |
Other fall to lower level- more than 30 feet | 3 | 2 |
Slip, trip, stumble or fall on same level | 12 | 7 |
Fall on same level | 12 | 7 |
Exposure to harmful substances, environments | 14 | 8 |
Exposure to electricity | 1 | 1 |
Direct exposure to electricity | 1 | 1 |
Direct exposure to electricity- greater than 220 volts | 1 | 1 |
Exposure to harmful substances | 12 | 7 |
Exposure to oxygen deficiency | 1 | 1 |
Drowning, submersion without other event | 1 | 1 |
Contact incidents | 29 | 17 |
Collapse, engulfment | 1 | 1 |
Collapse, engulfment- loose materials or liquids | 1 | 1 |
Struck by propelled, falling, or suspended object | 16 | 9 |
Struck, caught, or compressed by running powered equipment | 10 | 6 |
Struck by running powered equipment- during maintenance, cleaning, testing | 3 | 2 |
Caught or entangled in running powered equipment | 4 | 2 |
Struck by rolling powered vehicle or machinery | 3 | 2 |
Footnotes: | ||
NOTE: Data for all years are revised and final. Totals for major categories may include subcategories not shown separately. Dashes indicate no data reported or data that do not meet publication criteria. CFOI fatal injury counts exclude illness-related deaths unless precipitated by an injury event. | ||
| Industry | Number | Percent (%) |
|---|---|---|
Total | 169 | 100 |
Private industry (1) | 159 | 94 |
Natural resources and mining | 13 | 8 |
Agriculture, forestry, fishing and hunting | 10 | 6 |
Crop production | 5 | 3 |
Oilseed and grain farming | 4 | 2 |
Animal production and aquaculture | 3 | 2 |
Cattle ranching and farming | 3 | 2 |
Dairy cattle and milk production | 3 | 2 |
Forestry and logging | 1 | 1 |
Logging | 1 | 1 |
Logging | 1 | 1 |
Support activities for agriculture and forestry | 1 | 1 |
Support activities for crop production | 1 | 1 |
Support activities for crop production | 1 | 1 |
Soil preparation, planting, and cultivating | 1 | 1 |
Mining, quarrying, and oil and gas extraction | 3 | 2 |
Oil and gas extraction | 1 | 1 |
Oil and gas extraction | 1 | 1 |
Crude petroleum extraction | 1 | 1 |
Mining (except oil and gas) | 2 | 1 |
Coal mining | 1 | 1 |
Coal mining | 1 | 1 |
Underground coal mining | 1 | 1 |
Nonmetallic mineral mining and quarrying | 1 | 1 |
Stone mining and quarrying | 1 | 1 |
Crushed and broken limestone mining and quarrying | 1 | 1 |
Construction | 30 | 18 |
Construction | 30 | 18 |
Construction of buildings | 8 | 5 |
Residential building construction | 5 | 3 |
Residential building construction | 5 | 3 |
Residential remodelers | 3 | 2 |
Nonresidential building construction | 3 | 2 |
Commercial and institutional building construction | 1 | 1 |
Heavy and civil engineering construction | 4 | 2 |
Specialty trade contractors | 17 | 10 |
Foundation, structure, and building exterior contractors | 8 | 5 |
Roofing contractors | 5 | 3 |
Nonresidential roofing contractors | 2 | 1 |
Other foundation, structure, and building exterior contractors | 1 | 1 |
Building equipment contractors | 5 | 3 |
Electrical contractors and other wiring installation contractors | 3 | 2 |
Manufacturing | 29 | 17 |
Manufacturing | 29 | 17 |
Food manufacturing | 9 | 5 |
Wood product manufacturing | 3 | 2 |
Plastics and rubber products manufacturing | 1 | 1 |
Plastics product manufacturing | 1 | 1 |
Primary metal manufacturing | 3 | 2 |
Steel product manufacturing from purchased steel | 1 | 1 |
Rolling and drawing of purchased steel | 1 | 1 |
Rolled steel shape manufacturing | 1 | 1 |
Fabricated metal product manufacturing | 3 | 2 |
Miscellaneous manufacturing | 3 | 2 |
Trade, transportation, and utilities | 49 | 29 |
Wholesale trade | 7 | 4 |
Retail trade | 14 | 8 |
Motor vehicle and parts dealers | 3 | 2 |
Food and beverage retailers | 7 | 4 |
General merchandise retailers | 1 | 1 |
Department stores | 1 | 1 |
Department stores | 1 | 1 |
Transportation and warehousing | 28 | 17 |
Truck transportation | 22 | 13 |
General freight trucking | 18 | 11 |
General freight trucking, local | 4 | 2 |
General freight trucking, long-distance | 14 | 8 |
General freight trucking, long-distance, truckload | 9 | 5 |
General freight trucking, long-distance, less than truckload | 1 | 1 |
Specialized freight trucking | 4 | 2 |
Specialized freight (except used goods) trucking, long-distance | 2 | 1 |
Information | -- | -- |
Financial activities | -- | -- |
Professional and business services | 13 | 8 |
Administrative and support and waste management and remediation services | 13 | 8 |
Administrative and support services | 9 | 5 |
Services to buildings and dwellings | 5 | 3 |
Landscaping services | 5 | 3 |
Waste management and remediation services | 4 | 2 |
Waste collection | 3 | 2 |
Waste collection | 3 | 2 |
Solid waste collection | 3 | 2 |
Waste treatment and disposal | 1 | 1 |
Waste treatment and disposal | 1 | 1 |
Hazardous waste treatment and disposal | 1 | 1 |
Educational and health services | 6 | 4 |
Educational services | 2 | 1 |
Educational services | 2 | 1 |
Elementary and secondary schools | 2 | 1 |
Elementary and secondary schools | 2 | 1 |
Health care and social assistance | 4 | 2 |
Social assistance | 1 | 1 |
Individual and family services | 1 | 1 |
Services for the elderly and persons with disabilities | 1 | 1 |
Leisure and hospitality | 11 | 7 |
Arts, entertainment, and recreation | 6 | 4 |
Amusement, gambling, and recreation industries | 6 | 4 |
Other amusement and recreation industries | 6 | 4 |
Accommodation and food services | 5 | 3 |
Accommodation | 1 | 1 |
Traveler accommodation | 1 | 1 |
Food services and drinking places | 4 | 2 |
Restaurants and other eating places | 4 | 2 |
Restaurants and other eating places | 4 | 2 |
Other services (except public administration) | 8 | 5 |
Other services (except public administration) | 8 | 5 |
Repair and maintenance | 4 | 2 |
Commercial and industrial machinery and equip.(except auto and electronic) repair and maintenance | 1 | 1 |
Commercial and industrial machinery and equip.(except auto and electronic) repair and maintenance | 1 | 1 |
Government (2) | 10 | 6 |
Federal government | -- | -- |
State government | 3 | 2 |
Local government | 7 | 4 |
Footnotes: | ||
NOTE: Data for all years are revised and final. Totals for major categories may include subcategories not shown separately. Dashes indicate no data reported or data that do not meet publication criteria. CFOI fatal injury counts exclude illness-related deaths unless precipitated by an injury event. | ||
| Occupation (1) | Number | Percent (%) |
|---|---|---|
All occupations | 169 | 100 |
Management occupations | 11 | 7 |
Operations specialties managers | 3 | 2 |
Industrial production managers | 1 | 1 |
Industrial production managers | 1 | 1 |
Other management occupations | 6 | 4 |
Educational instruction and library occupations | 1 | 1 |
Arts, design, entertainment, sports, and media occupations | 1 | 1 |
Entertainers and performers, sports and related workers | 1 | 1 |
Athletes, coaches, umpires, and related workers | 1 | 1 |
Healthcare support occupations | 1 | 1 |
Home health and personal care aides; and nursing assistants, orderlies, and psychiatric aides | 1 | 1 |
Home health and personal care aides | 1 | 1 |
Home health aides | 1 | 1 |
Protective service occupations | 12 | 7 |
Other protective service workers | 5 | 3 |
Food preparation and serving related occupations | 4 | 2 |
Cooks and food preparation workers | 4 | 2 |
Cooks | 4 | 2 |
Building and grounds cleaning and maintenance occupations | 7 | 4 |
Personal care and service occupations | 3 | 2 |
Supervisors of personal care and service workers | 1 | 1 |
First-line supervisors of entertainment and recreation workers | 1 | 1 |
First-line supervisors of entertainment and recreation workers, except gambling services | 1 | 1 |
Sales and related occupations | 8 | 5 |
Supervisors of sales workers | 4 | 2 |
First-line supervisors of sales workers | 4 | 2 |
First-line supervisors of retail sales workers | 4 | 2 |
Retail sales workers | 3 | 2 |
Retail salespersons | 3 | 2 |
Retail salespersons | 3 | 2 |
Other sales and related workers | 1 | 1 |
Office and administrative support occupations | 6 | 4 |
Information and record clerks | 3 | 2 |
Farming, fishing, and forestry occupations | 4 | 2 |
Forest, conservation, and logging workers | 1 | 1 |
Logging workers | 1 | 1 |
Fallers | 1 | 1 |
Construction and extraction occupations | 32 | 19 |
Supervisors of construction and extraction workers | 6 | 4 |
First-line supervisors of construction trades and extraction workers | 6 | 4 |
First-line supervisors of construction trades and extraction workers | 6 | 4 |
Construction trades workers | 22 | 13 |
Construction laborers | 9 | 5 |
Construction laborers | 9 | 5 |
Painters and paperhangers | 1 | 1 |
Painters, construction and maintenance | 1 | 1 |
Roofers | 4 | 2 |
Roofers | 4 | 2 |
Extraction workers | 2 | 1 |
Installation, maintenance, and repair occupations | 12 | 7 |
Vehicle and mobile equipment mechanics, installers, and repairers | 4 | 2 |
Other installation, maintenance, and repair occupations | 4 | 2 |
Maintenance and repair workers, general | 2 | 1 |
Maintenance and repair workers, general | 2 | 1 |
Production occupations | 17 | 10 |
Assemblers and fabricators | 3 | 2 |
Miscellaneous assemblers and fabricators | 3 | 2 |
Metal workers and plastic workers | 3 | 2 |
Forming machine setters, operators, and tenders, metal and plastic | 1 | 1 |
Rolling machine setters, operators, and tenders, metal and plastic | 1 | 1 |
Woodworkers | 3 | 2 |
Other production occupations | 5 | 3 |
Miscellaneous production workers | 5 | 3 |
Transportation and material moving occupations | 46 | 27 |
Air transportation workers | 1 | 1 |
Aircraft pilots and flight engineers | 1 | 1 |
Commercial pilots | 1 | 1 |
Motor vehicle operators | 32 | 19 |
Material moving workers | 11 | 7 |
Laborers and material movers | 6 | 4 |
Laborers and freight, stock, and material movers, hand | 5 | 3 |
Stockers and order fillers | 1 | 1 |
Footnotes: | ||
NOTE: Data for all years are revised and final. Totals for major categories may include subcategories not shown separately. Dashes indicate no data reported or data that do not meet publication criteria. CFOI fatal injury counts exclude illness-related deaths unless precipitated by an injury event. | ||
| Demographic | Number | Percent (%) |
|---|---|---|
Total | 169 | 100 |
Employee status | ||
Wage and salary workers (1) | 143 | 85 |
Self-employed (2) | 26 | 15 |
Sex | ||
Male | 150 | 89 |
Female | 17 | 10 |
Age (3) | ||
Under 16 years | -- | -- |
16 to 17 years | -- | -- |
18 to 19 years | 3 | 2 |
20 to 24 years | 7 | 4 |
25 to 34 years | 26 | 15 |
35 to 44 years | 33 | 20 |
45 to 54 years | 27 | 16 |
55 to 64 years | 42 | 25 |
65 years and over | 29 | 17 |
Race or ethnic origin (4) | ||
White, non-Hispanic | 120 | 71 |
Black or African-American, non-Hispanic | 14 | 8 |
Hispanic or Latino | 25 | 15 |
American Indian or Alaska Native, non-Hispanic | -- | -- |
Asian, non-Hispanic | 5 | 3 |
Native Hawaiian or Pacific Islander, non-Hispanic | -- | -- |
Footnotes: | ||
NOTE: Data for all years are revised and final. Totals for major categories may include subcategories not shown separately. Dashes indicate no data reported or data that do not meet publication criteria. CFOI fatal injury counts exclude illness-related deaths unless precipitated by an injury event. | ||
Last Modified Date: Thursday, March 06, 2025