An official website of the United States government
An official website of the United States government
The .gov means it's official.
Federal government websites often end in .gov or .mil. Before sharing sensitive information,
make sure you're on a federal government site.
The site is secure.
The
https:// ensures that you are connecting to the official website and that any
information you provide is encrypted and transmitted securely.
25-322-PHI
Tuesday, March 04, 2025
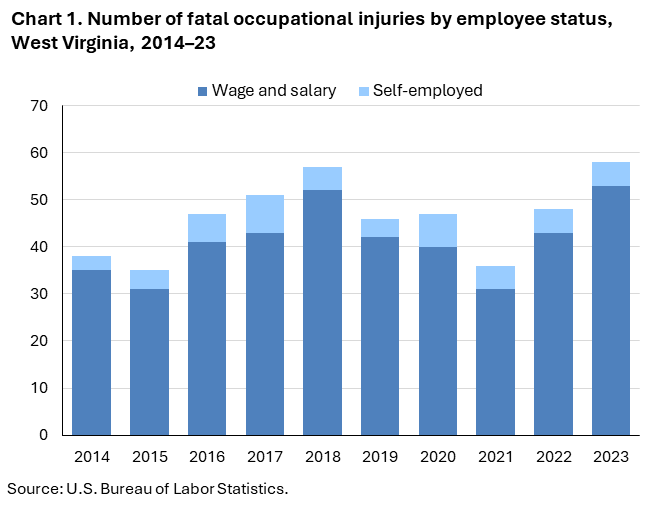
Fatal work injuries totaled 58 in 2023 for West Virginia, the U.S. Bureau of Labor Statistics reported today. Regional Commissioner Alexandra Hall Bovee noted that the number of work-related fatalities in West Virginia was up from the previous year. (See chart 1.) Fatal occupational injuries in the state have ranged from a high of 95 in 2010 to a low of 35 in 2015. Nationwide, a total of 5,283 fatal work injuries were recorded in 2023, a 3.7-percent decrease from 5,486 in 2022, according to the results from the Census of Fatal Occupational Injuries (CFOI).
Fatal event or exposureThe 2022 North American Industry Classification System (NAICS) and the updated Occupational Injury and Illness Classification System (OIICS) were implemented with the release of 2023 data. As a result of these changes, comparisons between 2023 CFOI data and previous years should be made with caution. Refer to the national release technical note for more information.
Background of the program. The Census of Fatal Occupational Injuries (CFOI), part of the Bureau of Labor Statistics (BLS) Occupational Safety and Health Statistics (OSHS) program, is a count of all fatalities resulting from workplace injuries occurring in the U.S. during the calendar year. For technical information and definitions for the CFOI, see the national CFOI release Technical notes, the BLS Handbook of Methods, and the CFOI definitions.
Acknowledgments. BLS thanks the WorkForce West Virginia for their efforts in collecting accurate, comprehensive, and useful data on fatal work injuries. BLS also appreciates the efforts of all federal, state, local, and private sector entities that provided source documents used to identify fatal work injuries nationally. See the national CFOI release Technical Notes for details on cooperating entities.
Information in this release will be made available to individuals with sensory impairments upon request. Voice phone: (202) 691-5200; Telecommunications Relay Service: 7-1-1.
| Event or Exposure (1) | Number | Percent (%) |
|---|---|---|
All events and exposures | 58 | 100 |
Violent acts | -- | -- |
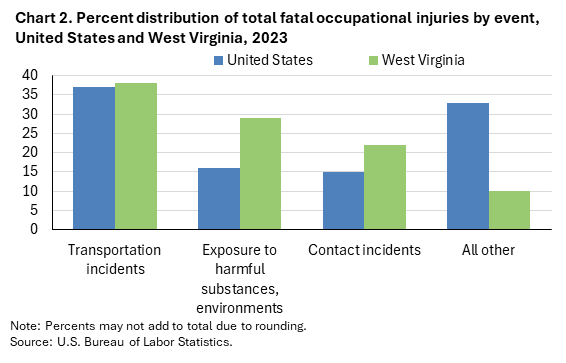
Transportation incidents | 22 | 38 |
Pedestrian incidents involving motorized land vehicles | 3 | 5 |
Roadway incidents involving motorized land vehicle | 16 | 28 |
Roadway collision with other vehicle(s) | 5 | 9 |
Roadway collision with object other than vehicle | 5 | 9 |
Roadway noncollision incident | 6 | 10 |
Roadway noncollision- vehicle overturn | 4 | 7 |
Nonroadway incidents involving motorized land vehicles | 3 | 5 |
Nonroadway collision with object other than vehicle | 2 | 3 |
Collision with stationary object, nonroadway | 2 | 3 |
Nonroadway noncollision incident | 1 | 2 |
Nonroadway noncollision- vehicle overturn | 1 | 2 |
Explosions and fires | -- | -- |
Falls, slips, trips | -- | -- |
Exposure to harmful substances, environments | 17 | 29 |
Exposure to electricity | 3 | 5 |
Exposure to harmful substances | 11 | 19 |
Drug, alcohol overdose | 11 | 19 |
Exposure to oxygen deficiency | 3 | 5 |
Contact incidents | 13 | 22 |
Struck by propelled, falling, or suspended object | 9 | 16 |
Struck by falling object | 6 | 10 |
Struck, caught, or compressed by running powered equipment | 4 | 7 |
Footnotes: | ||
NOTE: Data for all years are revised and final. Totals for major categories may include subcategories not shown separately. Dashes indicate no data reported or data that do not meet publication criteria. CFOI fatal injury counts exclude illness-related deaths unless precipitated by an injury event. | ||
| Industry | Number | Percent (%) |
|---|---|---|
Total | 58 | 100 |
Private industry (1) | 55 | 95 |
Natural resources and mining | 8 | 14 |
Agriculture, forestry, fishing and hunting | 3 | 5 |
Mining, quarrying, and oil and gas extraction | 5 | 9 |
Construction | 10 | 17 |
Construction | 10 | 17 |
Construction of buildings | 1 | 2 |
Residential building construction | 1 | 2 |
Residential building construction | 1 | 2 |
New single-family housing construction (except for-sale builders) | 1 | 2 |
Heavy and civil engineering construction | 3 | 5 |
Utility system construction | 3 | 5 |
Power and communication line and related structures construction | 3 | 5 |
Specialty trade contractors | 5 | 9 |
Other specialty trade contractors | 1 | 2 |
Site preparation contractors | 1 | 2 |
Nonresidential site preparation contractors | 1 | 2 |
Manufacturing | -- | -- |
Trade, transportation, and utilities | -- | -- |
Retail trade | 4 | 7 |
General merchandise retailers | 1 | 2 |
Department stores | 1 | 2 |
Department stores | 1 | 2 |
Transportation and warehousing | 15 | 26 |
Truck transportation | 12 | 21 |
General freight trucking | 8 | 14 |
General freight trucking, long-distance | 5 | 9 |
Specialized freight trucking | 4 | 7 |
Support activities for transportation | 3 | 5 |
Information | -- | -- |
Financial activities | -- | -- |
Professional and business services | -- | -- |
Administrative and support and waste management and remediation services | 7 | 12 |
Administrative and support services | 4 | 7 |
Business support services | 1 | 2 |
Other business support services | 1 | 2 |
Repossession services | 1 | 2 |
Waste management and remediation services | 3 | 5 |
Educational and health services | 3 | 5 |
Health care and social assistance | 3 | 5 |
Leisure and hospitality | -- | -- |
Other services (except public administration) | -- | -- |
Government (2) | 3 | 5 |
Federal government | -- | -- |
State government | 2 | 3 |
Local government | 1 | 2 |
Footnotes: | ||
NOTE: Data for all years are revised and final. Totals for major categories may include subcategories not shown separately. Dashes indicate no data reported or data that do not meet publication criteria. CFOI fatal injury counts exclude illness-related deaths unless precipitated by an injury event. | ||
| Occupation (1) | Number | Percent (%) |
|---|---|---|
All occupations | 58 | 100 |
Management occupations | -- | -- |
Business and financial operations occupations | -- | -- |
Computer and mathematical occupations | -- | -- |
Architecture and engineering occupations | -- | -- |
Life, physical, and social science occupations | -- | -- |
Community and social service occupations | -- | -- |
Legal occupations | 1 | 2 |
Educational instruction and library occupations | -- | -- |
Arts, design, entertainment, sports, and media occupations | -- | -- |
Healthcare practitioners and technical occupations | -- | -- |
Healthcare support occupations | -- | -- |
Protective service occupations | -- | -- |
Food preparation and serving related occupations | -- | -- |
Building and grounds cleaning and maintenance occupations | -- | -- |
Personal care and service occupations | -- | -- |
Sales and related occupations | -- | -- |
Office and administrative support occupations | 1 | 2 |
Financial clerks | 1 | 2 |
Farming, fishing, and forestry occupations | 3 | 5 |
Construction and extraction occupations | 11 | 19 |
Supervisors of construction and extraction workers | 1 | 2 |
First-line supervisors of construction trades and extraction workers | 1 | 2 |
First-line supervisors of construction trades and extraction workers | 1 | 2 |
Construction trades workers | 8 | 14 |
Construction laborers | 4 | 7 |
Construction laborers | 4 | 7 |
Construction equipment operators | 1 | 2 |
Operating engineers and other construction equipment operators | 1 | 2 |
Extraction workers | 2 | 3 |
Underground mining machine operators | 2 | 3 |
Installation, maintenance, and repair occupations | 5 | 9 |
Other installation, maintenance, and repair occupations | 5 | 9 |
Line installers and repairers | 3 | 5 |
Production occupations | 3 | 5 |
Transportation and material moving occupations | 21 | 36 |
Motor vehicle operators | 18 | 31 |
Driver/sales workers and truck drivers | 17 | 29 |
Passenger vehicle drivers | 1 | 2 |
Shuttle drivers and chauffeurs | 1 | 2 |
Footnotes: | ||
NOTE: Data for all years are revised and final. Totals for major categories may include subcategories not shown separately. Dashes indicate no data reported or data that do not meet publication criteria. CFOI fatal injury counts exclude illness-related deaths unless precipitated by an injury event. | ||
| Demographic | Number | Percent (%) |
|---|---|---|
Total | 58 | 100 |
Employee status | ||
Wage and salary workers (1) | 53 | 91 |
Self-employed (2) | 5 | 9 |
Sex | ||
Male | 53 | 91 |
Female | 5 | 9 |
Age (3) | ||
Under 16 years | -- | -- |
16 to 17 years | -- | -- |
18 to 19 years | 4 | 7 |
20 to 24 years | 3 | 5 |
25 to 34 years | 12 | 21 |
35 to 44 years | 12 | 21 |
45 to 54 years | 13 | 22 |
55 to 64 years | 7 | 12 |
65 years and over | 7 | 12 |
Race or ethnic origin (4) | ||
White, non-Hispanic | 53 | 91 |
Black or African-American, non-Hispanic | -- | -- |
Hispanic or Latino | -- | -- |
American Indian or Alaska Native, non-Hispanic | -- | -- |
Asian, non-Hispanic | -- | -- |
Native Hawaiian or Pacific Islander, non-Hispanic | -- | -- |
Footnotes: | ||
NOTE: Data for all years are revised and final. Totals for major categories may include subcategories not shown separately. Dashes indicate no data reported or data that do not meet publication criteria. CFOI fatal injury counts exclude illness-related deaths unless precipitated by an injury event. | ||
Last Modified Date: Tuesday, March 04, 2025