An official website of the United States government
An official website of the United States government
The .gov means it's official.
Federal government websites often end in .gov or .mil. Before sharing sensitive information,
make sure you're on a federal government site.
The site is secure.
The
https:// ensures that you are connecting to the official website and that any
information you provide is encrypted and transmitted securely.
26-561-PHI
Thursday, March 19, 2026
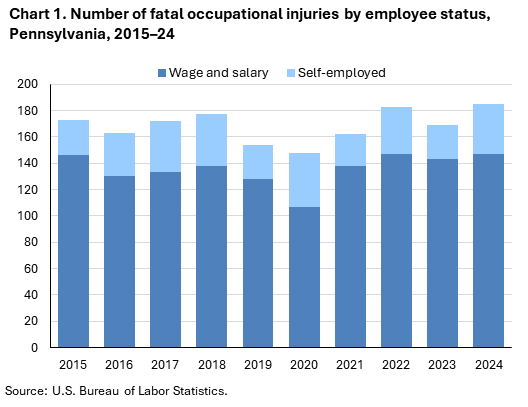
Fatal work injuries totaled 185 in 2024 for Pennsylvania, the U.S. Bureau of Labor Statistics reported today. Regional Commissioner Alexandra Hall Bovee noted that the number of work-related fatalities in Pennsylvania was up 9.5 percent from 169 in 2023. (See chart 1.) The fatal work injury rate was 3.1 fatalities per 100,000 full-time equivalent (FTE) workers in 2024, an increase from a rate of 2.9 in 2023. Nationwide, a total of 5,070 fatal work injuries were recorded in 2024, a 4.0-percent decrease from 5,283 in 2023. These data are from the Census of Fatal Occupational Injuries (CFOI).
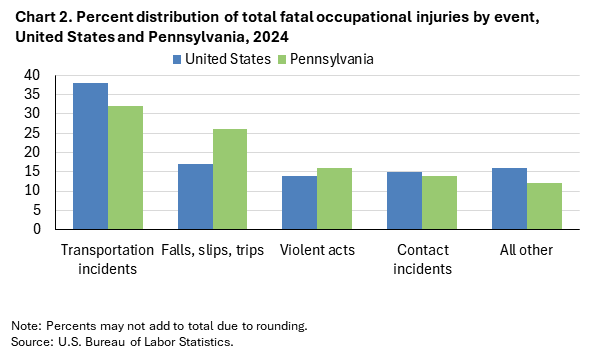
Fatal event or exposureTransportation incidents (59) were the most frequent type of fatal event in Pennsylvania, accounting for 32 percent of all fatal work injuries in the state. Nationally the share was 38 percent. Worker deaths from transportation incidents were up from 50 over the year. (See chart 2 and table 1.)
Fatal falls, slips, and trips (48) accounted for 26 percent of Pennsylvania worker fatalities; nationally the share was 17 percent.
The construction sector had the highest number of fatalities with 48, up from 30 the previous year. (See table 2.)
Fatal falls, slips, and trips were the most frequent type of fatal event in the construction sector, resulting in 24 of the 48 fatalities.
The specialty trade contractors subsector accounted for 21 of the sector’s fatal workplace injuries.
Installation, maintenance, and repair occupations workers experienced the largest increase (13) in fatal work injuries over the year among the major occupational groups. (See table 3.)
The transportation and material moving occupational group had the highest number of fatal workplace injuries with 45. Transportation incidents resulted in 29 fatalities among these workers. Motor vehicle operators accounted for 34 of the major group’s 45 fatal workplace injuries.
Wage and salary workers accounted for 79 percent of fatal workplace injuries in Pennsylvania; the self-employed comprised the remaining 21 percent. (See chart 1 and table 4.) Nationally, wage and salary workers comprised 82 percent of fatalities.
Males accounted for 95 percent of the work-related fatalities in Pennsylvania and 92 percent nationally.
Fatal workplace injuries among female workers decreased from 17 to 10, with transportation incidents accounting for 40 percent of fatal events in 2024.
White non-Hispanics accounted for 78 percent of those who died from a workplace injury. Nationwide, this group accounted for 56 percent of work-related deaths.
Background of the program. The Census of Fatal Occupational Injuries (CFOI), part of the Bureau of Labor Statistics (BLS) Occupational Safety and Health Statistics (OSHS) program, is a count of all fatalities resulting from workplace injuries occurring in the U.S. during the calendar year. For technical information and definitions for the CFOI, see the national CFOI release Technical notes, the BLS Handbook of Methods, and the CFOI definitions.
Acknowledgments. BLS thanks the Pennsylvania Department of Health for their efforts in collecting accurate, comprehensive, and useful data on fatal work injuries. BLS also appreciates the efforts of all federal, state, local, and private sector entities that provided source documents used to identify fatal work injuries nationally. See the national CFOI release Technical Notes for details on cooperating entities.
If you are deaf, hard of hearing, or have a speech disability, please dial 7-1-1 to access telecommunications relay services.
| Event or Exposure (1) | 2023 | 2024 | |
|---|---|---|---|
| Number | Number | Percent (%) | |
|
All events and exposures |
169 | 185 | 100 |
|
Violent acts |
24 | 29 | 16 |
|
Homicides (violent acts by other person) |
11 | 14 | 8 |
|
Shooting by other person |
9 | 12 | 6 |
|
Hitting, kicking, beating by other person |
-- | 2 | 1 |
|
Suicides (intentional self-harm) |
13 | 15 | 8 |
|
Intentional self-harm-- shooting |
8 | 9 | 5 |
|
Intentional self-harm-- hanging, strangulation, asphyxiation |
5 | 4 | 2 |
|
Transportation incidents |
50 | 59 | 32 |
|
Aircraft incidents |
1 | 1 | 1 |
|
Aircraft crash during takeoff or landing |
-- | 1 | 1 |
|
Aircraft crash during takeoff or landing due to mechanical failure |
-- | 1 | 1 |
|
Pedestrian incidents involving motorized land vehicles |
15 | 15 | 8 |
|
Pedestrian struck by vehicle in road work zone |
-- | 4 | 2 |
|
Pedestrian struck by forward-moving vehicle in road work zone |
-- | 4 | 2 |
|
Pedestrian struck by vehicle in roadway |
-- | 6 | 3 |
|
Pedestrian struck by forward-moving vehicle in roadway |
-- | 5 | 3 |
|
Pedestrian struck by vehicle in nonroadway area |
8 | 5 | 3 |
|
Pedestrian struck by forward-moving vehicle in nonroadway area |
4 | 3 | 2 |
|
Pedestrian struck by vehicle backing up in nonroadway area |
-- | 1 | 1 |
|
Roadway incidents involving motorized land vehicle |
28 | 30 | 16 |
|
Roadway collision with other vehicle(s) |
12 | 14 | 8 |
|
Roadway collision with other vehicle(s)-moving in same direction |
1 | 2 | 1 |
|
Roadway collision with other vehicle(s)-moving and standing vehicle |
3 | 6 | 3 |
|
Roadway collision with object other than vehicle |
11 | 16 | 9 |
|
Vehicle struck by falling or flying object(s) in roadway |
-- | 1 | 1 |
|
Collision with object or animal on side of roadway |
11 | 15 | 8 |
|
Nonroadway incidents involving motorized land vehicles |
6 | 13 | 7 |
|
Explosions and fires |
-- | 1 | 1 |
|
Explosions |
-- | 1 | 1 |
|
Intentionally set explosion |
-- | 1 | 1 |
|
Falls, slips, trips |
43 | 48 | 26 |
|
Fall to lower level |
28 | 42 | 23 |
|
Fall to lower level resulting from exposure or contact |
-- | 3 | 2 |
|
Fall to lower level resulting from exposure or contact- 6 to 30 feet |
-- | 3 | 2 |
|
Other fall to lower level |
25 | 35 | 19 |
|
Other fall to lower level- 6 to 30 feet |
10 | 13 | 7 |
|
Other fall to lower level- more than 30 feet |
3 | 5 | 3 |
|
Slip, trip, stumble or fall on same level |
12 | 3 | 2 |
|
Fall on same level |
12 | 3 | 2 |
|
Exposure to harmful substances, environments |
14 | 22 | 12 |
|
Exposure to harmful substances |
12 | 16 | 9 |
|
Drug, alcohol overdose |
-- | 16 | 9 |
|
Contact incidents |
29 | 26 | 14 |
|
Collapse, engulfment |
1 | 2 | 1 |
|
Collapse, engulfment- loose materials or liquids |
1 | 1 | 1 |
|
Collapse, engulfment- building or structure |
-- | 1 | 1 |
|
Struck by propelled, falling, or suspended object |
16 | 15 | 8 |
|
Struck by falling object |
-- | 14 | 8 |
|
Struck by object tipping over |
-- | 1 | 1 |
|
Struck by suspended or swinging object |
-- | 1 | 1 |
|
Struck, caught, or compressed by running powered equipment |
10 | 6 | 3 |
|
Compressed between running equipment and other object(s) |
-- | 1 | 1 |
|
Struck by rolling powered vehicle or machinery |
3 | 2 | 1 |
|
Contact with non-running objects or equipment |
-- | 2 | 1 |
|
Struck by rolling, sliding, or shifting objects-non-running |
-- | 2 | 1 |
|
Footnotes: |
|||
|
Note: The Census of Fatal Occupational Injuries (CFOI) has published data on fatal occupational injuries for the United States since 1992. During this time, the classification systems and definitions of many data elements have changed. See the CFOI Definitions page (www.bls.gov/iif/definitions/census-of-fatal-occupational-injuries-definitions.htm) for a more detailed description of each data element. Data for all years are revised and final. Totals for major categories may include subcategories not shown separately. Dashes indicate no data reported or data that do not meet publication criteria. CFOI fatal injury counts exclude illness-related deaths unless precipitated by an injury event. |
|||
| Industry | 2023 | 2024 | |
|---|---|---|---|
| Number | Number | Percent (%) | |
|
Total |
169 | 185 | 100 |
|
Private industry (1) |
159 | 177 | 96 |
|
Natural resources and mining |
13 | 19 | 10 |
|
Agriculture, forestry, fishing and hunting |
10 | 16 | 9 |
|
Crop production |
5 | 3 | 2 |
|
Other crop farming |
-- | 1 | 1 |
|
All other crop farming |
-- | 1 | 1 |
|
Animal production and aquaculture |
3 | 4 | 2 |
|
Cattle ranching and farming |
3 | 4 | 2 |
|
Forestry and logging |
1 | 7 | 4 |
|
Logging |
1 | 7 | 4 |
|
Logging |
1 | 7 | 4 |
|
Mining, quarrying, and oil and gas extraction |
3 | 3 | 2 |
|
Mining (except oil and gas) |
2 | 3 | 2 |
|
Construction |
30 | 48 | 26 |
|
Construction |
30 | 48 | 26 |
|
Construction of buildings |
8 | 19 | 10 |
|
Residential building construction |
5 | 12 | 6 |
|
Residential building construction |
5 | 12 | 6 |
|
New single-family housing construction (except for-sale builders) |
-- | 2 | 1 |
|
Residential remodelers |
3 | 4 | 2 |
|
Nonresidential building construction |
3 | 7 | 4 |
|
Commercial and institutional building construction |
1 | 5 | 3 |
|
Heavy and civil engineering construction |
4 | 8 | 4 |
|
Utility system construction |
-- | 4 | 2 |
|
Highway, street, and bridge construction |
-- | 4 | 2 |
|
Highway, street, and bridge construction |
-- | 4 | 2 |
|
Specialty trade contractors |
17 | 21 | 11 |
|
Foundation, structure, and building exterior contractors |
8 | 8 | 4 |
|
Framing contractors |
-- | 1 | 1 |
|
Masonry contractors |
-- | 3 | 2 |
|
Residential masonry contractors |
-- | 1 | 1 |
|
Roofing contractors |
5 | 4 | 2 |
|
Building equipment contractors |
5 | 5 | 3 |
|
Building finishing contractors |
-- | 4 | 2 |
|
Drywall and insulation contractors |
-- | 1 | 1 |
|
Other specialty trade contractors |
-- | 4 | 2 |
|
Manufacturing |
29 | 21 | 11 |
|
Manufacturing |
29 | 21 | 11 |
|
Food manufacturing |
9 | 3 | 2 |
|
Wood product manufacturing |
3 | 3 | 2 |
|
Paper manufacturing |
-- | 1 | 1 |
|
Converted paper product manufacturing |
-- | 1 | 1 |
|
Other converted paper product manufacturing |
-- | 1 | 1 |
|
Sanitary paper product manufacturing |
-- | 1 | 1 |
|
Petroleum and coal products manufacturing |
-- | 1 | 1 |
|
Petroleum and coal products manufacturing |
-- | 1 | 1 |
|
Asphalt paving, roofing, and saturated materials manufacturing |
-- | 1 | 1 |
|
Chemical manufacturing |
-- | 3 | 2 |
|
Fabricated metal product manufacturing |
3 | 5 | 3 |
|
Forging and stamping |
-- | 1 | 1 |
|
Forging and stamping |
-- | 1 | 1 |
|
Other fabricated metal product manufacturing |
-- | 1 | 1 |
|
Miscellaneous manufacturing |
3 | 1 | 1 |
|
Medical equipment and supplies manufacturing |
-- | 1 | 1 |
|
Medical equipment and supplies manufacturing |
-- | 1 | 1 |
|
Trade, transportation, and utilities |
49 | 40 | 22 |
|
Wholesale trade |
7 | 4 | 2 |
|
Retail trade |
14 | 8 | 4 |
|
Motor vehicle and parts dealers |
3 | 4 | 2 |
|
Transportation and warehousing |
28 | 28 | 15 |
|
Truck transportation |
22 | 19 | 10 |
|
General freight trucking |
18 | 15 | 8 |
|
General freight trucking, local |
4 | 4 | 2 |
|
General freight trucking, long-distance |
14 | 10 | 5 |
|
General freight trucking, long-distance, truckload |
9 | 5 | 3 |
|
General freight trucking, long-distance, less than truckload |
1 | 1 | 1 |
|
Specialized freight trucking |
4 | 4 | 2 |
|
Specialized freight (except used goods) trucking, local |
-- | 3 | 2 |
|
Specialized freight (except used goods) trucking, long-distance |
2 | 1 | 1 |
|
Support activities for transportation |
-- | 3 | 2 |
|
Support activities for air transportation |
-- | 1 | 1 |
|
Couriers and messengers |
-- | 3 | 2 |
|
Information |
-- | -- | -- |
|
Financial activities |
-- | -- | -- |
|
Professional and business services |
13 | 23 | 12 |
|
Administrative and support and waste management and remediation services |
13 | 23 | 12 |
|
Administrative and support services |
9 | 18 | 10 |
|
Waste management and remediation services |
4 | 5 | 3 |
|
Educational and health services |
6 | 9 | 5 |
|
Educational services |
2 | 3 | 2 |
|
Educational services |
2 | 3 | 2 |
|
Elementary and secondary schools |
2 | 3 | 2 |
|
Elementary and secondary schools |
2 | 3 | 2 |
|
Health care and social assistance |
4 | 6 | 3 |
|
Nursing and residential care facilities |
-- | 1 | 1 |
|
Other residential care facilities |
-- | 1 | 1 |
|
Other residential care facilities |
-- | 1 | 1 |
|
Leisure and hospitality |
11 | -- | -- |
|
Accommodation and food services |
5 | 6 | 3 |
|
Accommodation |
1 | 1 | 1 |
|
Traveler accommodation |
1 | 1 | 1 |
|
Hotels (except casino hotels) and motels |
-- | 1 | 1 |
|
Food services and drinking places |
4 | 5 | 3 |
|
Restaurants and other eating places |
4 | 5 | 3 |
|
Restaurants and other eating places |
4 | 5 | 3 |
|
Other services (except public administration) |
8 | 7 | 4 |
|
Other services (except public administration) |
8 | 7 | 4 |
|
Repair and maintenance |
4 | 3 | 2 |
|
Automotive repair and maintenance |
-- | 3 | 2 |
|
Automotive mechanical and electrical repair and maintenance |
-- | 3 | 2 |
|
General automotive repair |
-- | 3 | 2 |
|
Government (2) |
10 | 8 | 4 |
|
Federal government |
-- | -- | -- |
|
State government |
3 | 3 | 2 |
|
Local government |
7 | 5 | 3 |
|
Footnotes: |
|||
|
Note: The Census of Fatal Occupational Injuries (CFOI) has published data on fatal occupational injuries for the United States since 1992. During this time, the classification systems and definitions of many data elements have changed. See the CFOI Definitions page (www.bls.gov/iif/definitions/census-of-fatal-occupational-injuries-definitions.htm) for a more detailed description of each data element. Data for all years are revised and final. Totals for major categories may include subcategories not shown separately. Dashes indicate no data reported or data that do not meet publication criteria. CFOI fatal injury counts exclude illness-related deaths unless precipitated by an injury event. |
|||
| Occupation (1) | 2023 | 2024 | |
|---|---|---|---|
| Number | Number | Percent (%) | |
|
All occupations |
169 | 185 | 100 |
|
Management occupations |
11 | 4 | 2 |
|
Community and social service occupations |
-- | 2 | 1 |
|
Counselors, social workers, and other community and social service specialists |
-- | 2 | 1 |
|
Social workers |
-- | 2 | 1 |
|
Child, family, and school social workers |
-- | 2 | 1 |
|
Protective service occupations |
12 | 12 | 6 |
|
Other protective service workers |
5 | 4 | 2 |
|
Security guards and gambling surveillance officers |
-- | 3 | 2 |
|
Security guards |
-- | 3 | 2 |
|
Miscellaneous protective service workers |
-- | 1 | 1 |
|
Crossing guards and flaggers |
-- | 1 | 1 |
|
Food preparation and serving related occupations |
4 | 6 | 3 |
|
Building and grounds cleaning and maintenance occupations |
7 | 19 | 10 |
|
Supervisors of building and grounds cleaning and maintenance workers |
-- | 5 | 3 |
|
First-line supervisors of building and grounds cleaning and maintenance workers |
-- | 5 | 3 |
|
Building cleaning and pest control workers |
-- | 2 | 1 |
|
Building cleaning workers |
-- | 2 | 1 |
|
Janitors and cleaners, except maids and housekeeping cleaners |
-- | 1 | 1 |
|
Maids and housekeeping cleaners |
-- | 1 | 1 |
|
Grounds maintenance workers |
-- | 12 | 6 |
|
Grounds maintenance workers |
-- | 12 | 6 |
|
Landscaping and groundskeeping workers |
-- | 7 | 4 |
|
Tree trimmers and pruners |
-- | 5 | 3 |
|
Office and administrative support occupations |
6 | 1 | 1 |
|
Secretaries and administrative assistants |
-- | 1 | 1 |
|
Secretaries and administrative assistants |
-- | 1 | 1 |
|
Farming, fishing, and forestry occupations |
4 | 11 | 6 |
|
Supervisors of farming, fishing, and forestry workers |
-- | 4 | 2 |
|
First-line supervisors of farming, fishing, and forestry workers |
-- | 4 | 2 |
|
First-line supervisors of farming, fishing, and forestry workers |
-- | 4 | 2 |
|
Agricultural workers |
-- | 1 | 1 |
|
Miscellaneous agricultural workers |
-- | 1 | 1 |
|
Farmworkers and laborers, crop, nursery, and greenhouse |
-- | 1 | 1 |
|
Forest, conservation, and logging workers |
1 | 6 | 3 |
|
Logging workers |
1 | 6 | 3 |
|
Fallers |
1 | 6 | 3 |
|
Construction and extraction occupations |
32 | 42 | 23 |
|
Supervisors of construction and extraction workers |
6 | 8 | 4 |
|
First-line supervisors of construction trades and extraction workers |
6 | 8 | 4 |
|
First-line supervisors of construction trades and extraction workers |
6 | 8 | 4 |
|
Construction trades workers |
22 | 31 | 17 |
|
Construction laborers |
9 | 14 | 8 |
|
Construction laborers |
9 | 14 | 8 |
|
Construction equipment operators |
-- | 6 | 3 |
|
Operating engineers and other construction equipment operators |
-- | 6 | 3 |
|
Insulation workers |
-- | 1 | 1 |
|
Roofers |
4 | 4 | 2 |
|
Roofers |
4 | 4 | 2 |
|
Extraction workers |
2 | 1 | 1 |
|
Underground mining machine operators |
-- | 1 | 1 |
|
Installation, maintenance, and repair occupations |
12 | 25 | 14 |
|
Vehicle and mobile equipment mechanics, installers, and repairers |
4 | 4 | 2 |
|
Other installation, maintenance, and repair occupations |
4 | 18 | 10 |
|
Heating, air conditioning, and refrigeration mechanics and installers |
-- | 3 | 2 |
|
Heating, air conditioning, and refrigeration mechanics and installers |
-- | 3 | 2 |
|
Industrial machinery installation, repair, and maintenance workers |
-- | 4 | 2 |
|
Industrial machinery mechanics |
-- | 1 | 1 |
|
Maintenance workers, machinery |
-- | 3 | 2 |
|
Maintenance and repair workers, general |
2 | 7 | 4 |
|
Maintenance and repair workers, general |
2 | 7 | 4 |
|
Production occupations |
17 | 12 | 6 |
|
Metal workers and plastic workers |
3 | 3 | 2 |
|
Welding, soldering, and brazing workers |
-- | 1 | 1 |
|
Textile, apparel, and furnishings workers |
-- | 2 | 1 |
|
Laundry and dry-cleaning workers |
-- | 2 | 1 |
|
Laundry and dry-cleaning workers |
-- | 2 | 1 |
|
Transportation and material moving occupations |
46 | 45 | 24 |
|
Supervisors of transportation and material moving workers |
-- | 4 | 2 |
|
First-line supervisors of transportation and material moving workers |
-- | 4 | 2 |
|
Motor vehicle operators |
32 | 34 | 18 |
|
Driver/sales workers and truck drivers |
-- | 33 | 18 |
|
Heavy and tractor-trailer truck drivers |
-- | 29 | 16 |
|
Passenger vehicle drivers |
-- | 1 | 1 |
|
Material moving workers |
11 | 7 | 4 |
|
Laborers and material movers |
6 | 4 | 2 |
|
Laborers and freight, stock, and material movers, hand |
5 | 4 | 2 |
|
Refuse and recyclable material collectors |
-- | 1 | 1 |
|
Refuse and recyclable material collectors |
-- | 1 | 1 |
|
Footnotes: |
|||
|
Note: The Census of Fatal Occupational Injuries (CFOI) has published data on fatal occupational injuries for the United States since 1992. During this time, the classification systems and definitions of many data elements have changed. See the CFOI Definitions page (www.bls.gov/iif/definitions/census-of-fatal-occupational-injuries-definitions.htm) for a more detailed description of each data element. Data for all years are revised and final. Totals for major categories may include subcategories not shown separately. Dashes indicate no data reported or data that do not meet publication criteria. CFOI fatal injury counts exclude illness-related deaths unless precipitated by an injury event. |
|||
| Demographic | 2023 | 2024 | |
|---|---|---|---|
| Number | Number | Percent (%) | |
|
Total |
169 | 185 | 100 |
|
Employee status |
|||
|
Wage and salary workers (1) |
143 | 147 | 79 |
|
Self-employed (2) |
26 | 38 | 21 |
|
Sex |
|||
|
Male |
150 | 175 | 95 |
|
Female |
17 | 10 | 5 |
|
Age (3) |
|||
|
Under 16 years |
-- | -- | -- |
|
16 to 17 years |
-- | -- | -- |
|
18 to 19 years |
3 | -- | -- |
|
20 to 24 years |
7 | 6 | 3 |
|
25 to 34 years |
26 | 35 | 19 |
|
35 to 44 years |
33 | 33 | 18 |
|
45 to 54 years |
27 | 30 | 16 |
|
55 to 64 years |
42 | 39 | 21 |
|
65 years and over |
29 | 38 | 21 |
|
Race or ethnic origin (4) |
|||
|
White, non-Hispanic |
120 | 145 | 78 |
|
Black or African-American, non-Hispanic |
14 | 14 | 8 |
|
Hispanic or Latino |
25 | 18 | 10 |
|
American Indian or Alaska Native, non-Hispanic |
-- | -- | -- |
|
Asian, non-Hispanic |
5 | 4 | 2 |
|
Native Hawaiian or Pacific Islander, non-Hispanic |
-- | -- | -- |
|
Person of multiple races, non-Hispanic |
-- | -- | -- |
|
Other or not reported, non-Hispanic |
-- | -- | -- |
|
Footnotes: |
|||
|
Note: The Census of Fatal Occupational Injuries (CFOI) has published data on fatal occupational injuries for the United States since 1992. During this time, the classification systems and definitions of many data elements have changed. See the CFOI Definitions page (www.bls.gov/iif/definitions/census-of-fatal-occupational-injuries-definitions.htm) for a more detailed description of each data element. Data for all years are revised and final. Totals for major categories may include subcategories not shown separately. Dashes indicate no data reported or data that do not meet publication criteria. CFOI fatal injury counts exclude illness-related deaths unless precipitated by an injury event. |
|||
Last Modified Date: Thursday, March 19, 2026