An official website of the United States government
An official website of the United States government
The .gov means it's official.
Federal government websites often end in .gov or .mil. Before sharing sensitive information,
make sure you're on a federal government site.
The site is secure.
The
https:// ensures that you are connecting to the official website and that any
information you provide is encrypted and transmitted securely.
21-1771-CHI
Tuesday, November 23, 2021
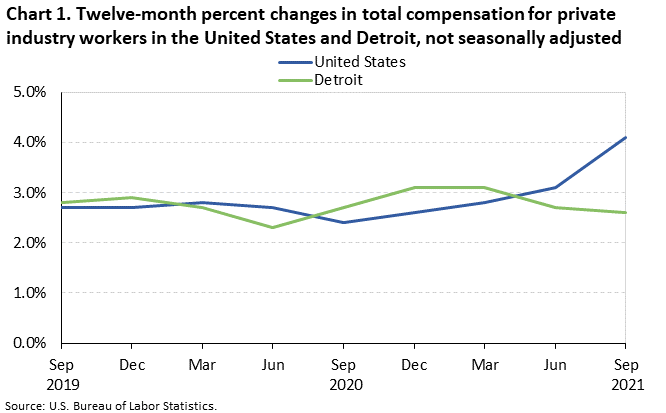
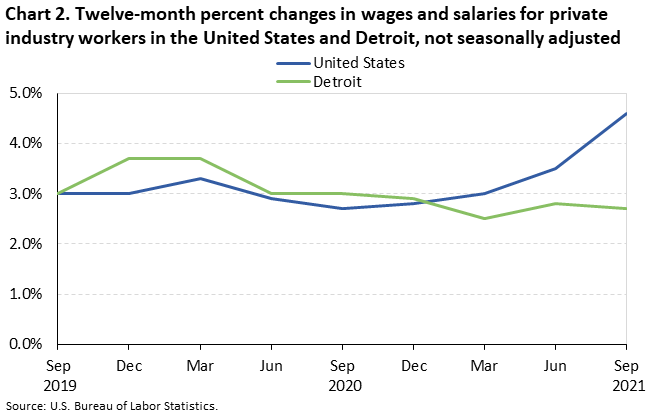
Compensation costs for private industry workers increased 2.6 percent in the Detroit-Warren-Ann Arbor, MI Combined Statistical Area (CSA) for the year ended September 2021, the U.S. Bureau of Labor Statistics reported today. Regional Commissioner Jason Palmer noted that one year ago, Detroit experienced an annual gain of 2.7 percent in compensation costs. (See chart 1 and table 1.) Locally, wages and salaries, the largest component of compensation costs, advanced at a 2.7-percent pace for the 12-month period ended September 2021. (See chart 2.) Nationwide, compensation costs rose 4.1 percent and wages and salaries rose 4.6 percent over the same period.
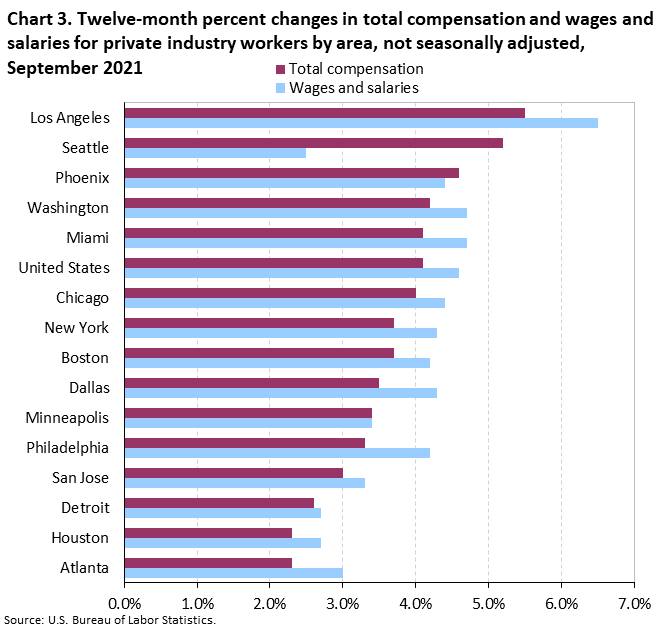
Detroit is 1 of 15 metropolitan areas in the United States and 1 of 3 areas in the Midwest region of the country for which locality compensation cost data are available. Among these 15 largest areas, over-the-year percentage changes in compensation costs ranged from 5.5 percent in Los Angeles-Long Beach to 2.3 percent in both Atlanta-Athens-Clarke County-Sandy Springs and Houston-The Woodlands in September 2021; for wages and salaries, Los Angeles registered the largest increase (6.5 percent) and Seattle-Tacoma registered the smallest (2.5 percent). (See chart 3.)
The annual increase in compensation costs in Detroit was 2.6 percent in September 2021, compared to advances that ranged from 4.0 percent in Chicago-Naperville to 3.4 percent in Minneapolis-St. Paul, the two other metropolitan areas in the Midwest. Detroit’s 2.7-percent gain in wages and salaries over this 12-month period compared to rates ranging from 4.4 percent in Chicago to 3.4 percent in Minneapolis. (See table 2.)
Locality compensation costs are part of the national Employment Cost Index (ECI), which measures quarterly changes in compensation costs, which include wages, salaries, and employer costs for employee benefits. In addition to the 15 locality estimates provided in this release, ECI data for the nation, 4 geographical regions, and 9 geographical divisions are available. (Geographical definitions for the metropolitan areas mentioned in this release are included in the Technical Note.)
In addition to the data presented here, national data by industry, occupational group, and union status, as well as data for civilian, private, and state and local government employees, are available at www.bls.gov/ncs/ect/home.htm. The national news release summary is available at www.bls.gov/news.release/eci.toc.htm. Additional information for regions, states, and local areas may be accessed via our regional homepage at www.bls.gov/regions/midwest/.
The Employment Cost Index for December 2021 is scheduled to be released on Friday, January 28, 2022, at 8:30 a.m. (ET).
Response rates for September were comparable with prior releases, and no changes in estimation procedures were necessary. Additional information is available at www.bls.gov/bls/effects-of-covid-19-on-workplace-injuries-and-illnesses-compensation-and-occupational-requirements.htm#ECI.
The Employment Cost Index (ECI) measures the change in the cost of labor, free from the influence of employment shifts among occupations and industries. For information on survey concepts, coverage, methods, nonresponse adjustment, and imputation see National Compensation Measures Handbook of Methods at www.bls.gov/opub/hom/ncs/home.htm.
Wages and salaries are defined as straight-time average hourly earnings or, for workers not paid on an hourly basis, straight-time earnings divided by the corresponding hours. Straight-time wage and salary rates are total earnings before payroll deductions, excluding premium pay for overtime, work on weekends and holidays, and shift differentials. Production bonuses, incentive earnings, commission payments, and cost-of-living adjustments are included in straight-time earnings, whereas nonproduction bonuses or those not directly tied to production (such as end-of-year and profit-sharing bonuses) are excluded. Also excluded are such items as payments-in-kind, free room and board, and tips.
The metropolitan area definitions of the 15 published localities are listed below.
Atlanta-Athens-Clarke County-Sandy Springs, GA Combined Statistical Area (CSA) includes Barrow, Bartow, Butts, Carroll, Cherokee, Clarke, Clayton, Cobb, Coweta, Dawson, DeKalb, Douglas, Fayette, Forsyth, Fulton, Gordon, Gwinnett, Hall, Haralson, Heard, Henry, Jackson, Jasper, Lamar, Madison, Meriwether, Morgan, Newton, Oconee, Oglethorpe, Paulding, Pickens, Pike, Polk, Rockdale, Spalding, Troup, Upson, and Walton Counties in Georgia.
Boston-Worcester-Providence, MA-RI-NH-CT CSA includes Barnstable, Bristol, Essex, Middlesex, Norfolk, Plymouth, Suffolk, and Worcester Counties in Massachusetts; Bristol, Kent, Newport, Providence, and Washington in Rhode Island; Belknap, Hillsborough, Merrimack, Rockingham, and Strafford Counties in New Hampshire; and Windham County in Connecticut.
Chicago-Naperville, IL-IN-WI CSA includes Bureau, Cook, DeKalb, DuPage, Grundy, Kane, Kankakee, Kendall, Lake, La Salle, McHenry, Putnam, and Will Counties in Illinois; Jasper, Lake, LaPorte, Newton, and Porter Counties in Indiana; and Kenosha County in Wisconsin.
Dallas-Fort Worth, TX-OK CSA includes Collin, Cooke, Dallas, Denton, Ellis, Grayson, Henderson, Hood, Hopkins, Hunt, Johnson, Kaufman, Navarro, Palo Pinto, Parker, Rockwall, Somervell, Tarrant, and Wise Counties in Texas and Bryan County in Oklahoma.
Detroit-Warren-Ann Arbor, MI CSA includes Genesee, Lapeer, Lenawee, Livingston, Macomb, Monroe, Oakland, St. Clair, Washtenaw, and Wayne Counties in Michigan.
Houston-The Woodlands, TX CSA includes Austin, Brazoria, Chambers, Fort Bend, Galveston, Harris, Liberty, Matagorda, Montgomery, Trinity, Walker, Waller, Washington, and Wharton Counties in Texas.
Los Angeles-Long Beach, CA CSA includes Los Angeles, Orange, Riverside, San Bernardino, and Ventura Counties in California.
Miami-Fort Lauderdale-Port St. Lucie, FL CSA includes Broward, Indian River, Martin, Miami-Dade, Okeechobee, Palm Beach and St. Lucie Counties in Florida.
Minneapolis-St. Paul, MN-WI CSA includes Anoka, Benton, Carver, Chisago, Dakota, Goodhue, Hennepin, Isanti, Le Sueur, McLeod, Mille Lacs, Ramsey, Rice, Scott, Sherburne, Sibley, Stearns, Washington, and Wright Counties in Minnesota; and Pierce and St. Croix Counties in Wisconsin.
New York-Newark, NY-NJ-CT-PA CSA includes Bronx, Dutchess, Kings, Nassau, New York, Orange, Putnam, Queens, Richmond, Rockland, Suffolk, Ulster, and Westchester Counties in New York; Bergen, Essex, Hudson, Hunterdon, Mercer, Middlesex, Monmouth, Morris, Ocean, Passaic, Somerset, Sussex, Union, and Warren Counties in New Jersey; Fairfield, Litchfield, and New Haven Counties in Connecticut; and Carbon, Lehigh, Monroe, Northampton, and Pike Counties in Pennsylvania.
Philadelphia-Reading-Camden, PA-NJ-DE-MD CSA includes Berks, Bucks, Chester, Delaware, Montgomery, and Philadelphia Counties in Pennsylvania; Atlantic, Burlington, Camden, Cape May, Cumberland, Gloucester, and Salem Counties in New Jersey; Kent and New Castle Counties in Delaware; and Cecil County in Maryland.
Phoenix-Mesa-Scottsdale, AZ Metropolitan Statistical Area (MSA) includes Maricopa and Pinal Counties in Arizona.
San Jose-San Francisco-Oakland, CA CSA includes Alameda, Contra Costa, Marin, Napa, San Benito, San Francisco, San Joaquin, San Mateo, Santa Clara, Santa Cruz, Solano, and Sonoma Counties in California.
Seattle-Tacoma, WA CSA includes Island, King, Kitsap, Lewis, Mason, Pierce, Skagit, Snohomish, and Thurston Counties in Washington.
Washington-Baltimore-Arlington, DC-MD-VA-WV-PA CSA includes the District of Columbia; Baltimore city and Anne Arundel, Baltimore, Calvert, Carroll, Charles, Dorchester, Frederick, Harford, Howard, Montgomery, Prince George's, Queen Anne's, St. Mary's, Talbot, and Washington Counties in Maryland; Alexandria, Fairfax, Falls Church, Fredericksburg, Manassas, Manassas Park, and Winchester cities and Arlington, Clarke, Culpeper, Fairfax, Fauquier, Frederick, Loudoun, Prince William, Rappahannock, Spotsylvania, Stafford, and Warren Counties in Virginia; Berkeley, Hampshire, and Jefferson Counties in West Virginia; and Franklin County in Pennsylvania.
Definitions of the four Census regions of the country are noted below.
Northeast: Connecticut, Maine, Massachusetts, New Hampshire, New Jersey, New York, Pennsylvania, Rhode Island, and Vermont.
South: Alabama, Arkansas, Delaware, the District of Columbia, Florida, Georgia, Kentucky, Louisiana, Maryland, Mississippi, North Carolina, Oklahoma, South Carolina, Tennessee, Texas, Virginia, and West Virginia.
Midwest: Illinois, Indiana, Iowa, Kansas, Michigan, Minnesota, Missouri, Nebraska, North Dakota, Ohio, South Dakota, and Wisconsin.
West: Alaska, Arizona, California, Colorado, Hawaii, Idaho, Montana, Nevada, New Mexico, Oregon, Utah, Washington, and Wyoming.
Information in this release will be made available to individuals with sensory impairments upon request. Voice phone: (202) 691-5200; Federal Relay Service: (800) 877-8339.
| Area | Total compensation | Wages and salaries | ||||||
|---|---|---|---|---|---|---|---|---|
| 12-month percent changes for period ended- | 12-month percent changes for period ended- | |||||||
| Mar. | Jun. | Sep. | Dec. | Mar. | Jun. | Sep. | Dec. | |
United States | ||||||||
2017 | 2.3 | 2.4 | 2.5 | 2.6 | 2.6 | 2.4 | 2.6 | 2.8 |
2018 | 2.8 | 2.9 | 2.9 | 3.0 | 2.9 | 2.9 | 3.1 | 3.1 |
2019 | 2.8 | 2.6 | 2.7 | 2.7 | 3.0 | 3.0 | 3.0 | 3.0 |
2020 | 2.8 | 2.7 | 2.4 | 2.6 | 3.3 | 2.9 | 2.7 | 2.8 |
2021 | 2.8 | 3.1 | 4.1 | 3.0 | 3.5 | 4.6 | ||
Midwest | ||||||||
2017 | 2.8 | 2.3 | 2.2 | 2.2 | 3.2 | 2.4 | 2.2 | 2.2 |
2018 | 2.4 | 2.5 | 2.8 | 3.0 | 2.4 | 2.5 | 3.1 | 3.3 |
2019 | 2.9 | 2.7 | 2.6 | 2.6 | 3.2 | 3.0 | 2.7 | 2.8 |
2020 | 3.0 | 2.6 | 2.4 | 2.5 | 3.5 | 2.9 | 2.7 | 2.6 |
2021 | 2.3 | 3.1 | 3.8 | 2.2 | 3.3 | 4.1 | ||
Detroit-Warren-Ann Arbor | ||||||||
2017 | 2.9 | 2.1 | 2.5 | 2.8 | 3.5 | 2.2 | 2.8 | 3.2 |
2018 | 2.6 | 3.0 | 2.8 | 2.6 | 2.8 | 3.4 | 3.2 | 2.7 |
2019 | 1.9 | 2.7 | 2.8 | 2.9 | 1.8 | 2.8 | 3.0 | 3.7 |
2020 | 2.7 | 2.3 | 2.7 | 3.1 | 3.7 | 3.0 | 3.0 | 2.9 |
2021 | 3.1 | 2.7 | 2.6 | 2.5 | 2.8 | 2.7 | ||
| Area | Total compensation | Wages and salaries | ||||
|---|---|---|---|---|---|---|
| 12-month percent changes for period ended- | 12-month percent changes for period ended- | |||||
| Sep. 2020 | Jun. 2021 | Sep. 2021 | Sep. 2020 | Jun. 2021 | Sep. 2021 | |
United States | 2.4 | 3.1 | 4.1 | 2.7 | 3.5 | 4.6 |
Northeast | 2.2 | 2.7 | 3.7 | 2.4 | 3.2 | 4.5 |
Boston-Worcester-Providence | 3.4 | 3.1 | 3.7 | 3.7 | 3.6 | 4.2 |
New York-Newark | 1.9 | 2.3 | 3.7 | 1.9 | 2.3 | 4.3 |
Philadelphia-Reading-Camden | 2.5 | 2.8 | 3.3 | 2.8 | 3.8 | 4.2 |
South | 2.3 | 3.1 | 4.5 | 2.5 | 3.6 | 5.2 |
Atlanta-Athens-Clarke County-Sandy Springs | 2.5 | 2.4 | 2.3 | 2.6 | 3.4 | 3.0 |
Dallas-Fort Worth | 3.1 | 3.1 | 3.5 | 2.4 | 3.0 | 4.3 |
Houston-The Woodlands | 2.2 | 1.7 | 2.3 | 2.2 | 2.1 | 2.7 |
Miami-Fort Lauderdale-Port St. Lucie | 1.5 | 2.4 | 4.1 | 1.6 | 2.9 | 4.7 |
Washington-Baltimore-Arlington | 3.6 | 3.7 | 4.2 | 3.9 | 4.3 | 4.7 |
Midwest | 2.4 | 3.1 | 3.8 | 2.7 | 3.3 | 4.1 |
Chicago-Naperville | 2.4 | 2.7 | 4.0 | 2.8 | 3.0 | 4.4 |
Detroit-Warren-Ann Arbor | 2.7 | 2.7 | 2.6 | 3.0 | 2.8 | 2.7 |
Minneapolis-St. Paul | 1.6 | 2.4 | 3.4 | 2.1 | 2.4 | 3.4 |
West | 2.8 | 3.6 | 3.9 | 3.1 | 4.1 | 4.3 |
Los Angeles-Long Beach | 2.7 | 4.5 | 5.5 | 3.1 | 5.4 | 6.5 |
Phoenix-Mesa-Scottsdale | 3.3 | 3.7 | 4.6 | 3.8 | 3.5 | 4.4 |
San Jose-San Francisco-Oakland | 3.5 | 3.1 | 3.0 | 4.0 | 3.4 | 3.3 |
Seattle-Tacoma | 2.6 | 2.1 | 5.2 | 3.6 | 2.4 | 2.5 |
Last Modified Date: Tuesday, November 23, 2021