An official website of the United States government
An official website of the United States government
The .gov means it's official.
Federal government websites often end in .gov or .mil. Before sharing sensitive information,
make sure you're on a federal government site.
The site is secure.
The
https:// ensures that you are connecting to the official website and that any
information you provide is encrypted and transmitted securely.
21-205-CHI
Wednesday, March 17, 2021
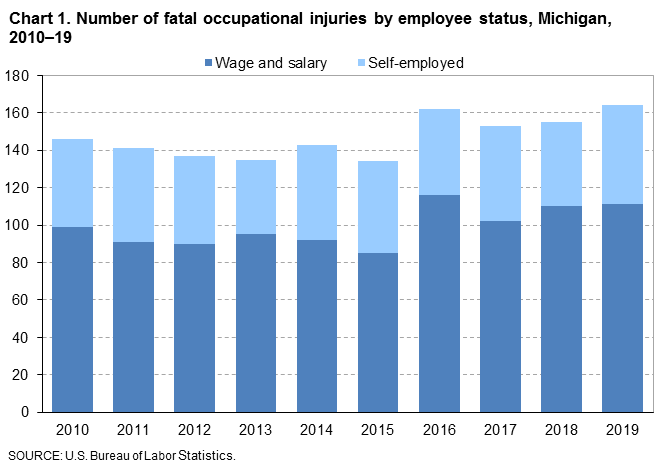
Fatal work injuries totaled 164 in 2019 for Michigan, the U.S. Bureau of Labor Statistics reported today. Regional Commissioner Jason Palmer noted that the number of work-related fatalities in Michigan was up from the previous year. (See chart 1.) Fatal occupational injuries in the state have ranged from a high of 182 in 1999 to a low of 94 in 2009.
Nationwide, a total of 5,333 fatal work injuries were recorded in 2019, a 2-percent increase from the 5,250 in 2018, according to the results from the Census of Fatal Occupational Injuries (CFOI) program. The 5,333 fatal occupational injuries in 2019 represents the largest annual number since 2007.
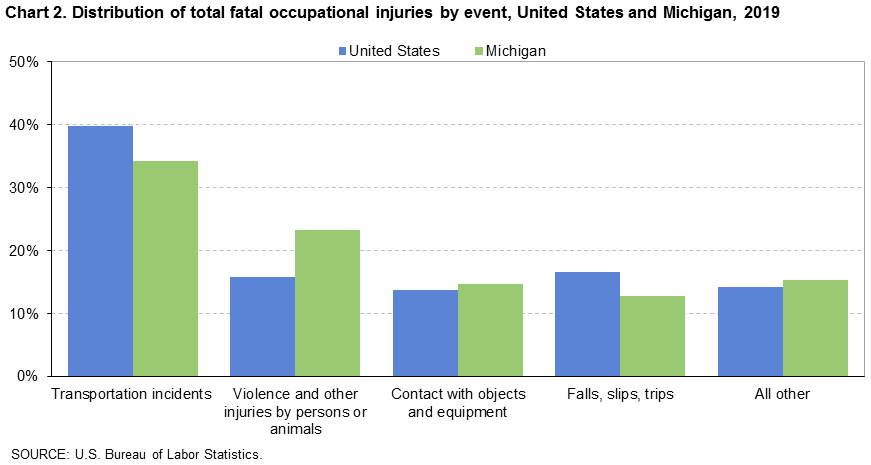
Fatal event or exposureIn Michigan, transportation incidents resulted in 56 fatal work injuries, and violence and other injuries by persons or animals accounted for 38 fatalities. These two major categories accounted for 57 percent of all workplace fatalities in the state. (See table 1.) Worker deaths from transportation incidents were up from 50 over the year, and worker fatalities due to violence or other injuries by persons or animals were similar to the 37 reported in 2018.
Contact with objects or equipment was the third-most frequent fatal work event with 24 fatalities, down from 27 in the prior year. Falls, slips, and trips resulted in 21 work-related deaths compared to 20 in 2018.
Nationally, transportation incidents were the most frequent fatal workplace event in 2019, accounting for 40 percent of fatal work injuries. (See chart 2.) Falls, slips, and trips was the second-most common fatal event (17 percent), followed by violence and other injuries by persons or animals (16 percent).
The private agriculture, forestry, fishing, and hunting industry had the highest number of fatalities in Michigan with 33. (See table 2.) Violence and other injuries by persons or animals resulted in 7 of the 33 fatalities in the industry. The crop production sector accounted for 18 of the 33 workplace fatalities in the agriculture, forestry, fishing, and hunting industry.
The private construction industry had 31 workplace fatalities. The transportation and warehousing industry had 18 workplace fatalities, followed by the retail trade industry with 17.
OccupationThe construction and extraction occupational group had the highest number of workplace fatalities with 32. (See table 3.) Construction trades workers accounted for 23 of the 32 fatalities among construction and extraction workers. The transportation and material moving occupational group had the second-highest number of workplace fatalities with 31, followed by management occupations with 26. Heavy and tractor-trailer truck drivers suffered 16 of the work-related deaths within the transportation and material moving group. Farmers, ranchers, and other agricultural managers accounted for 22 of the 26 management occupational fatalities.
Additional highlightsMen accounted for 92 percent of the work-related fatalities in Michigan, similar to the national share. (See table 4.) Violence and other injuries by persons or animals made up 21 percent of the fatalities for men in Michigan.
White non-Hispanics accounted for 81 percent of those who died from a workplace injury. Nationwide, this group accounted for 62 percent of work-related deaths.
Workers 25-54 years old accounted for 53 percent of the state’s work-related fatalities in 2019, compared to 55 percent of on-the-job fatalities nationally.
Of the 164 fatal work injuries in Michigan, 68 percent worked for wages and salaries; the remainder were self-employed. The most frequent fatal event for wage and salary workers was transportation incidents; contact with objects and equipment was the most frequent fatal event for self-employed workers.
Information in this release incorporates revisions to both the North American Industry Classification System (NAICS) and the Standard Occupational Classification codes (SOC). Comparison of data for 2019 to prior years should be done with caution due to these changes, and thus analysis in this release is limited to 2019 for industries and occupations. More information on NAICS can be found at www.bls.gov/bls/naics.htm. More information on SOC can be found at www.bls.gov/soc/2018/home.htm.
Data in this news release are for reference year 2019. No changes in collection procedures or outputs were necessary due to COVID-19. Additional information is available at www.bls.gov/covid19/effects-of-covid-19-on-workplace-injuries-and-illnesses-compensation-and-occupational-requirements.htm
Background of the program. The Census of Fatal Occupational Injuries (CFOI), part of the Bureau of Labor Statistics (BLS) Occupational Safety and Health Statistics (OSHS) program, is a count of all fatal work injuries occurring in the U.S. during the calendar year. The CFOI uses a variety of state, federal, and independent data sources to identify, verify, and describe fatal work injuries. This ensures counts are as complete and accurate as possible. For the 2019 national data, over 25,100 unique source documents were reviewed as part of the data collection process. For technical information and definitions for the CFOI, see the BLS Handbook of Methods on the BLS website at www.bls.gov/opub/hom/cfoi/home.htm and the CFOI definitions at www.bls.gov/iif/oshcfdef.htm.
Federal/State agency coverage. The CFOI includes data for all fatal work injuries, some of which may be outside the scope of other agencies or regulatory coverage. Comparisons between CFOI counts and those released by other agencies should account for the different coverage requirements and definitions used by each agency. For more information on the scope of CFOI, see www.bls.gov/iif/cfoiscope.htm and www.bls.gov/opub/hom/cfoi/concepts.htm.
Acknowledgments. BLS thanks the Michigan Department of Licensing and Regulatory Affairs for their efforts in collecting accurate, comprehensive, and useful data on fatal work injuries. BLS also appreciates the efforts of all federal, state, local, and private sector entities that provided source documents used to identify fatal work injuries. Among these agencies are the Occupational Safety and Health Administration; the National Transportation Safety Board; the U.S. Coast Guard; the Mine Safety and Health Administration; the Office of Workers’ Compensation Programs (Federal Employees' Compensation and Longshore and Harbor Workers' Compensation divisions); the Federal Railroad Administration; the National Highway Traffic Safety Administration; state vital statistics registrars, coroners, and medical examiners; state departments of health, labor, and industrial relations and workers' compensation agencies; state and local police departments; and state farm bureaus.
Information in this release will be made available to sensory impaired individuals upon request. Voice phone: (202) 691-5200; Federal Relay Service: (800) 877-8339.
| Event or exposure (1) | 2018 | 2019 | |
|---|---|---|---|
| Number | Number | Percent | |
Total | 155 | 164 | 100 |
Violence and other injuries by persons or animals | 37 | 38 | 23 |
Intentional injury by person | 36 | 35 | 21 |
Intentional injury by other person | 22 | 12 | 7 |
Shooting by other person--intentional | 18 | 9 | 5 |
Self-inflicted injury--intentional | 14 | 23 | 14 |
Shooting--intentional self-harm | 6 | 12 | 7 |
Hanging, strangulation, asphyxiation--intentional self-harm | 7 | 9 | 5 |
Animal and insect related incidents | -- | 3 | 2 |
Struck by animal | -- | 3 | 2 |
Transportation incidents | 50 | 56 | 34 |
Aircraft incidents | 3 | 9 | 5 |
Aircraft crash during takeoff or landing | 2 | 7 | 4 |
Aircraft crash during takeoff or landing--due to mechanical failure | 1 | 2 | 1 |
Other in-flight crash | 1 | 2 | 1 |
Other in-flight crash due to mechanical failure | -- | 2 | 1 |
Pedestrian vehicular incident | 17 | 5 | 3 |
Pedestrian struck by vehicle in work zone | 5 | 1 | 1 |
Pedestrian struck by forward-moving vehicle in work zone | 4 | 1 | 1 |
Pedestrian struck by vehicle on side of road | 2 | 1 | 1 |
Pedestrian struck by forward-moving vehicle on side of road | 1 | 1 | 1 |
Pedestrian struck by vehicle in nonroadway area | 3 | 3 | 2 |
Pedestrian struck by vehicle propelled by another vehicle in nonroadway area | -- | 1 | 1 |
Pedestrian struck by forward-moving vehicle in nonroadway area | 1 | 2 | 1 |
Water vehicle incidents | -- | 1 | 1 |
Fall or jump from water vehicle | -- | 1 | 1 |
Roadway incidents involving motorized land vehicle | 23 | 32 | 20 |
Roadway collision with other vehicle | 20 | 22 | 13 |
Roadway collision--moving in same direction | 5 | 6 | 4 |
Roadway collision--moving in opposite directions, oncoming | 3 | 2 | 1 |
Roadway collision--moving perpendicularly | 9 | 5 | 3 |
Roadway collision--moving and standing vehicle in roadway | 3 | 7 | 4 |
Roadway collision with object other than vehicle | 3 | 9 | 5 |
Vehicle struck object or animal on side of roadway | 3 | 9 | 5 |
Roadway noncollision incident | -- | 1 | 1 |
Fall or jump from and struck by same vehicle in normal operation, roadway | -- | 1 | 1 |
Nonroadway incident involving motorized land vehicles | 7 | 9 | 5 |
Nonroadway noncollision incident | 4 | 7 | 4 |
Jack-knifed or overturned, nonroadway | -- | 5 | 3 |
Fall or jump from and struck by same vehicle in normal operation, nonroadway | -- | 1 | 1 |
Fall or jump from and struck by another vehicle in normal operation, nonroadway | -- | 1 | 1 |
Fires and explosions | 4 | 5 | 3 |
Fires | -- | 3 | 2 |
Ignition of vapors, gases, or liquids | -- | 1 | 1 |
Explosions | 1 | 2 | 1 |
Explosion of nonpressurized vapors, gases, or liquids | 1 | 1 | 1 |
Explosion of pressure vessel, piping, or tire | -- | 1 | 1 |
Falls, slips, trips | 20 | 21 | 13 |
Falls on same level | 7 | 4 | 2 |
Falls to lower level | 13 | 17 | 10 |
Fall from collapsing structure or equipment | -- | 3 | 2 |
Fall from collapsing structure or equipment 16 to 20 feet | -- | 1 | 1 |
Fall through surface or existing opening | -- | 3 | 2 |
Fall through surface or existing opening 16 to 20 feet | -- | 1 | 1 |
Other fall to lower level | 10 | 11 | 7 |
Other fall to lower level 6 to 10 feet | 4 | 4 | 2 |
Exposure to harmful substances or environments | 17 | 20 | 12 |
Exposure to electricity | 5 | 5 | 3 |
Indirect exposure to electricity | 3 | 2 | 1 |
Indirect exposure to electricity, greater than 220 volts | 3 | 2 | 1 |
Exposure to other harmful substances | 10 | 13 | 8 |
Nonmedical use of drugs or alcohol--unintentional overdose | 8 | 8 | 5 |
Inhalation of harmful substance | -- | 5 | 3 |
Inhalation of harmful substance--single episode | -- | 5 | 3 |
Contact with objects and equipment | 27 | 24 | 15 |
Struck by object or equipment | 22 | 20 | 12 |
Struck by powered vehicle--nontransport | 10 | 12 | 7 |
Struck by swinging part of powered vehicle | -- | 1 | 1 |
Struck by falling part of powered vehicle still attached | -- | 5 | 3 |
Struck by falling object or equipment--other than powered vehicle | 9 | 5 | 3 |
Injured by handheld object or equipment | -- | 1 | 1 |
Injured by slipping or swinging object held by injured worker | -- | 1 | 1 |
Caught in or compressed by equipment or objects | -- | 2 | 1 |
Caught in running equipment or machinery | -- | 2 | 1 |
Caught in running equipment or machinery during maintenance, cleaning | -- | 1 | 1 |
Caught in running equipment or machinery during regular operation | -- | 1 | 1 |
Struck, caught, or crushed in collapsing structure, equipment, or material | 3 | 2 | 1 |
Struck, caught, or crushed in other collapsing structure or equipment | -- | 1 | 1 |
Engulfment in other collapsing material | 1 | 1 | 1 |
Overexertion and bodily reaction | -- | -- | -- |
Footnotes: | |||
NOTE: Data for all years are final. Totals for major categories may include subcategories not shown separately. For complete information on how the data are coded and presented see our definitions page at https://www.bls.gov/iif/oshcfdef.htm. Dashes indicate no data reported or data that do not meet publication criteria. CFOI fatal injury counts exclude illness-related deaths unless precipitated by an injury event. | |||
| Industry (1) | Number | Percent |
|---|---|---|
Total | 164 | 100 |
Private industry (2) | 157 | 96 |
Goods producing | -- | -- |
Natural resources and mining | 36 | 22 |
Agriculture, forestry, fishing and hunting | 33 | 20 |
Crop production | 18 | 11 |
Oilseed and grain farming | 9 | 5 |
Soybean farming | 1 | 1 |
Oilseed (except soybean) farming | 1 | 1 |
Corn farming | 7 | 4 |
Greenhouse, nursery, and floriculture production | 1 | 1 |
Other crop farming | 3 | 2 |
Hay farming | 2 | 1 |
All other crop farming | 1 | 1 |
Animal production and aquaculture | 10 | 6 |
Cattle ranching and farming | 8 | 5 |
Dairy cattle and milk production | 8 | 5 |
Sheep and goat farming | 1 | 1 |
Other animal production | 1 | 1 |
Horses and other equine production | 1 | 1 |
Forestry and logging | 5 | 3 |
Logging | 5 | 3 |
Logging | 5 | 3 |
Mining, quarrying, and oil and gas extraction (3) | 3 | 2 |
Mining (except oil and gas) | 2 | 1 |
Metal ore mining | 2 | 1 |
Copper, nickel, lead, and zinc mining | 2 | 1 |
Support activities for mining | 1 | 1 |
Support activities for mining | 1 | 1 |
Support activities for mining | 1 | 1 |
Support activities for oil and gas operations | 1 | 1 |
Construction | 31 | 19 |
Construction | 31 | 19 |
Heavy and civil engineering construction | 5 | 3 |
Highway, street, and bridge construction | 3 | 2 |
Highway, street, and bridge construction | 3 | 2 |
Service providing (4) | -- | -- |
Trade, transportation, and utilities | 40 | 24 |
Wholesale trade | 5 | 3 |
Merchant wholesalers, durable goods | 4 | 2 |
Machinery, equipment, and supplies merchant wholesalers | 1 | 1 |
Industrial machinery and equipment merchant wholesalers | 1 | 1 |
Miscellaneous durable goods merchant wholesalers | 1 | 1 |
Recyclable material merchant wholesalers | 1 | 1 |
Merchant wholesalers, nondurable goods | 1 | 1 |
Grocery and related product merchant wholesalers | 1 | 1 |
Retail trade | 17 | 10 |
Motor vehicle and parts dealers | 3 | 2 |
Automotive parts, accessories, and tire stores | 3 | 2 |
Furniture and home furnishings stores | 2 | 1 |
Electronics and appliance stores | 1 | 1 |
Electronics and appliance stores | 1 | 1 |
Electronics and appliance stores | 1 | 1 |
Food and beverage stores | 3 | 2 |
Grocery stores | 1 | 1 |
Convenience stores | 1 | 1 |
Miscellaneous store retailers | 1 | 1 |
Used merchandise stores | 1 | 1 |
Used merchandise stores | 1 | 1 |
Nonstore retailers | 3 | 2 |
Vending machine operators | 1 | 1 |
Vending machine operators | 1 | 1 |
Transportation and warehousing | 18 | 11 |
Air transportation | 2 | 1 |
Nonscheduled air transportation | 2 | 1 |
Nonscheduled air transportation | 2 | 1 |
Nonscheduled chartered passenger air transportation | 2 | 1 |
Truck transportation | 12 | 7 |
General freight trucking | 9 | 5 |
General freight trucking, local | 3 | 2 |
General freight trucking, long-distance | 6 | 4 |
General freight trucking, long-distance, truckload | 3 | 2 |
Specialized freight trucking | 3 | 2 |
Specialized freight (except used goods) trucking, local | 1 | 1 |
Couriers and messengers | 1 | 1 |
Couriers and express delivery services | 1 | 1 |
Couriers and express delivery services | 1 | 1 |
Financial activities | -- | -- |
Professional and business services | -- | -- |
Administrative and support and waste management and remediation services | 11 | 7 |
Administrative and support services | 7 | 4 |
Waste management and remediation services | 4 | 2 |
Remediation and other waste management services | 1 | 1 |
All other waste management services | 1 | 1 |
Educational and health services | 5 | 3 |
Health care and social assistance | 5 | 3 |
Nursing and residential care facilities | 2 | 1 |
Residential intellectual and developmental disability, mental health, and substance abuse facilities | 1 | 1 |
Residential intellectual and developmental disability facilities | 1 | 1 |
Continuing care retirement communities and assisted living facilities for the elderly | 1 | 1 |
Continuing care retirement communities and assisted living facilities for the elderly | 1 | 1 |
Assisted living facilities for the elderly | 1 | 1 |
Leisure and hospitality | 7 | 4 |
Arts, entertainment, and recreation | 3 | 2 |
Performing arts, spectator sports, and related industries | 3 | 2 |
Performing arts companies | 1 | 1 |
Spectator sports | 2 | 1 |
Spectator sports | 2 | 1 |
Racetracks | 1 | 1 |
Accommodation and food services | 4 | 2 |
Food services and drinking places | 4 | 2 |
Special food services | 1 | 1 |
Mobile food services | 1 | 1 |
Restaurants and other eating places | 3 | 2 |
Restaurants and other eating places | 3 | 2 |
Other services, except public administration | 8 | 5 |
Other services, except public administration | 8 | 5 |
Government (5) | 7 | 4 |
Federal government | -- | -- |
State government | 3 | 2 |
Local government | 4 | 2 |
Footnotes: | ||
NOTE: Data for all years are final. Totals for major categories may include subcategories not shown separately. For complete information on how the data are coded and presented see our definitions page at https://www.bls.gov/iif/oshcfdef.htm. Dashes indicate no data reported or data that do not meet publication criteria. CFOI fatal injury counts exclude illness-related deaths unless precipitated by an injury event. | ||
| Occupation (1) | Number | Percent |
|---|---|---|
Total | 164 | 100 |
Management occupations | 26 | 16 |
Other management occupations | 24 | 15 |
Farmers, ranchers, and other agricultural managers | 22 | 13 |
Farmers, ranchers, and other agricultural managers | 22 | 13 |
Medical and health services managers | 1 | 1 |
Medical and health services managers | 1 | 1 |
Property, real estate, and community association managers | 1 | 1 |
Property, real estate, and community association managers | 1 | 1 |
Business and financial operations occupations | 3 | 2 |
Business operations specialists | 3 | 2 |
Claims adjusters, appraisers, examiners, and investigators | 1 | 1 |
Claims adjusters, examiners, and investigators | 1 | 1 |
Computer and mathematical occupations | -- | -- |
Architecture and engineering occupations | 3 | 2 |
Life, physical, and social science occupations | -- | -- |
Community and social service occupations | -- | -- |
Counselors, social workers, and other community and social service specialists | -- | -- |
Counselors | -- | -- |
Educational, guidance, and career counselors and advisors | 1 | 1 |
Legal occupations | -- | -- |
Educational instruction and library occupations | -- | -- |
Preschool, elementary, middle, secondary, and special education teachers | 1 | 1 |
Arts, design, entertainment, sports, and media occupations | 2 | 1 |
Entertainers and performers, sports and related workers | 2 | 1 |
Athletes, coaches, umpires, and related workers | 2 | 1 |
Athletes and sports competitors | 2 | 1 |
Healthcare practitioners and technical occupations | -- | -- |
Healthcare support occupations | -- | -- |
Protective service occupations | -- | -- |
Food preparation and serving related occupations | 3 | 2 |
Food and beverage serving workers | 1 | 1 |
Waiters and waitresses | 1 | 1 |
Waiters and waitresses | 1 | 1 |
Building and grounds cleaning and maintenance occupations | 7 | 4 |
Supervisors of building and grounds cleaning and maintenance workers | 1 | 1 |
First-line supervisors of building and grounds cleaning and maintenance workers | 1 | 1 |
First-line supervisors of landscaping, lawn service, and groundskeeping workers | 1 | 1 |
Grounds maintenance workers | 5 | 3 |
Grounds maintenance workers | 5 | 3 |
Landscaping and groundskeeping workers | 4 | 2 |
Tree trimmers and pruners | 1 | 1 |
Personal care and service occupations | -- | -- |
Sales and related occupations | 14 | 9 |
Supervisors of sales workers | 5 | 3 |
First-line supervisors of sales workers | 5 | 3 |
First-line supervisors of retail sales workers | 3 | 2 |
Retail sales workers | 6 | 4 |
Cashiers | 3 | 2 |
Retail salespersons | 3 | 2 |
Retail salespersons | 3 | 2 |
Other sales and related workers | 3 | 2 |
Miscellaneous sales and related workers | 1 | 1 |
Office and administrative support occupations | -- | -- |
Farming, fishing, and forestry occupations | 10 | 6 |
Agricultural workers | 6 | 4 |
Miscellaneous agricultural workers | 6 | 4 |
Farmworkers and laborers, crop, nursery, and greenhouse | 1 | 1 |
Farmworkers, farm, ranch, and aquacultural animals | 5 | 3 |
Forest, conservation, and logging workers | 4 | 2 |
Logging workers | 4 | 2 |
Fallers | 4 | 2 |
Construction and extraction occupations | 32 | 20 |
Supervisors of construction and extraction workers | 8 | 5 |
First-line supervisors of construction trades and extraction workers | 8 | 5 |
First-line supervisors of construction trades and extraction workers | 8 | 5 |
Construction trades workers | 23 | 14 |
Carpenters | 5 | 3 |
Carpenters | 5 | 3 |
Construction laborers | 4 | 2 |
Construction laborers | 4 | 2 |
Construction equipment operators | 4 | 2 |
Operating engineers and other construction equipment operators | 4 | 2 |
Electricians | 4 | 2 |
Electricians | 4 | 2 |
Other construction and related workers | 1 | 1 |
Highway maintenance workers | 1 | 1 |
Highway maintenance workers | 1 | 1 |
Installation, maintenance, and repair occupations | 16 | 10 |
Vehicle and mobile equipment mechanics, installers, and repairers | 8 | 5 |
Aircraft mechanics and service technicians | 2 | 1 |
Aircraft mechanics and service technicians | 2 | 1 |
Other installation, maintenance, and repair occupations | 6 | 4 |
Industrial machinery installation, repair, and maintenance workers | 1 | 1 |
Industrial machinery mechanics | 1 | 1 |
Maintenance and repair workers, general | 3 | 2 |
Maintenance and repair workers, general | 3 | 2 |
Production occupations | 9 | 5 |
Other production occupations | 5 | 3 |
Miscellaneous production workers | 3 | 2 |
Cleaning, washing, and metal pickling equipment operators and tenders | 1 | 1 |
Transportation and material moving occupations | 31 | 19 |
Air transportation workers | 2 | 1 |
Aircraft pilots and flight engineers | 2 | 1 |
Commercial pilots | 2 | 1 |
Motor vehicle operators | 22 | 13 |
Driver/sales workers and truck drivers | 21 | 13 |
Driver/sales workers | 3 | 2 |
Heavy and tractor-trailer truck drivers | 16 | 10 |
Passenger vehicle drivers | 1 | 1 |
Taxi drivers | 1 | 1 |
Material moving workers | 7 | 4 |
Laborers and material movers | 5 | 3 |
Military specific occupations (2) | -- | -- |
Footnotes: | ||
NOTE: Data for all years are final. Totals for major categories may include subcategories not shown separately. For complete information on how the data are coded and presented see our definitions page at https://www.bls.gov/iif/oshcfdef.htm. Dashes indicate no data reported or data that do not meet publication criteria. CFOI fatal injury counts exclude illness-related deaths unless precipitated by an injury event. | ||
| Worker characteristics | 2018 | 2019 | |
|---|---|---|---|
| Number | Number | Percent | |
Total | 155 | 164 | 100 |
Employee status | |||
Wage and salary workers (1) | 110 | 111 | 68 |
Self-employed (2) | 45 | 53 | 32 |
Gender | |||
Men | 141 | 151 | 92 |
Women | 14 | 13 | 8 |
Age (3) | |||
Under 16 years | -- | 1 | 1 |
16 to 17 years | -- | 1 | 1 |
18 to 19 years | -- | 3 | 2 |
20 to 24 years | 11 | 9 | 5 |
25 to 34 years | 22 | 27 | 16 |
35 to 44 years | 32 | 20 | 12 |
45 to 54 years | 26 | 40 | 24 |
55 to 64 years | 41 | 30 | 18 |
65 years and over | 23 | 33 | 20 |
Race or ethnic origin (4) | |||
White, non-Hispanic | 128 | 133 | 81 |
Black or African-American, non-Hispanic | 17 | 18 | 11 |
Hispanic or Latino | 8 | 7 | 4 |
Footnotes: | |||
NOTE: Data for all years are final. Totals for major categories may include subcategories not shown separately. For complete information on how the data are coded and presented see our definitions page at https://www.bls.gov/iif/oshcfdef.htm. Dashes indicate no data reported or data that do not meet publication criteria. CFOI fatal injury counts exclude illness-related deaths unless precipitated by an injury event. | |||
Last Modified Date: Wednesday, March 17, 2021