An official website of the United States government
An official website of the United States government
The .gov means it's official.
Federal government websites often end in .gov or .mil. Before sharing sensitive information,
make sure you're on a federal government site.
The site is secure.
The
https:// ensures that you are connecting to the official website and that any
information you provide is encrypted and transmitted securely.
25-945-CHI
Thursday, June 12, 2025
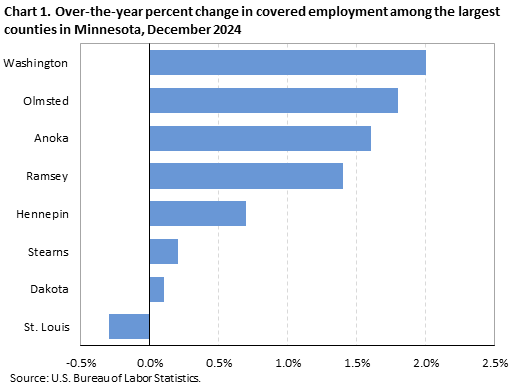
Employment rose in 7 of the 8 largest counties in Minnesota from December 2023 to December 2024, the U.S. Bureau of Labor Statistics reported today. Acting Regional Commissioner Julie Wilson noted that Washington County had the largest over-the-year increase in employment at 2.0 percent. (See chart 1 and table 1.)
Among the eight largest counties in Minnesota, employment was highest in Hennepin (921,700) in December 2024. Together, the eight largest counties accounted for 66.4 percent of total covered employment within the state. Nationwide, the 369 largest counties comprise 73.3 percent of total covered employment in the United States. (Large counties and county equivalents are those with annual average employment levels of 75,000 or more in 2023.)
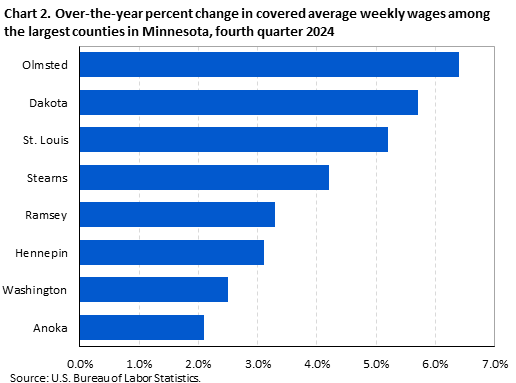
Large county average weekly wages in the fourth quarter 2024All eight large Minnesota counties reported average weekly wage gains over the year. (See chart 2.) Olmsted had the largest gain (+6.4 percent). Over-the-year wage gains among Minnesota’s other seven large counties ranged from 5.7 percent to 2.1 percent.
Weekly wages in 3 of the 8 largest counties in Minnesota were above the national average of $1,507. Average weekly wages ranged from $1,720 in Hennepin to $1,188 in St. Louis.
Smaller county average weekly wages in the fourth quarter of 2024Employment and wage levels (but not over-the-year changes) are also available for the 79 small counties in Minnesota, defined as having employment below 75,000 in 2023. (See table 2.) Wage levels in all 79 smaller counties were below the national average. Stevens reported the highest average weekly wage ($1,488). Pine reported the lowest average weekly wage ($882) in the state.
Among all 87 Minnesota counties, 24 reported average weekly wages of less than $1,025, 24 registered wages from $1,025 to $1,099, 16 had wages from $1,100 to $1,174, and 23 had average weekly wages of $1,175 or higher. (See map 1 and table 2.)
QCEW data for states have been included in this release in table 3.
Nationwide coverage of the largest counties is published in the County Employment and Wages news release. Additional information about quarterly employment and wages data is available in the news release Technical Note and from the Quarterly Census of Employment and Wages website.
Information in this release will be made available to individuals with sensory impairments upon request. Voice phone: (202) 691-5200; Telecommunications Relay Service: 7-1-1.
The County Employment and Wages release for the first quarter 2025 is scheduled to be released on Tuesday, September 9, 2025.
The Quarterly Census of Employment and Wages (QCEW) is streamlining its release process. Beginning with the fourth quarter 2024 national release on June 4, QCEW will publish the national County Employment and Wages news release on the same date as the QCEW full data update. Revised news release dates are available online.
| Area | Establishments, fourth quarter (thousands) | Employment | Average weekly wage (1) | |||||
|---|---|---|---|---|---|---|---|---|
| December 2024 (thousands) | Percent change, December 2023–24 (2) | National ranking by percent change (3) | Fourth quarter 2024 ($) | National ranking by level (3) | Percent change, fourth quarter 2023–24 (2) | National ranking by percent change (3) | ||
United States (4) | 12,265.4 | 156,202.9 | 0.8 | -- | 1,507 | -- | 5.0 | -- |
Minnesota | 215.1 | 2,945.4 | 1.1 | -- | 1,452 | 14 | 3.7 | 42 |
Anoka | 8.9 | 133.9 | 1.6 | 51 | 1,272 | 221 | 2.1 | 335 |
Dakota | 12.0 | 189.0 | 0.1 | 251 | 1,462 | 106 | 5.7 | 64 |
Hennepin | 44.8 | 921.7 | 0.7 | 159 | 1,720 | 34 | 3.1 | 291 |
Olmsted | 4.1 | 104.6 | 1.8 | 35 | 1,640 | 52 | 6.4 | 38 |
Ramsey | 15.5 | 328.2 | 1.4 | 61 | 1,519 | 82 | 3.3 | 269 |
St. Louis | 5.7 | 95.0 | -0.3 | 301 | 1,188 | 295 | 5.2 | 101 |
Stearns | 4.8 | 87.1 | 0.2 | 238 | 1,254 | 242 | 4.2 | 184 |
Washington | 7.0 | 96.3 | 2.0 | 25 | 1,192 | 294 | 2.5 | 324 |
Footnotes: | ||||||||
Note: Data are preliminary. Dashes indicate data not applicable or available. Covered employment and wages include workers covered by Unemployment Insurance (UI) and Unemployment Compensation for Federal Employees (UCFE) programs. | ||||||||
| Area | Establishments | Employment December 2024 | Average weekly wage ($) (1) |
|---|---|---|---|
United States (2) | 12,265,395 | 156,202,874 | 1,507 |
Minnesota | 215,119 | 2,945,434 | 1,452 |
Aitkin | 480 | 4,270 | 937 |
Anoka | 8,875 | 133,923 | 1,272 |
Becker | 1,133 | 15,023 | 1,064 |
Beltrami | 1,334 | 20,721 | 1,078 |
Benton | 1,064 | 17,057 | 1,112 |
Big Stone | 223 | 1,718 | 1,213 |
Blue Earth | 2,154 | 42,161 | 1,136 |
Brown | 903 | 13,267 | 1,124 |
Carlton | 822 | 13,113 | 1,183 |
Carver | 2,880 | 40,911 | 1,372 |
Cass | 967 | 10,129 | 905 |
Chippewa | 424 | 5,251 | 1,078 |
Chisago | 1,404 | 15,934 | 1,137 |
Clay | 1,523 | 19,701 | 1,072 |
Clearwater | 234 | 2,520 | 1,215 |
Cook | 331 | 2,475 | 919 |
Cottonwood | 449 | 4,889 | 1,024 |
Crow Wing | 2,383 | 30,498 | 1,057 |
Dakota | 11,959 | 189,028 | 1,462 |
Dodge | 507 | 5,974 | 1,177 |
Douglas | 1,492 | 19,269 | 1,121 |
Faribault | 498 | 4,519 | 1,077 |
Fillmore | 809 | 6,249 | 893 |
Freeborn | 837 | 11,958 | 1,060 |
Goodhue | 1,388 | 21,439 | 1,205 |
Grant | 262 | 1,844 | 1,043 |
Hennepin | 44,783 | 921,739 | 1,720 |
Houston | 478 | 5,135 | 965 |
Hubbard | 681 | 5,951 | 932 |
Isanti | 973 | 12,058 | 1,009 |
Itasca | 1,358 | 16,407 | 1,076 |
Jackson | 367 | 4,920 | 1,005 |
Kanabec | 365 | 4,153 | 1,026 |
Kandiyohi | 1,481 | 23,229 | 1,069 |
Kittson | 199 | 1,460 | 1,080 |
Koochiching | 424 | 4,191 | 1,082 |
Lac qui Parle | 245 | 2,251 | 968 |
Lake | 378 | 3,851 | 1,054 |
Lake of the Woods | 187 | 1,576 | 933 |
Le Sueur | 793 | 8,224 | 1,126 |
Lincoln | 226 | 1,791 | 889 |
Lyon | 859 | 13,781 | 1,016 |
McLeod | 1,054 | 15,690 | 1,122 |
Mahnomen | 125 | 1,976 | 1,144 |
Marshall | 349 | 2,438 | 1,177 |
Martin | 707 | 8,401 | 1,171 |
Meeker | 711 | 8,082 | 1,096 |
Mille Lacs | 794 | 9,329 | 937 |
Morrison | 1,126 | 11,118 | 950 |
Mower | 911 | 16,877 | 1,350 |
Murray | 337 | 2,934 | 1,001 |
Nicollet | 850 | 14,953 | 1,112 |
Nobles | 640 | 9,924 | 1,078 |
Norman | 261 | 1,706 | 986 |
Olmsted | 4,075 | 104,640 | 1,640 |
Otter Tail | 1,915 | 22,674 | 1,038 |
Pennington | 423 | 9,463 | 1,125 |
Pine | 734 | 7,717 | 882 |
Pipestone | 401 | 4,313 | 1,032 |
Polk | 1,032 | 12,191 | 1,098 |
Pope | 385 | 4,479 | 1,133 |
Ramsey | 15,474 | 328,226 | 1,519 |
Red Lake | 126 | 1,000 | 963 |
Redwood | 591 | 6,205 | 1,130 |
Renville | 593 | 5,704 | 1,198 |
Rice | 1,783 | 26,416 | 1,284 |
Rock | 327 | 3,718 | 1,065 |
Roseau | 475 | 7,793 | 1,205 |
St. Louis | 5,664 | 94,954 | 1,188 |
Scott | 4,008 | 64,120 | 1,264 |
Sherburne | 2,491 | 28,191 | 1,165 |
Sibley | 401 | 3,713 | 1,224 |
Stearns | 4,750 | 87,051 | 1,254 |
Steele | 1,132 | 19,135 | 1,187 |
Stevens | 400 | 5,838 | 1,488 |
Swift | 372 | 3,708 | 1,054 |
Todd | 633 | 7,243 | 1,075 |
Traverse | 154 | 1,046 | 1,013 |
Wabasha | 615 | 6,595 | 959 |
Wadena | 447 | 5,703 | 974 |
Waseca | 555 | 5,340 | 1,096 |
Washington | 7,039 | 96,333 | 1,192 |
Watonwan | 342 | 4,579 | 954 |
Wilkin | 210 | 1,613 | 1,116 |
Winona | 1,254 | 24,312 | 1,089 |
Wright | 3,998 | 48,596 | 1,147 |
Yellow Medicine | 383 | 3,752 | 1,001 |
Footnotes: | |||
Note: Data are preliminary. Dashes indicate data not applicable or available. Covered employment and wages include workers covered by Unemployment Insurance (UI) and Unemployment Compensation for Federal Employees (UCFE) programs. | |||
| State | Establishments, fourth quarter (thousands) | Employment | Average weekly wage (1) | ||||
|---|---|---|---|---|---|---|---|
| December 2024 (thousands) | Percent change, December 2023–24 | Fourth quarter 2024 ($) | National ranking by level | Percent change, fourth quarter 2023–24 | National ranking by percent change | ||
United States (2) | 12,265.4 | 156,202.9 | 0.8 | 1,507 | -- | 5.0 | -- |
Alabama | 162.3 | 2,122.2 | 0.9 | 1,255 | 36 | 4.1 | 32 |
Alaska | 25.3 | 317.4 | 1.7 | 1,430 | 16 | 4.2 | 30 |
Arizona | 225.5 | 3,272.3 | 1.2 | 1,406 | 19 | 6.4 | 6 |
Arkansas | 106.1 | 1,312.6 | 1.1 | 1,153 | 50 | 5.9 | 10 |
California | 1,903.9 | 18,230.8 | 0.5 | 1,872 | 5 | 6.5 | 5 |
Colorado | 236.6 | 2,911.3 | -0.3 | 1,594 | 8 | 5.1 | 16 |
Connecticut | 150.7 | 1,700.7 | 0.5 | 1,716 | 6 | 5.2 | 15 |
Delaware | 45.2 | 480.6 | 1.5 | 1,437 | 15 | 4.5 | 24 |
District of Columbia | 52.4 | 757.2 | -0.5 | 2,495 | 1 | 4.7 | 21 |
Florida | 914.8 | 9,978.9 | 0.9 | 1,405 | 20 | 5.7 | 13 |
Georgia | 396.6 | 4,916.6 | 0.8 | 1,391 | 21 | 4.7 | 21 |
Hawaii | 61.4 | 651.3 | 1.1 | 1,345 | 27 | 4.3 | 26 |
Idaho | 103.9 | 859.1 | 0.5 | 1,232 | 39 | 8.3 | 3 |
Illinois | 411.2 | 6,089.1 | 0.5 | 1,538 | 12 | 4.1 | 32 |
Indiana | 194.6 | 3,201.9 | 0.4 | 1,222 | 44 | 4.4 | 25 |
Iowa | 112.5 | 1,559.3 | -0.6 | 1,237 | 38 | 3.2 | 50 |
Kansas | 103.5 | 1,445.6 | 0.9 | 1,218 | 45 | 4.3 | 26 |
Kentucky | 159.0 | 2,008.4 | 0.2 | 1,189 | 46 | 3.8 | 39 |
Louisiana | 156.8 | 1,936.3 | 1.1 | 1,228 | 40 | 2.8 | 51 |
Maine | 66.2 | 643.9 | 0.9 | 1,278 | 33 | 5.9 | 10 |
Maryland | 197.0 | 2,779.9 | 1.6 | 1,570 | 10 | 4.2 | 30 |
Massachusetts | 288.5 | 3,646.1 | -0.4 | 1,890 | 3 | 4.7 | 21 |
Michigan | 303.4 | 4,406.8 | -0.1 | 1,370 | 23 | 4.1 | 32 |
Minnesota | 215.1 | 2,945.4 | 1.1 | 1,452 | 14 | 3.7 | 42 |
Mississippi | 90.9 | 1,174.3 | 0.2 | 1,023 | 51 | 4.1 | 32 |
Missouri | 251.5 | 2,922.2 | 0.5 | 1,268 | 35 | 3.8 | 39 |
Montana | 65.8 | 512.8 | 0.5 | 1,254 | 37 | 6.4 | 6 |
Nebraska | 78.0 | 1,024.8 | 0.5 | 1,227 | 41 | 3.5 | 45 |
Nevada | 108.1 | 1,561.5 | 0.4 | 1,350 | 25 | 6.1 | 9 |
New Hampshire | 68.7 | 692.4 | 0.4 | 1,577 | 9 | 3.3 | 49 |
New Jersey | 339.1 | 4,332.2 | 0.9 | 1,629 | 7 | 3.4 | 47 |
New Mexico | 68.9 | 873.8 | 0.3 | 1,223 | 42 | 5.0 | 17 |
New York | 711.5 | 9,777.3 | 1.5 | 1,881 | 4 | 5.4 | 14 |
North Carolina | 384.0 | 4,941.9 | 0.5 | 1,358 | 24 | 5.8 | 12 |
North Dakota | 36.9 | 431.1 | 0.9 | 1,315 | 30 | 3.8 | 39 |
Ohio | 346.3 | 5,551.7 | 0.6 | 1,305 | 32 | 4.8 | 20 |
Oklahoma | 129.7 | 1,713.2 | 0.8 | 1,168 | 48 | 4.1 | 32 |
Oregon | 190.9 | 1,989.6 | 0.0 | 1,424 | 17 | 6.6 | 4 |
Pennsylvania | 395.1 | 6,076.5 | 0.8 | 1,414 | 18 | 4.0 | 37 |
Rhode Island | 48.9 | 500.8 | 1.6 | 1,348 | 26 | 3.5 | 45 |
South Carolina | 195.3 | 2,310.1 | 1.4 | 1,223 | 42 | 6.2 | 8 |
South Dakota | 40.6 | 459.7 | 0.9 | 1,181 | 47 | 3.9 | 38 |
Tennessee | 232.2 | 3,320.3 | 0.9 | 1,372 | 22 | 5.0 | 17 |
Texas | 846.0 | 14,129.7 | 1.5 | 1,488 | 13 | 4.3 | 26 |
Utah | 142.6 | 1,735.8 | 1.3 | 1,333 | 29 | 3.7 | 42 |
Vermont | 33.7 | 311.2 | 0.0 | 1,311 | 31 | 4.9 | 19 |
Virginia | 320.9 | 4,142.6 | 1.2 | 1,546 | 11 | 4.3 | 26 |
Washington | 241.5 | 3,612.0 | 0.8 | 1,897 | 2 | 8.7 | 2 |
West Virginia | 62.7 | 701.4 | 0.2 | 1,159 | 49 | 3.4 | 47 |
Wisconsin | 212.2 | 2,950.8 | 0.4 | 1,278 | 33 | 3.6 | 44 |
Wyoming | 31.1 | 279.4 | 0.5 | 1,340 | 28 | 12.4 | 1 |
Puerto Rico | 51.6 | 975.4 | -0.2 | 718 | (3) | 4.5 | (3) |
Virgin Islands | 3.0 | 33.1 | -8.6 | 1,046 | (3) | 1.8 | (3) |
Footnotes: | |||||||
Note: Data are preliminary. Dashes indicate data not applicable or available. Covered employment and wages include workers covered by Unemployment Insurance (UI) and Unemployment Compensation for Federal Employees (UCFE) programs. | |||||||
Last Modified Date: Thursday, June 12, 2025