An official website of the United States government
An official website of the United States government
The .gov means it's official.
Federal government websites often end in .gov or .mil. Before sharing sensitive information,
make sure you're on a federal government site.
The site is secure.
The
https:// ensures that you are connecting to the official website and that any
information you provide is encrypted and transmitted securely.
25-116-CHI
Thursday, March 27, 2025
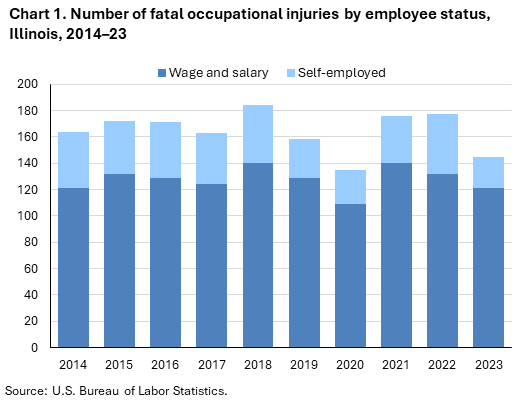
Fatal work injuries totaled 145 in 2023 for Illinois, the U.S. Bureau of Labor Statistics reported today. Acting Regional Commissioner Julie Wilson noted that the number of work-related fatalities in Illinois was down from the previous year. (See chart 1.) Fatal occupational injuries in the state have ranged from a high of 262 in 1996 to a low of 135 in 2020. Nationwide, a total of 5,283 fatal work injuries were recorded in 2023, a 3.7-percent decrease from 5,486 in 2022, according to the results from the Census of Fatal Occupational Injuries (CFOI).
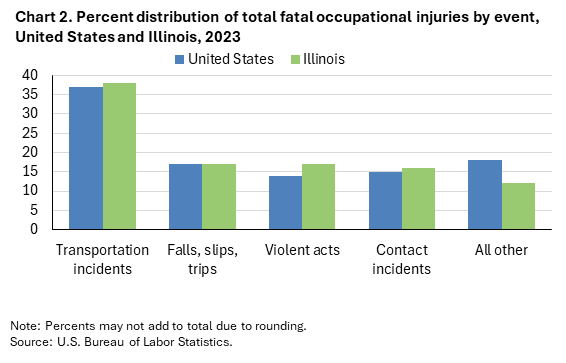
Transportation incidents (55) were the most frequent type of fatal event in Illinois, accounting for 38 percent of all fatal work injuries in the state. Nationally the share was 37 percent. (See chart 2 and table 1.)
Falls, slips, trips (25) and violent acts (24) each accounted for 17 percent of Illinois workplace fatalities; nationally the shares were 17 percent and 14 percent, respectively.
The transportation and warehousing sector had the highest number of fatalities with 40. (See table 2.)
Transportation incidents resulted in 28 of the 40 transportation and warehousing sector fatalities.
The general freight trucking industry group accounted for 17 of the sector’s fatal workplace injuries.
The transportation and material moving occupational group had the highest number of fatal workplace injuries with 55. (See table 3.)
Transportation incidents resulted in 38 of the transportation and material moving fatalities.
Heavy and tractor-trailer truck drivers accounted for 30 of the major group’s fatal workplace injuries.
Wage and salary workers accounted for 83 percent of workplace fatalities both in Illinois and nationally; the self-employed comprised the remaining 17 percent. (See chart 1 and table 4.) The most frequent fatal event for both wage and salary workers and self-employed workers was transportation incidents.
Males accounted for 89 percent of the work-related fatalities in Illinois and 91 percent nationally.
Workers 25-54 years old accounted for 55 percent of the state’s work-related fatalities, compared to 57 percent of on-the-job fatalities nationally. Workers 55-64 years old accounted for 26 percent of the state’s work-related fatalities in 2023, compared to 21 percent of on-the-job fatalities nationally.
White non-Hispanics accounted for 66 percent of those who died from a workplace injury. Nationwide, this group accounted for 56 percent of work-related deaths.
The 2022 North American Industry Classification System (NAICS) and the updated Occupational Injury and Illness Classification System (OIICS) were implemented with the release of 2023 data. As a result of these changes, comparisons between 2023 CFOI data and previous years should be made with caution. Refer to the national release technical note for more information.
Background of the program. The Census of Fatal Occupational Injuries (CFOI), part of the Bureau of Labor Statistics (BLS) Occupational Safety and Health Statistics (OSHS) program, is a count of all fatalities resulting from workplace injuries occurring in the U.S. during the calendar year. For technical information and definitions for the CFOI, see the national CFOI release Technical notes, the BLS Handbook of Methods, and the CFOI definitions.
Acknowledgments. BLS thanks the Illinois Department of Public Health for their efforts in collecting accurate, comprehensive, and useful data on fatal work injuries. BLS also appreciates the efforts of all federal, state, local, and private sector entities that provided source documents used to identify fatal work injuries nationally. See the national CFOI release Technical Notes for details on cooperating entities.
Information in this release will be made available to individuals with sensory impairments upon request. Voice phone: (202) 691-5200; Telecommunications Relay Service: 7-1-1.
| Event or Exposure (1) | Number | Percent (%) |
|---|---|---|
All events and exposures | 145 | 100 |
Violent acts | 24 | 17 |
Homicides (violent acts by other person) | 18 | 12 |
Shooting by other person | 16 | 11 |
Stabbing, cutting, slashing by other person | 1 | 1 |
Suicides (intentional self-harm) | 6 | 4 |
Transportation incidents | 55 | 38 |
Rail vehicle incidents | 2 | 1 |
Rail vehicle collisions | 2 | 1 |
Pedestrian incidents involving motorized land vehicles | 8 | 6 |
Pedestrian struck by vehicle in road work zone | 1 | 1 |
Pedestrian struck by forward-moving vehicle in road work zone | 1 | 1 |
Pedestrian struck by vehicle in roadway | 4 | 3 |
Pedestrian struck by forward-moving vehicle in roadway | 4 | 3 |
Pedestrian struck by vehicle in nonroadway area | 3 | 2 |
Pedestrian struck by vehicle or object propelled by another vehicle in nonroadway area | 1 | 1 |
Pedestrian struck by vehicle backing up in nonroadway area | 1 | 1 |
Roadway incidents involving motorized land vehicle | 37 | 26 |
Roadway collision with other vehicle(s) | 24 | 17 |
Roadway collision with other vehicle(s)-intersecting, turning | 9 | 6 |
Roadway collision with other vehicle(s)-moving in same direction | 3 | 2 |
Roadway collision with other vehicle(s)-moving in opposite directions, oncoming | 4 | 3 |
Roadway collision with other vehicle(s)-moving and standing vehicle | 6 | 4 |
Roadway collision with object other than vehicle | 6 | 4 |
Roadway noncollision incident | 7 | 5 |
Roadway noncollision- vehicle overturn | 4 | 3 |
Nonroadway incidents involving motorized land vehicles | 5 | 3 |
Nonroadway collision with object other than vehicle | 1 | 1 |
Nonroadway noncollision incident | 4 | 3 |
Explosions and fires | 5 | 3 |
Explosions | 2 | 1 |
Explosion of pressure vessel, piping, or tire | 1 | 1 |
Fires (without explosions) | 3 | 2 |
Falls, slips, trips | 25 | 17 |
Exposure to harmful substances, environments | 13 | 9 |
Exposure to harmful substances | 8 | 6 |
Contact incidents | 23 | 16 |
Collapse, engulfment | 3 | 2 |
Collapse, engulfment- closed mine or tunnel | 1 | 1 |
Collapse, engulfment- loose materials or liquids | 1 | 1 |
Collapse, engulfment- building or structure | 1 | 1 |
Struck by propelled, falling, or suspended object | 11 | 8 |
Struck by falling object | 7 | 5 |
Struck, caught, or compressed by running powered equipment | 6 | 4 |
Footnotes: | ||
NOTE: Data for all years are revised and final. Totals for major categories may include subcategories not shown separately. Dashes indicate no data reported or data that do not meet publication criteria. CFOI fatal injury counts exclude illness-related deaths unless precipitated by an injury event. | ||
| Industry | Number | Percentage (%) |
|---|---|---|
Total | 145 | 100 |
Private industry (1) | 128 | 88 |
Natural resources and mining | 14 | 10 |
Agriculture, forestry, fishing and hunting | 11 | 8 |
Crop production | 7 | 5 |
Oilseed and grain farming | 4 | 3 |
Soybean farming | 2 | 1 |
Corn farming | 2 | 1 |
Mining, quarrying, and oil and gas extraction | 3 | 2 |
Construction | 30 | 21 |
Construction | 30 | 21 |
Construction of buildings | 5 | 3 |
Residential building construction | 3 | 2 |
Residential building construction | 3 | 2 |
Nonresidential building construction | 2 | 1 |
Commercial and institutional building construction | 2 | 1 |
Heavy and civil engineering construction | 6 | 4 |
Utility system construction | 4 | 3 |
Highway, street, and bridge construction | 2 | 1 |
Highway, street, and bridge construction | 2 | 1 |
Specialty trade contractors | 18 | 12 |
Foundation, structure, and building exterior contractors | 9 | 6 |
Roofing contractors | 4 | 3 |
Residential roofing contractors | 1 | 1 |
Building equipment contractors | 4 | 3 |
Building finishing contractors | 3 | 2 |
Other specialty trade contractors | 2 | 1 |
Site preparation contractors | 1 | 1 |
All other specialty trade contractors | 1 | 1 |
Manufacturing | 9 | 6 |
Manufacturing | 9 | 6 |
Food manufacturing | 1 | 1 |
Grain and oilseed milling | 1 | 1 |
Chemical manufacturing | 1 | 1 |
Pesticide, fertilizer, and other agricultural chemical manufacturing | 1 | 1 |
Nonmetallic mineral product manufacturing | 2 | 1 |
Cement and concrete product manufacturing | 1 | 1 |
Concrete pipe, brick, and block manufacturing | 1 | 1 |
Concrete block and brick manufacturing | 1 | 1 |
Other nonmetallic mineral product manufacturing | 1 | 1 |
All other nonmetallic mineral product manufacturing | 1 | 1 |
Cut stone and stone product manufacturing | 1 | 1 |
Primary metal manufacturing | 1 | 1 |
Steel product manufacturing from purchased steel | 1 | 1 |
Iron and steel pipe and tube manufacturing from purchased steel | 1 | 1 |
Trade, transportation, and utilities | 53 | 37 |
Wholesale trade | 4 | 3 |
Retail trade | 9 | 6 |
Food and beverage retailers | 4 | 3 |
Grocery and convenience retailers | 3 | 2 |
Supermarkets and other grocery retailers (except convenience retailers) | 2 | 1 |
Convenience retailers and vending machine operators | 1 | 1 |
Convenience retailers | 1 | 1 |
Specialty food retailers | 1 | 1 |
Other specialty food retailers | 1 | 1 |
Transportation and warehousing | 40 | 28 |
Truck transportation | 25 | 17 |
General freight trucking | 17 | 12 |
General freight trucking, long-distance | 12 | 8 |
Specialized freight trucking | 7 | 5 |
Specialized freight (except used goods) trucking, long-distance | 4 | 3 |
Transit and ground passenger transportation | 5 | 3 |
Taxi and limousine service | 3 | 2 |
Taxi and ridesharing services | 3 | 2 |
Support activities for transportation | 3 | 2 |
Support activities for water transportation | 1 | 1 |
Marine cargo handling | 1 | 1 |
Support activities for road transportation | 2 | 1 |
Motor vehicle towing | 2 | 1 |
Couriers and messengers | 4 | 3 |
Information | -- | -- |
Financial activities | 1 | 1 |
Real estate and rental and leasing | 1 | 1 |
Real estate | 1 | 1 |
Activities related to real estate | 1 | 1 |
Real estate property managers | 1 | 1 |
Nonresidential property managers | 1 | 1 |
Professional and business services | 8 | 6 |
Administrative and support and waste management and remediation services | 8 | 6 |
Educational and health services | 5 | 3 |
Health care and social assistance | 5 | 3 |
Ambulatory health care services | 3 | 2 |
Other ambulatory health care services | 1 | 1 |
All other ambulatory health care services | 1 | 1 |
Blood and organ banks | 1 | 1 |
Hospitals | 1 | 1 |
General medical and surgical hospitals | 1 | 1 |
General medical and surgical hospitals | 1 | 1 |
Social assistance | 1 | 1 |
Individual and family services | 1 | 1 |
Other individual and family services | 1 | 1 |
Leisure and hospitality | -- | -- |
Accommodation and food services | 3 | 2 |
Food services and drinking places | 3 | 2 |
Restaurants and other eating places | 3 | 2 |
Restaurants and other eating places | 3 | 2 |
Full-service restaurants | 2 | 1 |
Other services (except public administration) | -- | -- |
Government (2) | 17 | 12 |
Federal government | 2 | 1 |
State government | 2 | 1 |
Local government | 13 | 9 |
Footnotes: | ||
NOTE: Data for all years are revised and final. Totals for major categories may include subcategories not shown separately. Dashes indicate no data reported or data that do not meet publication criteria. CFOI fatal injury counts exclude illness-related deaths unless precipitated by an injury event. | ||
| Occupation (1) | Number | Percentage (%) |
|---|---|---|
All occupations | 145 | 100 |
Management occupations | 6 | 4 |
Operations specialties managers | 1 | 1 |
Administrative services and facilities managers | 1 | 1 |
Other management occupations | 5 | 3 |
Farmers, ranchers, and other agricultural managers | 4 | 3 |
Farmers, ranchers, and other agricultural managers | 4 | 3 |
Miscellaneous managers | 1 | 1 |
Business and financial operations occupations | 1 | 1 |
Business operations specialists | 1 | 1 |
Training and development specialists | 1 | 1 |
Training and development specialists | 1 | 1 |
Community and social service occupations | 1 | 1 |
Counselors, social workers, and other community and social service specialists | 1 | 1 |
Miscellaneous community and social service specialists | 1 | 1 |
Social and human service assistants | 1 | 1 |
Healthcare support occupations | 3 | 2 |
Building and grounds cleaning and maintenance occupations | 8 | 6 |
Building cleaning and pest control workers | 3 | 2 |
Grounds maintenance workers | 5 | 3 |
Grounds maintenance workers | 5 | 3 |
Sales and related occupations | 5 | 3 |
Retail sales workers | 3 | 2 |
Farming, fishing, and forestry occupations | 6 | 4 |
Supervisors of farming, fishing, and forestry workers | 1 | 1 |
First-line supervisors of farming, fishing, and forestry workers | 1 | 1 |
First-line supervisors of farming, fishing, and forestry workers | 1 | 1 |
Agricultural workers | 5 | 3 |
Miscellaneous agricultural workers | 5 | 3 |
Construction and extraction occupations | 31 | 21 |
Construction trades workers | 25 | 17 |
Carpenters | 5 | 3 |
Carpenters | 5 | 3 |
Construction laborers | 5 | 3 |
Construction laborers | 5 | 3 |
Construction equipment operators | 5 | 3 |
Operating engineers and other construction equipment operators | 5 | 3 |
Painters and paperhangers | 3 | 2 |
Painters, construction and maintenance | 3 | 2 |
Roofers | 3 | 2 |
Roofers | 3 | 2 |
Installation, maintenance, and repair occupations | 8 | 6 |
Production occupations | 7 | 5 |
Other production occupations | 3 | 2 |
Transportation and material moving occupations | 55 | 38 |
Air transportation workers | 1 | 1 |
Aircraft pilots and flight engineers | 1 | 1 |
Commercial pilots | 1 | 1 |
Motor vehicle operators | 45 | 31 |
Driver/sales workers and truck drivers | 38 | 26 |
Heavy and tractor-trailer truck drivers | 30 | 21 |
Passenger vehicle drivers | 7 | 5 |
Taxi drivers | 3 | 2 |
Rail transportation workers | 2 | 1 |
Water transportation workers | 2 | 1 |
Sailors and marine oilers | 2 | 1 |
Sailors and marine oilers | 2 | 1 |
Material moving workers | 5 | 3 |
Laborers and material movers | 5 | 3 |
Stockers and order fillers | 3 | 2 |
Footnotes: | ||
NOTE: Data for all years are revised and final. Totals for major categories may include subcategories not shown separately. Dashes indicate no data reported or data that do not meet publication criteria. CFOI fatal injury counts exclude illness-related deaths unless precipitated by an injury event. | ||
| Demographic | Number | Percentage (%) |
|---|---|---|
Total | 145 | 100 |
Employee status | ||
Wage and salary workers (1) | 121 | 83 |
Self-employed (2) | 24 | 17 |
Sex | ||
Male | 129 | 89 |
Female | 16 | 11 |
Age (3) | ||
Under 16 years | -- | -- |
16 to 17 years | -- | -- |
18 to 19 years | -- | -- |
20 to 24 years | -- | -- |
25 to 34 years | 28 | 19 |
35 to 44 years | 25 | 17 |
45 to 54 years | 27 | 19 |
55 to 64 years | 38 | 26 |
65 years and over | 17 | 12 |
Race or ethnic origin (4) | ||
White, non-Hispanic | 95 | 66 |
Black or African-American, non-Hispanic | -- | -- |
Hispanic or Latino | 27 | 19 |
American Indian or Alaska Native, non-Hispanic | -- | -- |
Asian, non-Hispanic | -- | -- |
Native Hawaiian or Pacific Islander, non-Hispanic | -- | -- |
Footnotes: | ||
NOTE: Data for all years are revised and final. Totals for major categories may include subcategories not shown separately. Dashes indicate no data reported or data that do not meet publication criteria. CFOI fatal injury counts exclude illness-related deaths unless precipitated by an injury event. | ||
Last Modified Date: Thursday, March 27, 2025