An official website of the United States government
An official website of the United States government
The .gov means it's official.
Federal government websites often end in .gov or .mil. Before sharing sensitive information,
make sure you're on a federal government site.
The site is secure.
The
https:// ensures that you are connecting to the official website and that any
information you provide is encrypted and transmitted securely.
25-126-CHI
Thursday, March 27, 2025
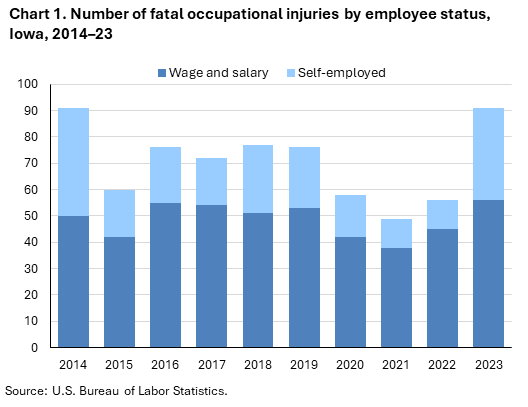
Fatal work injuries totaled 91 in 2023 for Iowa, the U.S. Bureau of Labor Statistics reported today. Acting Regional Commissioner Julie Wilson noted that the number of work-related fatalities in Iowa was up from the previous year. (See chart 1.) Fatal occupational injuries in the state have ranged from a high of 110 in 1992 to a low of 49 in 2021. Nationwide, a total of 5,283 fatal work injuries were recorded in 2023, a 3.7-percent decrease from 5,486 in 2022, according to the results from the Census of Fatal Occupational Injuries (CFOI).
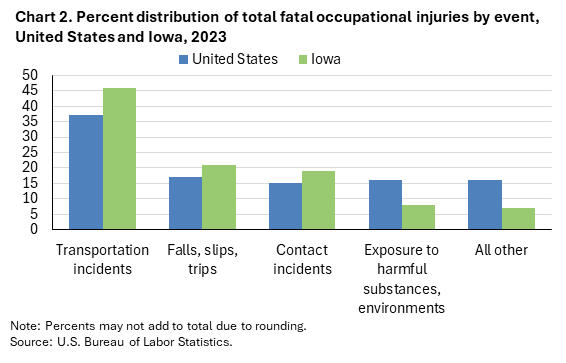
Transportation incidents (42) were the most frequent type of fatal event in Iowa, accounting for 46 percent of all fatal work injuries in the state. Nationally the share was 37 percent. (See chart 2 and table 1.)
Falls, slips, trips (19) accounted for 21 percent of Iowa workplace fatalities; nationally the share was 17 percent.
The agriculture, forestry, fishing and hunting sector had the highest number of fatalities with 26. (See table 2.)
Transportation incidents resulted in 12 of the 26 agriculture, forestry, fishing and hunting sector fatalities.
The oilseed and grain farming industry group accounted for 12 of the sector’s fatal workplace injuries.
The management occupational group had the highest number of fatal workplace injuries with 28. (See table 3.)
Transportation incidents resulted in 11 management fatalities.
Wage and salary workers accounted for 62 percent of workplace fatalities in Iowa; the self-employed comprised the remaining 38 percent. (See chart 1 and table 4.) Nationally, wage and salary workers comprised 83 percent of fatalities.
Males accounted for 92 percent of the work-related fatalities in Iowa and 91 percent nationally.
Workers 25-54 years old accounted for 37 percent of the state’s work-related fatalities, compared to 57 percent of on-the-job fatalities nationally. Workers 55 years and older accounted for 58 percent of the state’s work-related fatalities in 2023, compared to 35 percent of on-the-job fatalities nationally.
The 2022 North American Industry Classification System (NAICS) and the updated Occupational Injury and Illness Classification System (OIICS) were implemented with the release of 2023 data. As a result of these changes, comparisons between 2023 CFOI data and previous years should be made with caution. Refer to the national release technical note for more information.
Background of the program. The Census of Fatal Occupational Injuries (CFOI), part of the Bureau of Labor Statistics (BLS) Occupational Safety and Health Statistics (OSHS) program, is a count of all fatalities resulting from workplace injuries occurring in the U.S. during the calendar year. For technical information and definitions for the CFOI, see the national CFOI release Technical notes, the BLS Handbook of Methods, and the CFOI definitions.
Acknowledgments. BLS thanks the Iowa Division of Labor for their efforts in collecting accurate, comprehensive, and useful data on fatal work injuries. BLS also appreciates the efforts of all federal, state, local, and private sector entities that provided source documents used to identify fatal work injuries nationally. See the national CFOI release Technical Notes for details on cooperating entities.
Information in this release will be made available to individuals with sensory impairments upon request. Voice phone: (202) 691-5200; Telecommunications Relay Service: 7-1-1.
| Event or Exposure (1) | Number | Percent (%) |
|---|---|---|
All events and exposures | 91 | 100 |
Violent acts | -- | -- |
Transportation incidents | 42 | 46 |
Pedestrian incidents involving motorized land vehicles | 9 | 10 |
Pedestrian struck by vehicle in nonroadway area | 4 | 4 |
Pedestrian struck by forward-moving vehicle in nonroadway area | 1 | 1 |
Roadway incidents involving motorized land vehicle | 24 | 26 |
Roadway collision with other vehicle(s) | 13 | 14 |
Roadway collision with other vehicle(s)-intersecting, turning | 3 | 3 |
Roadway collision with other vehicle(s)-moving in same direction | 4 | 4 |
Roadway collision with other vehicle(s)-moving in opposite directions, oncoming | 5 | 5 |
Roadway collision with object other than vehicle | 5 | 5 |
Collision with object or animal on side of roadway | 4 | 4 |
Roadway noncollision incident | 6 | 7 |
Explosions and fires | 1 | 1 |
Explosions | 1 | 1 |
Falls, slips, trips | 19 | 21 |
Fall to lower level | 16 | 18 |
Other fall to lower level | 14 | 15 |
Other fall to lower level- less than 6 feet | 3 | 3 |
Other fall to lower level- 6 to 30 feet | 5 | 5 |
Exposure to harmful substances, environments | 7 | 8 |
Contact incidents | 17 | 19 |
Collapse, engulfment | 4 | 4 |
Collapse, engulfment- loose materials or liquids | 4 | 4 |
Struck by propelled, falling, or suspended object | 8 | 9 |
Struck by falling object | 8 | 9 |
Struck by object tipping over | 1 | 1 |
Struck, caught, or compressed by running powered equipment | 5 | 5 |
Struck by rolling powered vehicle or machinery | 3 | 3 |
Footnotes: | ||
NOTE: Data for all years are revised and final. Totals for major categories may include subcategories not shown separately. Dashes indicate no data reported or data that do not meet publication criteria. CFOI fatal injury counts exclude illness-related deaths unless precipitated by an injury event. | ||
| Industry | Number | Percentage (%) |
|---|---|---|
Total | 91 | 100 |
Private industry (1) | 85 | 93 |
Natural resources and mining | 26 | 29 |
Agriculture, forestry, fishing and hunting | 26 | 29 |
Crop production | 22 | 24 |
Oilseed and grain farming | 12 | 13 |
Dry pea and bean farming | 1 | 1 |
Corn farming | 6 | 7 |
Animal production and aquaculture | 4 | 4 |
Construction | 15 | 16 |
Construction | 15 | 16 |
Specialty trade contractors | 8 | 9 |
Foundation, structure, and building exterior contractors | 6 | 7 |
Poured concrete foundation and structure contractors | 1 | 1 |
Nonresidential poured concrete foundation and structure contractors | 1 | 1 |
Manufacturing | 6 | 7 |
Manufacturing | 6 | 7 |
Food manufacturing | 1 | 1 |
Other food manufacturing | 1 | 1 |
All other food manufacturing | 1 | 1 |
Chemical manufacturing | 1 | 1 |
Pesticide, fertilizer, and other agricultural chemical manufacturing | 1 | 1 |
Trade, transportation, and utilities | -- | -- |
Retail trade | 3 | 3 |
Transportation and warehousing | 19 | 21 |
Truck transportation | 16 | 18 |
General freight trucking | 15 | 16 |
General freight trucking, local | 4 | 4 |
General freight trucking, long-distance | 8 | 9 |
Information | -- | -- |
Financial activities | -- | -- |
Professional and business services | 4 | 4 |
Administrative and support and waste management and remediation services | 4 | 4 |
Educational and health services | 3 | 3 |
Health care and social assistance | 3 | 3 |
Leisure and hospitality | -- | -- |
Arts, entertainment, and recreation | 1 | 1 |
Performing arts, spectator sports, and related industries | 1 | 1 |
Spectator sports | 1 | 1 |
Spectator sports | 1 | 1 |
Other services (except public administration) | 5 | 5 |
Other services (except public administration) | 5 | 5 |
Government (2) | 6 | 7 |
Federal government | -- | -- |
State government | 1 | 1 |
Local government | 5 | 5 |
Footnotes: | ||
NOTE: Data for all years are revised and final. Totals for major categories may include subcategories not shown separately. Dashes indicate no data reported or data that do not meet publication criteria. CFOI fatal injury counts exclude illness-related deaths unless precipitated by an injury event. | ||
| Occupation (1) | Number | Percentage (%) |
|---|---|---|
All occupations | 91 | 100 |
Management occupations | 28 | 31 |
Operations specialties managers | 3 | 3 |
Other management occupations | 25 | 27 |
Business and financial operations occupations | -- | -- |
Computer and mathematical occupations | -- | -- |
Architecture and engineering occupations | -- | -- |
Life, physical, and social science occupations | -- | -- |
Community and social service occupations | -- | -- |
Legal occupations | -- | -- |
Educational instruction and library occupations | -- | -- |
Arts, design, entertainment, sports, and media occupations | 1 | 1 |
Entertainers and performers, sports and related workers | 1 | 1 |
Athletes, coaches, umpires, and related workers | 1 | 1 |
Athletes and sports competitors | 1 | 1 |
Healthcare practitioners and technical occupations | 1 | 1 |
Healthcare diagnosing or treating practitioners | 1 | 1 |
Healthcare support occupations | -- | -- |
Protective service occupations | -- | -- |
Food preparation and serving related occupations | -- | -- |
Building and grounds cleaning and maintenance occupations | 3 | 3 |
Personal care and service occupations | -- | -- |
Sales and related occupations | -- | -- |
Office and administrative support occupations | -- | -- |
Farming, fishing, and forestry occupations | 2 | 2 |
Agricultural workers | 2 | 2 |
Miscellaneous agricultural workers | 2 | 2 |
Farmworkers and laborers, crop, nursery, and greenhouse | 2 | 2 |
Construction and extraction occupations | 13 | 14 |
Installation, maintenance, and repair occupations | 5 | 5 |
Production occupations | 5 | 5 |
Supervisors of production workers | 4 | 4 |
First-line supervisors of production and operating workers | 4 | 4 |
First-line supervisors of production and operating workers | 4 | 4 |
Food processing workers | 1 | 1 |
Butchers and other meat, poultry, and fish processing workers | 1 | 1 |
Transportation and material moving occupations | 23 | 25 |
Footnotes: | ||
NOTE: Data for all years are revised and final. Totals for major categories may include subcategories not shown separately. Dashes indicate no data reported or data that do not meet publication criteria. CFOI fatal injury counts exclude illness-related deaths unless precipitated by an injury event. | ||
| Demographic | Number | Percentage (%) |
|---|---|---|
Total | 91 | 100 |
Employee status | ||
Wage and salary workers (1) | 56 | 62 |
Self-employed (2) | 35 | 38 |
Sex | ||
Male | 84 | 92 |
Female | 7 | 8 |
Age (3) | ||
Under 16 years | -- | -- |
16 to 17 years | -- | -- |
18 to 19 years | -- | -- |
20 to 24 years | -- | -- |
25 to 34 years | 10 | 11 |
35 to 44 years | 12 | 13 |
45 to 54 years | 12 | 13 |
55 to 64 years | 22 | 24 |
65 years and over | 31 | 34 |
Footnotes: | ||
NOTE: Data for all years are revised and final. Totals for major categories may include subcategories not shown separately. Dashes indicate no data reported or data that do not meet publication criteria. CFOI fatal injury counts exclude illness-related deaths unless precipitated by an injury event. | ||
Last Modified Date: Thursday, March 27, 2025