An official website of the United States government
An official website of the United States government
The .gov means it's official.
Federal government websites often end in .gov or .mil. Before sharing sensitive information,
make sure you're on a federal government site.
The site is secure.
The
https:// ensures that you are connecting to the official website and that any
information you provide is encrypted and transmitted securely.
25-117-CHI
Thursday, March 27, 2025
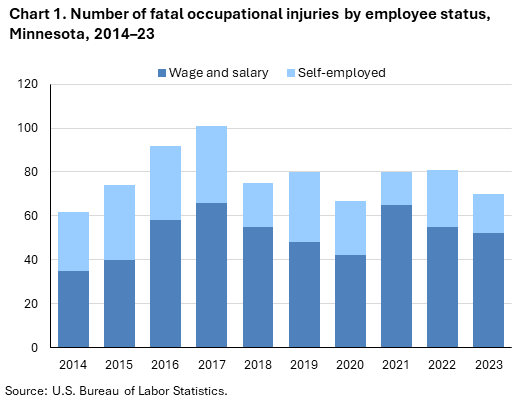
Fatal work injuries totaled 70 in 2023 for Minnesota, the U.S. Bureau of Labor Statistics reported today. Acting Regional Commissioner Julie Wilson noted that the number of work-related fatalities in Minnesota was down from the previous year. (See chart 1.) Fatal occupational injuries in the state have ranged from a high of 113 in 1993 to a low of 60 in 2011. Nationwide, a total of 5,283 fatal work injuries were recorded in 2023, a 3.7-percent decrease from 5,486 in 2022, according to the results from the Census of Fatal Occupational Injuries (CFOI).
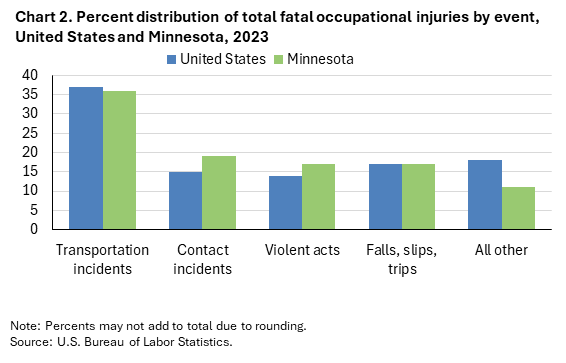
Transportation incidents (25) were the most frequent type of fatal event in Minnesota, accounting for 36 percent of all fatal work injuries in the state. Nationally the share was 37 percent. (See chart 2 and table 1.)
Contact incidents (13) accounted for 19 percent of Minnesota workplace fatalities; nationally the share was 15 percent.
The agriculture, forestry, fishing and hunting sector had the highest number of fatalities with 16. (See table 2.)
Transportation incidents resulted in 7 of the sector’s 16 fatalities.
The crop production subsector accounted for 10 of the sector’s fatal workplace injuries.
The transportation and material moving occupational group had the highest number of fatal workplace injuries with 19. (See table 3.)
Transportation incidents resulted in 16 of the transportation and material moving fatalities.
Motor vehicle operators accounted for 15 of the major group’s fatal workplace injuries.
Wage and salary workers accounted for 74 percent of workplace fatalities in Minnesota; the self-employed comprised the remaining 26 percent. (See chart 1 and table 4.) Nationally, wage and salary workers comprised 83 percent of fatalities.
Males accounted for 96 percent of the work-related fatalities in Minnesota, compared to the 91-percent national share.
Workers 55 years and older accounted for 51 percent of the state’s work-related fatalities in 2023, compared to 35 percent of on-the-job fatalities nationally.
White non-Hispanics accounted for 87 percent of those who died from a workplace injury. Nationwide, this group accounted for 56 percent of work-related deaths.
The 2022 North American Industry Classification System (NAICS) and the updated Occupational Injury and Illness Classification System (OIICS) were implemented with the release of 2023 data. As a result of these changes, comparisons between 2023 CFOI data and previous years should be made with caution. Refer to the national release technical note for more information.
Background of the program. The Census of Fatal Occupational Injuries (CFOI), part of the Bureau of Labor Statistics (BLS) Occupational Safety and Health Statistics (OSHS) program, is a count of all fatalities resulting from workplace injuries occurring in the U.S. during the calendar year. For technical information and definitions for the CFOI, see the national CFOI release Technical notes, the BLS Handbook of Methods, and the CFOI definitions.
Acknowledgments. BLS thanks the Minnesota Department of Labor and Industry for their efforts in collecting accurate, comprehensive, and useful data on fatal work injuries. BLS also appreciates the efforts of all federal, state, local, and private sector entities that provided source documents used to identify fatal work injuries nationally. See the national CFOI release Technical Notes for details on cooperating entities.
Information in this release will be made available to individuals with sensory impairments upon request. Voice phone: (202) 691-5200; Telecommunications Relay Service: 7-1-1.
| Event or Exposure (1) | Number | Percent (%) |
|---|---|---|
All events and exposures | 70 | 100 |
Violent acts | 12 | 17 |
Homicides (violent acts by other person) | 7 | 10 |
Shooting by other person | 5 | 7 |
Hitting, kicking, beating by other person | 1 | 1 |
Multiple violent acts by other person | 1 | 1 |
Suicides (intentional self-harm) | 5 | 7 |
Transportation incidents | 25 | 36 |
Non-motorized transport incidents | 1 | 1 |
Animal transportation incidents | 1 | 1 |
Roadway incidents involving motorized land vehicle | 16 | 23 |
Roadway collision with other vehicle(s) | 8 | 11 |
Roadway collision with other vehicle(s)-intersecting, turning | 6 | 9 |
Nonroadway incidents involving motorized land vehicles | 4 | 6 |
Explosions and fires | -- | -- |
Falls, slips, trips | 12 | 17 |
Exposure to harmful substances, environments | -- | -- |
Contact incidents | 13 | 19 |
Contact with animals | 1 | 1 |
Collapse, engulfment | 1 | 1 |
Collapse, engulfment- loose materials or liquids | 1 | 1 |
Struck by propelled, falling, or suspended object | 4 | 6 |
Struck, caught, or compressed by running powered equipment | 6 | 9 |
Struck by running powered equipment- during maintenance, cleaning, testing | 1 | 1 |
Caught or entangled in running powered equipment | 1 | 1 |
Compressed between running equipment and other object(s) | 1 | 1 |
Struck by rolling powered vehicle or machinery | 3 | 4 |
Footnotes: | ||
NOTE: Data for all years are revised and final. Totals for major categories may include subcategories not shown separately. Dashes indicate no data reported or data that do not meet publication criteria. CFOI fatal injury counts exclude illness-related deaths unless precipitated by an injury event. | ||
| Industry | Number | Percentage (%) |
|---|---|---|
Total | 70 | 100 |
Private industry (1) | 67 | 96 |
Natural resources and mining | 16 | 23 |
Agriculture, forestry, fishing and hunting | 16 | 23 |
Crop production | 10 | 14 |
Support activities for agriculture and forestry | 3 | 4 |
Construction | 13 | 19 |
Construction | 13 | 19 |
Specialty trade contractors | 9 | 13 |
Foundation, structure, and building exterior contractors | 4 | 6 |
Roofing contractors | 4 | 6 |
Nonresidential roofing contractors | 1 | 1 |
Building finishing contractors | 3 | 4 |
Manufacturing | 7 | 10 |
Manufacturing | 7 | 10 |
Food manufacturing | 2 | 3 |
Animal food manufacturing | 1 | 1 |
Animal food manufacturing | 1 | 1 |
Fruit and vegetable preserving and specialty food manufacturing | 1 | 1 |
Paper manufacturing | 1 | 1 |
Pulp, paper, and paperboard mills | 1 | 1 |
Paper mills | 1 | 1 |
Nonmetallic mineral product manufacturing | 1 | 1 |
Cement and concrete product manufacturing | 1 | 1 |
Ready-mix concrete manufacturing | 1 | 1 |
Furniture and related product manufacturing | 1 | 1 |
Trade, transportation, and utilities | 18 | 26 |
Wholesale trade | 2 | 3 |
Merchant wholesalers, durable goods | 2 | 3 |
Household appliances and electrical and electronic goods merchant wholesalers | 1 | 1 |
Machinery, equipment, and supplies merchant wholesalers | 1 | 1 |
Farm and garden machinery and equipment merchant wholesalers | 1 | 1 |
Retail trade | 6 | 9 |
Food and beverage retailers | 1 | 1 |
Grocery and convenience retailers | 1 | 1 |
Supermarkets and other grocery retailers (except convenience retailers) | 1 | 1 |
Transportation and warehousing | 10 | 14 |
Information | -- | -- |
Financial activities | 2 | 3 |
Real estate and rental and leasing | 2 | 3 |
Rental and leasing services | 2 | 3 |
Commercial and industrial machinery and equipment rental and leasing | 2 | 3 |
Construction, transportation, mining, and forestry machinery and equipment rental and leasing | 1 | 1 |
Other commercial and industrial machinery and equipment rental and leasing | 1 | 1 |
Professional and business services | 3 | 4 |
Administrative and support and waste management and remediation services | 3 | 4 |
Educational and health services | -- | -- |
Leisure and hospitality | -- | -- |
Accommodation and food services | 3 | 4 |
Food services and drinking places | 3 | 4 |
Restaurants and other eating places | 1 | 1 |
Restaurants and other eating places | 1 | 1 |
Full-service restaurants | 1 | 1 |
Other services (except public administration) | -- | -- |
Government (2) | 3 | 4 |
Federal government | -- | -- |
State government | 1 | 1 |
Local government | -- | -- |
Footnotes: | ||
NOTE: Data for all years are revised and final. Totals for major categories may include subcategories not shown separately. Dashes indicate no data reported or data that do not meet publication criteria. CFOI fatal injury counts exclude illness-related deaths unless precipitated by an injury event. | ||
| Occupation (1) | Number | Percentage (%) |
|---|---|---|
All occupations | 70 | 100 |
Management occupations | 7 | 10 |
Other management occupations | 6 | 9 |
Farmers, ranchers, and other agricultural managers | 6 | 9 |
Farmers, ranchers, and other agricultural managers | 6 | 9 |
Business and financial operations occupations | -- | -- |
Computer and mathematical occupations | 1 | 1 |
Computer occupations | 1 | 1 |
Computer support specialists | 1 | 1 |
Architecture and engineering occupations | -- | -- |
Life, physical, and social science occupations | -- | -- |
Community and social service occupations | -- | -- |
Legal occupations | -- | -- |
Educational instruction and library occupations | -- | -- |
Arts, design, entertainment, sports, and media occupations | 1 | 1 |
Entertainers and performers, sports and related workers | 1 | 1 |
Healthcare practitioners and technical occupations | -- | -- |
Healthcare support occupations | -- | -- |
Protective service occupations | -- | -- |
Food preparation and serving related occupations | 3 | 4 |
Supervisors of food preparation and serving workers | 1 | 1 |
Supervisors of food preparation and serving workers | 1 | 1 |
Chefs and head cooks | 1 | 1 |
Building and grounds cleaning and maintenance occupations | 3 | 4 |
Personal care and service occupations | -- | -- |
Sales and related occupations | 5 | 7 |
Retail sales workers | 3 | 4 |
Retail salespersons | 3 | 4 |
Retail salespersons | 3 | 4 |
Office and administrative support occupations | -- | -- |
Farming, fishing, and forestry occupations | 7 | 10 |
Construction and extraction occupations | 12 | 17 |
Construction trades workers | 7 | 10 |
Carpenters | 1 | 1 |
Carpenters | 1 | 1 |
Roofers | 3 | 4 |
Roofers | 3 | 4 |
Installation, maintenance, and repair occupations | -- | -- |
Production occupations | 6 | 9 |
Transportation and material moving occupations | 19 | 27 |
Motor vehicle operators | 15 | 21 |
Footnotes: | ||
NOTE: Data for all years are revised and final. Totals for major categories may include subcategories not shown separately. Dashes indicate no data reported or data that do not meet publication criteria. CFOI fatal injury counts exclude illness-related deaths unless precipitated by an injury event. | ||
| Demographic | Number | Percentage (%) |
|---|---|---|
Total | 70 | 100 |
Employee status | ||
Wage and salary workers (1) | 52 | 74 |
Self-employed (2) | 18 | 26 |
Sex | ||
Male | 67 | 96 |
Female | 3 | 4 |
Age (3) | ||
Under 16 years | -- | -- |
16 to 17 years | -- | -- |
18 to 19 years | -- | -- |
20 to 24 years | -- | -- |
25 to 34 years | 12 | 17 |
35 to 44 years | 11 | 16 |
45 to 54 years | -- | -- |
55 to 64 years | 23 | 33 |
65 years and over | 13 | 19 |
Race or ethnic origin (4) | ||
White, non-Hispanic | 61 | 87 |
Black or African-American, non-Hispanic | -- | -- |
Hispanic or Latino | 3 | 4 |
American Indian or Alaska Native, non-Hispanic | -- | -- |
Asian, non-Hispanic | -- | -- |
Native Hawaiian or Pacific Islander, non-Hispanic | -- | -- |
Footnotes: | ||
NOTE: Data for all years are revised and final. Totals for major categories may include subcategories not shown separately. Dashes indicate no data reported or data that do not meet publication criteria. CFOI fatal injury counts exclude illness-related deaths unless precipitated by an injury event. | ||
Last Modified Date: Thursday, March 27, 2025