An official website of the United States government
An official website of the United States government
The .gov means it's official.
Federal government websites often end in .gov or .mil. Before sharing sensitive information,
make sure you're on a federal government site.
The site is secure.
The
https:// ensures that you are connecting to the official website and that any
information you provide is encrypted and transmitted securely.
25-114-CHI
Friday, March 28, 2025
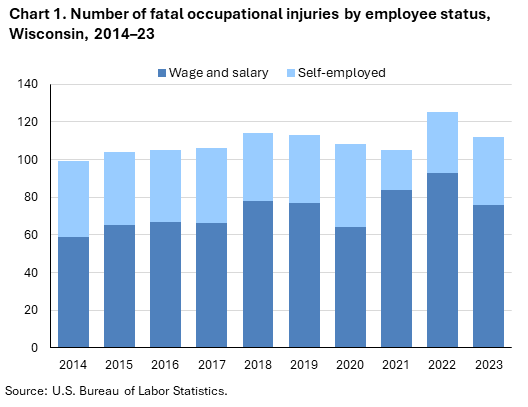
Fatal work injuries totaled 112 in 2023 for Wisconsin, the U.S. Bureau of Labor Statistics reported today. Acting Regional Commissioner Julie Wilson noted that the number of work-related fatalities in Wisconsin was down from the previous year. (See chart 1.) Fatal occupational injuries in the state have ranged from a high of 138 in 1993 to a low of 77 in 2008. Nationwide, a total of 5,283 fatal work injuries were recorded in 2023, a 3.7-percent decrease from 5,486 in 2022, according to the results from the Census of Fatal Occupational Injuries (CFOI).
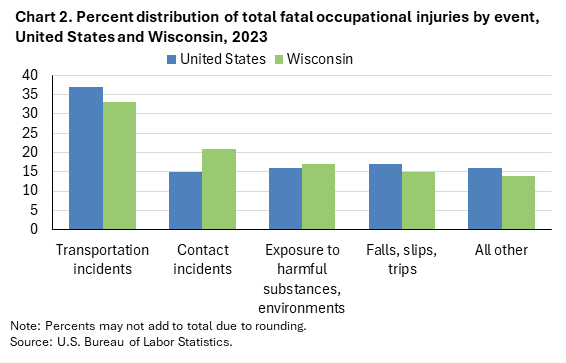
Transportation incidents (37) were the most frequent type of fatal event in Wisconsin, accounting for 33 percent of all fatal work injuries in the state. Nationally the share was 37 percent. (See chart 2 and table 1.)
Contact incidents (23) accounted for 21 percent of Wisconsin fatal work injuries; nationally the share was 15 percent.
The agriculture, forestry, fishing and hunting sector reported 19 fatal work injuries. (See table 2.) Transportation incidents resulted in 9 of the 19 sector fatalities, followed by contact incidents with 8 fatalities. The cattle ranching and farming industry group accounted for eight of the sector’s fatal workplace injuries.
The transportation and warehousing sector also had 19 workplace fatalities. (See table 2.) The general freight trucking industry group accounted for eight of the sector’s fatal workplace injuries.
The transportation and material moving occupational group had the highest number of fatal workplace injuries with 26. (See table 3.)
Transportation incidents resulted in 15 of the transportation and material moving fatalities.
Motor vehicle operators accounted for 21 of the major group’s fatal workplace injuries.
Wage and salary workers accounted for 68 percent of fatal workplace injuries in Wisconsin; the self-employed comprised the remaining 32 percent. (See chart 1 and table 4.) Nationally, wage and salary workers comprised 83 percent of fatalities.
Males accounted for 88 percent of the work-related fatalities in Wisconsin; nationally, males comprised 91 percent of fatalities.
Workers 25-54 years old accounted for 50 percent of the state’s work-related fatalities, compared to 57 percent of on-the-job fatalities nationally. Workers 55 years and older accounted for 42 percent of the state’s work-related fatalities in 2023, compared to 35 percent of on-the-job fatalities nationally.
White non-Hispanics accounted for 85 percent of those who died from a workplace injury. Nationwide, this group accounted for 56 percent of work-related deaths.
The 2022 North American Industry Classification System (NAICS) and the updated Occupational Injury and Illness Classification System (OIICS) were implemented with the release of 2023 data. As a result of these changes, comparisons between 2023 CFOI data and previous years should be made with caution. Refer to the national release technical note for more information.
Background of the program. The Census of Fatal Occupational Injuries (CFOI), part of the Bureau of Labor Statistics (BLS) Occupational Safety and Health Statistics (OSHS) program, is a count of all fatalities resulting from workplace injuries occurring in the U.S. during the calendar year. For technical information and definitions for the CFOI, see the national CFOI release Technical notes, the BLS Handbook of Methods, and the CFOI definitions.
Acknowledgments. BLS thanks the Wisconsin State Laboratory of Hygiene for their efforts in collecting accurate, comprehensive, and useful data on fatal work injuries. BLS also appreciates the efforts of all federal, state, local, and private sector entities that provided source documents used to identify fatal work injuries nationally. See the national CFOI release Technical Notes for details on cooperating entities.
Information in this release will be made available to individuals with sensory impairments upon request. Voice phone: (202) 691-5200; Telecommunications Relay Service: 7-1-1.
| Event or Exposure (1) | Number | Percent (%) |
|---|---|---|
All events and exposures | 112 | 100 |
Violent acts | 15 | 13 |
Homicides (violent acts by other person) | 9 | 8 |
Suicides (intentional self-harm) | 6 | 5 |
Transportation incidents | 37 | 33 |
Pedestrian incidents involving motorized land vehicles | 6 | 5 |
Roadway incidents involving motorized land vehicle | 21 | 19 |
Roadway collision with other vehicle(s) | 9 | 8 |
Roadway collision with object other than vehicle | 6 | 5 |
Collision with object or animal on side of roadway | 4 | 4 |
Roadway noncollision incident | 6 | 5 |
Roadway noncollision- vehicle overturn | 4 | 4 |
Nonroadway incidents involving motorized land vehicles | 7 | 6 |
Nonroadway collision with object other than vehicle | 1 | 1 |
Collision with stationary object, nonroadway | 1 | 1 |
Nonroadway noncollision incident | 6 | 5 |
Falls, slips, trips | 17 | 15 |
Fall to lower level | 13 | 12 |
Other fall to lower level | 11 | 10 |
Other fall to lower level- 6 to 30 feet | 7 | 6 |
Slip, trip, stumble or fall on same level | 4 | 4 |
Fall on same level | 4 | 4 |
Exposure to harmful substances, environments | 19 | 17 |
Exposure to harmful substances | 13 | 12 |
Contact incidents | 23 | 21 |
Struck by propelled, falling, or suspended object | 13 | 12 |
Struck by falling object | 7 | 6 |
Struck by object tipping over | 3 | 3 |
Struck, caught, or compressed by running powered equipment | 7 | 6 |
Caught or entangled in running powered equipment | 4 | 4 |
Footnotes: | ||
NOTE: Data for all years are revised and final. Totals for major categories may include subcategories not shown separately. Dashes indicate no data reported or data that do not meet publication criteria. CFOI fatal injury counts exclude illness-related deaths unless precipitated by an injury event. | ||
| Industry | Number | Percentage (%) |
|---|---|---|
Total | 112 | 100 |
Private industry (1) | 101 | 90 |
Natural resources and mining | -- | -- |
Agriculture, forestry, fishing and hunting | 19 | 17 |
Crop production | 5 | 4 |
Animal production and aquaculture | 9 | 8 |
Cattle ranching and farming | 8 | 7 |
Beef cattle ranching and farming, including feedlots | 3 | 3 |
Beef cattle ranching and farming | 3 | 3 |
Dairy cattle and milk production | 5 | 4 |
Sheep and goat farming | 1 | 1 |
Construction | 13 | 12 |
Construction | 13 | 12 |
Construction of buildings | 4 | 4 |
Heavy and civil engineering construction | 1 | 1 |
Utility system construction | 1 | 1 |
Water and sewer line and related structures construction | 1 | 1 |
Specialty trade contractors | 7 | 6 |
Foundation, structure, and building exterior contractors | 3 | 3 |
Other specialty trade contractors | 1 | 1 |
All other specialty trade contractors | 1 | 1 |
All other residential specialty trade contractors | 1 | 1 |
Manufacturing | 17 | 15 |
Manufacturing | 17 | 15 |
Wood product manufacturing | 3 | 3 |
Paper manufacturing | 3 | 3 |
Nonmetallic mineral product manufacturing | 2 | 2 |
Cement and concrete product manufacturing | 1 | 1 |
Ready-mix concrete manufacturing | 1 | 1 |
Other nonmetallic mineral product manufacturing | 1 | 1 |
Abrasive product manufacturing | 1 | 1 |
Fabricated metal product manufacturing | 4 | 4 |
Transportation equipment manufacturing | 1 | 1 |
Motor vehicle body and trailer manufacturing | 1 | 1 |
Motor vehicle body and trailer manufacturing | 1 | 1 |
Trade, transportation, and utilities | -- | -- |
Wholesale trade | 3 | 3 |
Merchant wholesalers, durable goods | 3 | 3 |
Machinery, equipment, and supplies merchant wholesalers | 3 | 3 |
Retail trade | 4 | 4 |
Transportation and warehousing | 19 | 17 |
Truck transportation | 13 | 12 |
General freight trucking | 8 | 7 |
General freight trucking, long-distance | 5 | 4 |
General freight trucking, long-distance, truckload | 4 | 4 |
Specialized freight trucking | 5 | 4 |
Information | -- | -- |
Financial activities | -- | -- |
Professional and business services | 6 | 5 |
Professional, scientific, and technical services | 2 | 2 |
Professional, scientific, and technical services | 2 | 2 |
Architectural, engineering, and related services | 1 | 1 |
Engineering services | 1 | 1 |
Advertising, public relations, and related services | 1 | 1 |
Advertising agencies | 1 | 1 |
Administrative and support and waste management and remediation services | 4 | 4 |
Educational and health services | 5 | 4 |
Educational services | 1 | 1 |
Educational services | 1 | 1 |
Colleges, universities, and professional schools | 1 | 1 |
Colleges, universities, and professional schools | 1 | 1 |
Health care and social assistance | 4 | 4 |
Leisure and hospitality | -- | -- |
Accommodation and food services | 5 | 4 |
Food services and drinking places | 5 | 4 |
Other services (except public administration) | -- | -- |
Government (2) | 11 | 10 |
Federal government | -- | -- |
State government | 3 | 3 |
Local government | 8 | 7 |
Footnotes: | ||
NOTE: Data for all years are revised and final. Totals for major categories may include subcategories not shown separately. Dashes indicate no data reported or data that do not meet publication criteria. CFOI fatal injury counts exclude illness-related deaths unless precipitated by an injury event. | ||
| Occupation (1) | Number | Percentage (%) |
|---|---|---|
All occupations | 112 | 100 |
Management occupations | 16 | 14 |
Other management occupations | 13 | 12 |
Farmers, ranchers, and other agricultural managers | 9 | 8 |
Farmers, ranchers, and other agricultural managers | 9 | 8 |
Miscellaneous managers | 4 | 4 |
Arts, design, entertainment, sports, and media occupations | 1 | 1 |
Entertainers and performers, sports and related workers | 1 | 1 |
Athletes, coaches, umpires, and related workers | 1 | 1 |
Food preparation and serving related occupations | 5 | 4 |
Supervisors of food preparation and serving workers | 3 | 3 |
Supervisors of food preparation and serving workers | 3 | 3 |
First-line supervisors of food preparation and serving workers | 3 | 3 |
Sales and related occupations | 3 | 3 |
Farming, fishing, and forestry occupations | 9 | 8 |
Agricultural workers | 6 | 5 |
Miscellaneous agricultural workers | 6 | 5 |
Forest, conservation, and logging workers | 3 | 3 |
Logging workers | 3 | 3 |
Fallers | 3 | 3 |
Construction and extraction occupations | 15 | 13 |
Construction trades workers | 7 | 6 |
Carpenters | 3 | 3 |
Carpenters | 3 | 3 |
Cement masons, concrete finishers, and terrazzo workers | 1 | 1 |
Cement masons and concrete finishers | 1 | 1 |
Installation, maintenance, and repair occupations | 11 | 10 |
Production occupations | 10 | 9 |
Metal workers and plastic workers | 3 | 3 |
Forming machine setters, operators, and tenders, metal and plastic | 1 | 1 |
Rolling machine setters, operators, and tenders, metal and plastic | 1 | 1 |
Other production occupations | 4 | 4 |
Transportation and material moving occupations | 26 | 23 |
Motor vehicle operators | 21 | 19 |
Footnotes: | ||
NOTE: Data for all years are revised and final. Totals for major categories may include subcategories not shown separately. Dashes indicate no data reported or data that do not meet publication criteria. CFOI fatal injury counts exclude illness-related deaths unless precipitated by an injury event. | ||
| Demographic | Number | Percentage (%) |
|---|---|---|
Total | 112 | 100 |
Employee status | ||
Wage and salary workers (1) | 76 | 68 |
Self-employed (2) | 36 | 32 |
Sex | ||
Male | 98 | 88 |
Female | 14 | 13 |
Age (3) | ||
Under 16 years | -- | -- |
16 to 17 years | -- | -- |
18 to 19 years | -- | -- |
20 to 24 years | 7 | 6 |
25 to 34 years | 17 | 15 |
35 to 44 years | 18 | 16 |
45 to 54 years | 21 | 19 |
55 to 64 years | 27 | 24 |
65 years and over | 20 | 18 |
Race or ethnic origin (4) | ||
White, non-Hispanic | 95 | 85 |
Black or African-American, non-Hispanic | 7 | 6 |
Hispanic or Latino | 7 | 6 |
American Indian or Alaska Native, non-Hispanic | -- | -- |
Asian, non-Hispanic | -- | -- |
Native Hawaiian or Pacific Islander, non-Hispanic | -- | -- |
Footnotes: | ||
NOTE: Data for all years are revised and final. Totals for major categories may include subcategories not shown separately. Dashes indicate no data reported or data that do not meet publication criteria. CFOI fatal injury counts exclude illness-related deaths unless precipitated by an injury event. | ||
Last Modified Date: Friday, March 28, 2025