An official website of the United States government
An official website of the United States government
The .gov means it's official.
Federal government websites often end in .gov or .mil. Before sharing sensitive information,
make sure you're on a federal government site.
The site is secure.
The
https:// ensures that you are connecting to the official website and that any
information you provide is encrypted and transmitted securely.
26-451-CHI
Friday, March 27, 2026
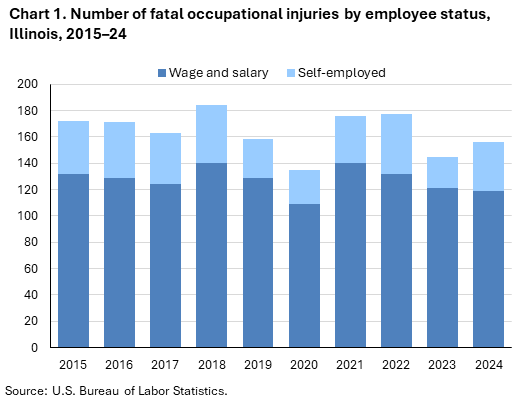
Fatal work injuries totaled 156 in 2024 for Illinois, the U.S. Bureau of Labor Statistics reported today. Assistant Commissioner for Regional Operations Michael Hirniak noted that the number of work-related fatalities in Illinois was up 7.6 percent from 145 in 2023. (See chart 1.) The fatal work injury rate was 2.7 fatalities per 100,000 full-time equivalent (FTE) workers in 2024, an increase from a rate of 2.5 in 2023. Nationwide, a total of 5,070 fatal work injuries were recorded in 2024, a 4.0-percent decrease from 5,283 in 2023. These data are from the Census of Fatal Occupational Injuries (CFOI).
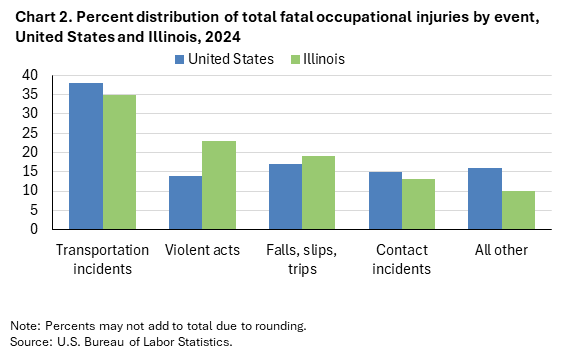
Transportation incidents (55) were the most frequent type of fatal event in Illinois, accounting for 35 percent of all fatal work injuries in the state. Nationally the share was 38 percent. (See chart 2 and table 1.)
Fatalities resulting from violent acts were up 50 percent over the year to 36 and accounted for 23 percent of Illinois worker fatalities; nationally the share was 14 percent.
The transportation and warehousing sector had the highest number of fatalities with 34, down from 40 the previous year. (See table 2.)
Transportation incidents resulted in 21 of the 34 transportation and warehousing sector fatalities.
The truck transportation subsector accounted for 25 of the sector’s fatal workplace injuries.
The transportation and material moving occupational group had the highest number of fatal workplace injuries with 47, down from 55 in 2023. (See table 3.)
Transportation incidents were the most frequent type of fatal event among transportation and material moving workers, resulting in 27 fatalities. Heavy and tractor-trailer truck drivers accounted for 34 of the major group’s 47 fatal workplace injuries.
Wage and salary workers accounted for 76 percent of fatal workplace injuries in Illinois; the self-employed comprised the remaining 24 percent. (See chart 1 and table 4.) Nationally, wage and salary workers comprised 82 percent of fatalities.
Males accounted for 140, or 90 percent, of the work-related fatalities in Illinois, up 11 from 2023. Transportation incidents resulted in 50 of these fatalities in 2024.
White non-Hispanics accounted for 66 percent of those who died from a workplace injury. Nationwide, this group accounted for 56 percent of work-related deaths.
Workers 65 years and older had an increase in worker fatalities from 17 in 2023 to 25 in 2024.
Background of the program. The Census of Fatal Occupational Injuries (CFOI), part of the Bureau of Labor Statistics (BLS) Occupational Safety and Health Statistics (OSHS) program, is a count of all fatalities resulting from workplace injuries occurring in the U.S. during the calendar year. For technical information and definitions for the CFOI, see the national CFOI release Technical notes, the BLS Handbook of Methods, and the CFOI definitions.
Acknowledgments. BLS thanks the Illinois Department of Public Health for their efforts in collecting accurate, comprehensive, and useful data on fatal work injuries. BLS also appreciates the efforts of all federal, state, local, and private sector entities that provided source documents used to identify fatal work injuries nationally. See the national CFOI release Technical Notes for details on cooperating entities.
If you are deaf, hard of hearing, or have a speech disability, please dial 7-1-1 to access telecommunications relay services.
| Event or Exposure (1) | 2023 | 2024 | |
|---|---|---|---|
| Number | Number | Percent (%) | |
All events and exposures | 145 | 156 | 100 |
Violent acts | 24 | 36 | 23 |
Homicides (violent acts by other person) | 18 | 29 | 19 |
Shooting by other person | 16 | 26 | 17 |
Stabbing, cutting, slashing by other person | 1 | 3 | 2 |
Suicides (intentional self-harm) | 6 | 7 | 4 |
Transportation incidents | 55 | 55 | 35 |
Pedestrian incidents involving motorized land vehicles | 8 | 11 | 7 |
Pedestrian struck by vehicle in nonroadway area | 3 | 6 | 4 |
Pedestrian struck by forward-moving vehicle in nonroadway area | -- | 3 | 2 |
Pedestrian struck by vehicle backing up in nonroadway area | 1 | 3 | 2 |
Roadway incidents involving motorized land vehicle | 37 | 39 | 25 |
Roadway collision with other vehicle(s) | 24 | 25 | 16 |
Roadway collision with other vehicle(s)-intersecting, turning | 9 | 10 | 6 |
Roadway collision with other vehicle(s)-moving in same direction | 3 | 5 | 3 |
Roadway collision with other vehicle(s)-moving in opposite directions, oncoming | 4 | 6 | 4 |
Roadway collision with other vehicle(s)-moving and standing vehicle | 6 | 4 | 3 |
Roadway collision with object other than vehicle | 6 | 5 | 3 |
Collision with object or animal on side of roadway | -- | 4 | 3 |
Roadway noncollision incident | 7 | 9 | 6 |
Roadway noncollision- vehicle overturn | 4 | 3 | 2 |
Roadway noncollision- jack-knifed or ran off road | -- | 6 | 4 |
Nonroadway incidents involving motorized land vehicles | 5 | 3 | 2 |
Nonroadway noncollision incident | 4 | 3 | 2 |
Nonroadway noncollision- vehicle overturn | -- | 3 | 2 |
Falls, slips, trips | 25 | 30 | 19 |
Fall to lower level | -- | 23 | 15 |
Other fall to lower level | -- | 18 | 12 |
Other fall to lower level- less than 6 feet | -- | 6 | 4 |
Other fall to lower level- 6 to 30 feet | -- | 5 | 3 |
Other fall to lower level- more than 30 feet | -- | 1 | 1 |
Slip, trip, stumble or fall on same level | -- | 7 | 4 |
Fall on same level | -- | 7 | 4 |
Fall on same level due to slip or trip | -- | 4 | 3 |
Exposure to harmful substances, environments | 13 | 11 | 7 |
Exposure to electricity | -- | 4 | 3 |
Exposure to harmful substances | 8 | 6 | 4 |
Drug, alcohol overdose | -- | 4 | 3 |
Exposure to oxygen deficiency | -- | 1 | 1 |
Drowning, submersion without other event | -- | 1 | 1 |
Contact incidents | 23 | 20 | 13 |
Struck, caught, or compressed by running powered equipment | 6 | 10 | 6 |
Compressed between running equipment and other object(s) | -- | 3 | 2 |
Struck by rolling powered vehicle or machinery | -- | 5 | 3 |
Footnotes: | |||
Note: The Census of Fatal Occupational Injuries (CFOI) has published data on fatal occupational injuries for the United States since 1992. During this time, the classification systems and definitions of many data elements have changed. See the CFOI Definitions page (www.bls.gov/iif/definitions/census-of-fatal-occupational-injuries-definitions.htm) for a more detailed description of each data element. Data for all years are revised and final. Totals for major categories may include subcategories not shown separately. Dashes indicate no data reported or data that do not meet publication criteria. CFOI fatal injury counts exclude illness-related deaths unless precipitated by an injury event. | |||
| Industry | 2023 | 2024 | |
|---|---|---|---|
| Number | Number | Percent (%) | |
Total | 145 | 156 | 100 |
Private industry (1) | 128 | 135 | 87 |
Natural resources and mining | 14 | 15 | 10 |
Agriculture, forestry, fishing and hunting | 11 | 15 | 10 |
Crop production | 7 | 13 | 8 |
Oilseed and grain farming | 4 | 7 | 4 |
Soybean farming | 2 | 2 | 1 |
Corn farming | 2 | 5 | 3 |
Other crop farming | -- | 1 | 1 |
All other crop farming | -- | 1 | 1 |
Animal production and aquaculture | -- | 2 | 1 |
Cattle ranching and farming | -- | 2 | 1 |
Beef cattle ranching and farming, including feedlots | -- | 1 | 1 |
Construction | 30 | 26 | 17 |
Construction | 30 | 26 | 17 |
Specialty trade contractors | 18 | 22 | 14 |
Foundation, structure, and building exterior contractors | 9 | 10 | 6 |
Poured concrete foundation and structure contractors | -- | 3 | 2 |
Roofing contractors | 4 | 3 | 2 |
Building equipment contractors | 4 | 5 | 3 |
Building finishing contractors | 3 | 4 | 3 |
Drywall and insulation contractors | -- | 1 | 1 |
Residential drywall and insulation contractors | -- | 1 | 1 |
Other specialty trade contractors | 2 | 2 | 1 |
Site preparation contractors | 1 | 2 | 1 |
Manufacturing | 9 | 11 | 7 |
Manufacturing | 9 | 11 | 7 |
Printing and related support activities | -- | 2 | 1 |
Printing and related support activities | -- | 2 | 1 |
Printing | -- | 2 | 1 |
Nonmetallic mineral product manufacturing | 2 | 1 | 1 |
Cement and concrete product manufacturing | 1 | 1 | 1 |
Ready-mix concrete manufacturing | -- | 1 | 1 |
Primary metal manufacturing | 1 | 1 | 1 |
Foundries | -- | 1 | 1 |
Fabricated metal product manufacturing | -- | 1 | 1 |
Machinery manufacturing | -- | 1 | 1 |
Agriculture, construction, and mining machinery manufacturing | -- | 1 | 1 |
Transportation equipment manufacturing | -- | 1 | 1 |
Aerospace product and parts manufacturing | -- | 1 | 1 |
Aerospace product and parts manufacturing | -- | 1 | 1 |
Other aircraft parts and auxiliary equipment manufacturing | -- | 1 | 1 |
Trade, transportation, and utilities | 53 | 46 | 29 |
Wholesale trade | 4 | 3 | 2 |
Retail trade | 9 | 9 | 6 |
Food and beverage retailers | 4 | 3 | 2 |
Grocery and convenience retailers | 3 | 1 | 1 |
Convenience retailers and vending machine operators | 1 | 1 | 1 |
Beer, wine, and liquor retailers | -- | 2 | 1 |
Beer, wine, and liquor retailers | -- | 2 | 1 |
General merchandise retailers | -- | 3 | 2 |
Department stores | -- | 1 | 1 |
Department stores | -- | 1 | 1 |
Warehouse clubs, supercenters, and other general merchandise retailers | -- | 2 | 1 |
Warehouse clubs, supercenters, and other general merchandise retailers | -- | 2 | 1 |
Transportation and warehousing | 40 | 34 | 22 |
Truck transportation | 25 | 25 | 16 |
General freight trucking | 17 | 16 | 10 |
General freight trucking, local | -- | 7 | 4 |
General freight trucking, long-distance | 12 | 6 | 4 |
General freight trucking, long-distance, truckload | -- | 4 | 3 |
Specialized freight trucking | 7 | 7 | 4 |
Transit and ground passenger transportation | 5 | 1 | 1 |
Taxi and limousine service | 3 | 1 | 1 |
Taxi and ridesharing services | 3 | 1 | 1 |
Support activities for transportation | 3 | 5 | 3 |
Support activities for road transportation | 2 | 4 | 3 |
Motor vehicle towing | 2 | 4 | 3 |
Other support activities for transportation | -- | 1 | 1 |
Other support activities for transportation | -- | 1 | 1 |
Information | -- | -- | -- |
Financial activities | 1 | -- | -- |
Professional and business services | 8 | 15 | 10 |
Professional, scientific, and technical services | -- | 3 | 2 |
Professional, scientific, and technical services | -- | 3 | 2 |
Computer systems design and related services | -- | 1 | 1 |
Computer systems design and related services | -- | 1 | 1 |
Administrative and support and waste management and remediation services | 8 | 12 | 8 |
Administrative and support services | -- | 12 | 8 |
Services to buildings and dwellings | -- | 9 | 6 |
Janitorial services | -- | 2 | 1 |
Landscaping services | -- | 7 | 4 |
Other support services | -- | 1 | 1 |
Educational and health services | 5 | -- | -- |
Educational services | -- | 1 | 1 |
Educational services | -- | 1 | 1 |
Elementary and secondary schools | -- | 1 | 1 |
Elementary and secondary schools | -- | 1 | 1 |
Leisure and hospitality | -- | 14 | 9 |
Arts, entertainment, and recreation | -- | 5 | 3 |
Accommodation and food services | 3 | 9 | 6 |
Food services and drinking places | 3 | 9 | 6 |
Special food services | -- | 2 | 1 |
Caterers | -- | 2 | 1 |
Drinking places (alcoholic beverages) | -- | 2 | 1 |
Drinking places (alcoholic beverages) | -- | 2 | 1 |
Restaurants and other eating places | 3 | 5 | 3 |
Restaurants and other eating places | 3 | 5 | 3 |
Other services (except public administration) | -- | 3 | 2 |
Other services (except public administration) | -- | 3 | 2 |
Government (2) | 17 | 21 | 13 |
Federal government | 2 | 4 | 3 |
State government | 2 | 8 | 5 |
Local government | 13 | 9 | 6 |
Footnotes: | |||
Note: The Census of Fatal Occupational Injuries (CFOI) has published data on fatal occupational injuries for the United States since 1992. During this time, the classification systems and definitions of many data elements have changed. See the CFOI Definitions page (www.bls.gov/iif/definitions/census-of-fatal-occupational-injuries-definitions.htm) for a more detailed description of each data element. Data for all years are revised and final. Totals for major categories may include subcategories not shown separately. Dashes indicate no data reported or data that do not meet publication criteria. CFOI fatal injury counts exclude illness-related deaths unless precipitated by an injury event. | |||
| Occupation (1) | 2023 | 2024 | |
|---|---|---|---|
| Number | Number | Percent (%) | |
All occupations | 145 | 156 | 100 |
Management occupations | 6 | 12 | 8 |
Top executives | -- | 1 | 1 |
General and operations managers | -- | 1 | 1 |
General and operations managers | -- | 1 | 1 |
Operations specialties managers | 1 | 1 | 1 |
Other management occupations | 5 | 10 | 6 |
Farmers, ranchers, and other agricultural managers | 4 | 9 | 6 |
Farmers, ranchers, and other agricultural managers | 4 | 9 | 6 |
Food service managers | -- | 1 | 1 |
Food service managers | -- | 1 | 1 |
Computer and mathematical occupations | -- | 1 | 1 |
Computer occupations | -- | 1 | 1 |
Software and web developers, programmers, and testers | -- | 1 | 1 |
Architecture and engineering occupations | -- | 1 | 1 |
Drafters, engineering technicians, and mapping technicians | -- | 1 | 1 |
Community and social service occupations | 1 | 1 | 1 |
Counselors, social workers, and other community and social service specialists | 1 | 1 | 1 |
Social workers | -- | 1 | 1 |
Protective service occupations | -- | 12 | 8 |
Other protective service workers | -- | 2 | 1 |
Security guards and gambling surveillance officers | -- | 2 | 1 |
Security guards | -- | 2 | 1 |
Food preparation and serving related occupations | -- | 5 | 3 |
Supervisors of food preparation and serving workers | -- | 2 | 1 |
Supervisors of food preparation and serving workers | -- | 2 | 1 |
First-line supervisors of food preparation and serving workers | -- | 2 | 1 |
Food and beverage serving workers | -- | 3 | 2 |
Building and grounds cleaning and maintenance occupations | 8 | 11 | 7 |
Building cleaning and pest control workers | 3 | 3 | 2 |
Building cleaning workers | -- | 3 | 2 |
Janitors and cleaners, except maids and housekeeping cleaners | -- | 3 | 2 |
Grounds maintenance workers | 5 | 8 | 5 |
Grounds maintenance workers | 5 | 8 | 5 |
Sales and related occupations | 5 | -- | -- |
Retail sales workers | 3 | 4 | 3 |
Cashiers | -- | 2 | 1 |
Retail salespersons | -- | 2 | 1 |
Retail salespersons | -- | 2 | 1 |
Farming, fishing, and forestry occupations | 6 | 7 | 4 |
Agricultural workers | 5 | 6 | 4 |
Miscellaneous agricultural workers | 5 | 6 | 4 |
Construction and extraction occupations | 31 | 26 | 17 |
Supervisors of construction and extraction workers | -- | 7 | 4 |
First-line supervisors of construction trades and extraction workers | -- | 7 | 4 |
First-line supervisors of construction trades and extraction workers | -- | 7 | 4 |
Construction trades workers | 25 | 18 | 12 |
Carpenters | 5 | 4 | 3 |
Carpenters | 5 | 4 | 3 |
Construction laborers | 5 | 7 | 4 |
Construction laborers | 5 | 7 | 4 |
Electricians | -- | 3 | 2 |
Electricians | -- | 3 | 2 |
Other construction and related workers | -- | 1 | 1 |
Construction and building inspectors | -- | 1 | 1 |
Construction and building inspectors | -- | 1 | 1 |
Installation, maintenance, and repair occupations | 8 | 8 | 5 |
Vehicle and mobile equipment mechanics, installers, and repairers | -- | 4 | 3 |
Other installation, maintenance, and repair occupations | -- | 4 | 3 |
Production occupations | 7 | 8 | 5 |
Assemblers and fabricators | -- | 1 | 1 |
Electrical, electronics, and electromechanical assemblers | -- | 1 | 1 |
Electrical and electronic equipment assemblers | -- | 1 | 1 |
Metal workers and plastic workers | -- | 3 | 2 |
Molders and molding machine setters, operators, and tenders, metal and plastic | -- | 1 | 1 |
Plant and system operators | -- | 1 | 1 |
Miscellaneous plant and system operators | -- | 1 | 1 |
Transportation and material moving occupations | 55 | 47 | 30 |
Supervisors of transportation and material moving workers | -- | 1 | 1 |
First-line supervisors of transportation and material moving workers | -- | 1 | 1 |
First-line supervisors of helpers, laborers, and material movers, hand | -- | 1 | 1 |
Motor vehicle operators | 45 | 42 | 27 |
Driver/sales workers and truck drivers | 38 | 39 | 25 |
Heavy and tractor-trailer truck drivers | 30 | 34 | 22 |
Passenger vehicle drivers | 7 | 3 | 2 |
Taxi drivers | 3 | 1 | 1 |
Rail transportation workers | 2 | 1 | 1 |
Railroad conductors and yardmasters | -- | 1 | 1 |
Railroad conductors and yardmasters | -- | 1 | 1 |
Material moving workers | 5 | 3 | 2 |
Laborers and material movers | 5 | 3 | 2 |
Footnotes: | |||
Note: The Census of Fatal Occupational Injuries (CFOI) has published data on fatal occupational injuries for the United States since 1992. During this time, the classification systems and definitions of many data elements have changed. See the CFOI Definitions page (www.bls.gov/iif/definitions/census-of-fatal-occupational-injuries-definitions.htm) for a more detailed description of each data element. Data for all years are revised and final. Totals for major categories may include subcategories not shown separately. Dashes indicate no data reported or data that do not meet publication criteria. CFOI fatal injury counts exclude illness-related deaths unless precipitated by an injury event. | |||
| Demographic | 2023 | 2024 | |
|---|---|---|---|
| Number | Number | Percent (%) | |
Total | 145 | 156 | 100 |
Employee status | |||
Wage and salary workers (1) | 121 | 119 | 76 |
Self-employed (2) | 24 | 37 | 24 |
Sex | |||
Male | 129 | 140 | 90 |
Female | 16 | 16 | 10 |
Age (3) | |||
Under 16 years | -- | -- | -- |
16 to 17 years | -- | -- | -- |
18 to 19 years | -- | 1 | 1 |
20 to 24 years | -- | 14 | 9 |
25 to 34 years | 28 | 22 | 14 |
35 to 44 years | 25 | 31 | 20 |
45 to 54 years | 27 | 30 | 19 |
55 to 64 years | 38 | 33 | 21 |
65 years and over | 17 | 25 | 16 |
Race or ethnic origin (4) | |||
White, non-Hispanic | 95 | 103 | 66 |
Black or African-American, non-Hispanic | -- | 22 | 14 |
Hispanic or Latino | 27 | 28 | 18 |
American Indian or Alaska Native, non-Hispanic | -- | -- | -- |
Asian, non-Hispanic | -- | 3 | 2 |
Native Hawaiian or Pacific Islander, non-Hispanic | -- | -- | -- |
Person of multiple races, non-Hispanic | -- | -- | -- |
Other or not reported, non-Hispanic | -- | -- | -- |
Footnotes: | |||
Note: The Census of Fatal Occupational Injuries (CFOI) has published data on fatal occupational injuries for the United States since 1992. During this time, the classification systems and definitions of many data elements have changed. See the CFOI Definitions page (www.bls.gov/iif/definitions/census-of-fatal-occupational-injuries-definitions.htm) for a more detailed description of each data element. Data for all years are revised and final. Totals for major categories may include subcategories not shown separately. Dashes indicate no data reported or data that do not meet publication criteria. CFOI fatal injury counts exclude illness-related deaths unless precipitated by an injury event. | |||
Last Modified Date: Friday, March 27, 2026