An official website of the United States government
An official website of the United States government
The .gov means it's official.
Federal government websites often end in .gov or .mil. Before sharing sensitive information,
make sure you're on a federal government site.
The site is secure.
The
https:// ensures that you are connecting to the official website and that any
information you provide is encrypted and transmitted securely.
26-449-CHI
Friday, March 27, 2026
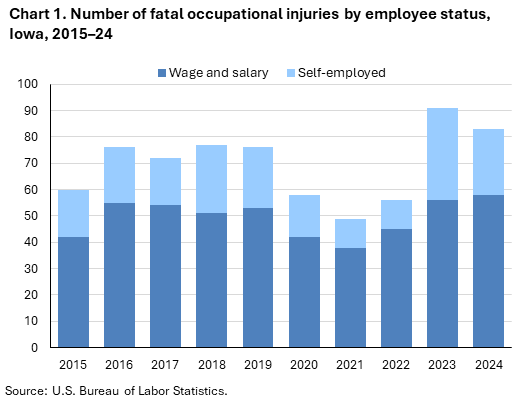
Fatal work injuries totaled 83 in 2024 for Iowa, the U.S. Bureau of Labor Statistics reported today. Assistant Commissioner for Regional Operations Michael Hirniak noted that the number of work-related fatalities in Iowa was down 8.8 percent from 91 in 2023. (See chart 1.) The fatal work injury rate was 5.2 fatalities per 100,000 full-time equivalent (FTE) workers in 2024, a decrease from a rate of 5.9 in 2023. Nationwide, a total of 5,070 fatal work injuries were recorded in 2024, a 4.0-percent decrease from 5,283 in 2023. These data are from the Census of Fatal Occupational Injuries (CFOI).
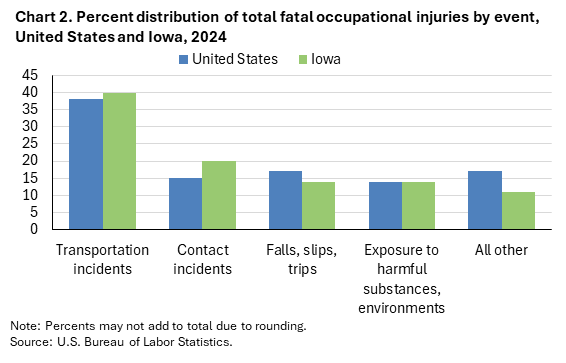
Transportation incidents (33) were the most frequent type of fatal event in Iowa, accounting for 40 percent of all fatal work injuries in the state. Nationally the share was 38 percent. Worker deaths from transportation incidents were down from 42 over the year (See chart 2 and table 1.)
Contact incidents (17) accounted for 20 percent of Iowa worker fatalities; nationally the share was 15 percent.
The agriculture, forestry, fishing and hunting sector had the highest number of fatalities with 21, down from 26 the previous year. (See table 2.)
Transportation incidents resulted in 10 of the 21 agriculture, forestry, fishing and hunting sector fatalities.
The crop production subsector accounted for 18 of the sector’s fatal workplace injuries.
Management occupations experienced the largest decrease (-13) in fatal work injuries over the year among the major occupational groups. (See table 3.)
The transportation and material moving occupational group had the highest number of fatal workplace injuries with 21. Transportation incidents resulted in 12 fatalities among these workers. Driver/sales workers and truck drivers accounted for 14 of the major group’s 21 fatal workplace injuries.
Wage and salary workers accounted for 70 percent of fatal workplace injuries in Iowa; the self-employed comprised the remaining 30 percent. (See chart 1 and table 4.) Nationally, wage and salary workers comprised 82 percent of fatalities.
Males accounted for 86 percent of the work-related fatalities in Iowa and 92 percent nationally.
Workers aged 55 years and older had a decrease in worker fatalities from 53 in 2023 to 42 in 2024.
Workers 25-54 years old accounted for 43 percent of the state’s work-related fatalities, compared to 55 percent of on-the-job fatalities nationally. Workers aged 55 years and older accounted for 51 percent of the state’s work-related fatalities in 2024, compared to 37 percent of on-the-job fatalities nationally.
Background of the program. The Census of Fatal Occupational Injuries (CFOI), part of the Bureau of Labor Statistics (BLS) Occupational Safety and Health Statistics (OSHS) program, is a count of all fatalities resulting from workplace injuries occurring in the U.S. during the calendar year. For technical information and definitions for the CFOI, see the national CFOI release Technical notes, the BLS Handbook of Methods, and the CFOI definitions.
Acknowledgments. BLS thanks the Iowa Labor Market Information Division, Research and Reporting Bureau for their efforts in collecting accurate, comprehensive, and useful data on fatal work injuries. BLS also appreciates the efforts of all federal, state, local, and private sector entities that provided source documents used to identify fatal work injuries nationally. See the national CFOI release Technical Notes for details on cooperating entities.
If you are deaf, hard of hearing, or have a speech disability, please dial 7-1-1 to access telecommunications relay services.
| Event or Exposure (1) | 2023 | 2024 | |
|---|---|---|---|
| Number | Number | Percent (%) | |
|
All events and exposures |
91 | 83 | 100 |
|
Violent acts |
-- | 7 | 8 |
|
Homicides (violent acts by other person) |
-- | 3 | 4 |
|
Shooting by other person |
-- | 2 | 2 |
|
Hitting, kicking, beating by other person |
-- | 1 | 1 |
|
Hitting, kicking, beating by other person while providing medical or custodial care |
-- | 1 | 1 |
|
Suicides (intentional self-harm) |
-- | 4 | 5 |
|
Transportation incidents |
42 | 33 | 40 |
|
Aircraft incidents |
-- | 1 | 1 |
|
In-flight crash, collision |
-- | 1 | 1 |
|
Low altitude entanglement |
-- | 1 | 1 |
|
Rail vehicle incidents |
-- | 1 | 1 |
|
Rail vehicle collisions |
-- | 1 | 1 |
|
Collision between rail and roadway vehicles |
-- | 1 | 1 |
|
Pedestrian incidents involving motorized land vehicles |
9 | 4 | 5 |
|
Pedestrian struck by vehicle in nonroadway area |
4 | 3 | 4 |
|
Pedestrian struck by forward-moving vehicle in nonroadway area |
1 | 1 | 1 |
|
Pedestrian struck by vehicle backing up in nonroadway area |
-- | 1 | 1 |
|
Roadway incidents involving motorized land vehicle |
24 | 21 | 25 |
|
Roadway collision with other vehicle(s) |
13 | 12 | 14 |
|
Roadway collision with other vehicle(s)-intersecting, turning |
3 | 8 | 10 |
|
Roadway collision with object other than vehicle |
5 | 3 | 4 |
|
Collision with object or animal on side of roadway |
4 | 3 | 4 |
|
Roadway noncollision incident |
6 | 6 | 7 |
|
Roadway noncollision- vehicle overturn |
-- | 3 | 4 |
|
Roadway noncollision- jack-knifed or ran off road |
-- | 3 | 4 |
|
Nonroadway incidents involving motorized land vehicles |
-- | 6 | 7 |
|
Falls, slips, trips |
19 | 12 | 14 |
|
Fall to lower level |
16 | 7 | 8 |
|
Slip, trip, stumble or fall on same level |
-- | 3 | 4 |
|
Fall on same level |
-- | 3 | 4 |
|
Exposure to harmful substances, environments |
7 | 12 | 14 |
|
Exposure to electricity |
-- | 3 | 4 |
|
Direct exposure to electricity |
-- | 1 | 1 |
|
Direct exposure to electricity- greater than 220 volts |
-- | 1 | 1 |
|
Indirect exposure to electricity |
-- | 1 | 1 |
|
Indirect exposure to electricity- greater than 220 volts |
-- | 1 | 1 |
|
Exposure to electric arc |
-- | 1 | 1 |
|
Exposure to harmful substances |
-- | 7 | 8 |
|
Drug, alcohol overdose |
-- | 4 | 5 |
|
Inhalation of harmful substance |
-- | 3 | 4 |
|
Contact incidents |
17 | 17 | 20 |
|
Collapse, engulfment |
4 | 2 | 2 |
|
Collapse, engulfment- open trench or excavation |
-- | 1 | 1 |
|
Collapse, engulfment- loose materials or liquids |
4 | 1 | 1 |
|
Struck by propelled, falling, or suspended object |
8 | 7 | 8 |
|
Struck, caught, or compressed by running powered equipment |
5 | 6 | 7 |
|
Struck by rolling powered vehicle or machinery |
3 | 3 | 4 |
|
Contact with non-running objects or equipment |
-- | 2 | 2 |
|
Injured by object handled by person |
-- | 1 | 1 |
|
Injured by object pushed or pulled by person |
-- | 1 | 1 |
|
Caught or wedged between objects- nonrunning |
-- | 1 | 1 |
|
Footnotes: |
|||
|
Note: The Census of Fatal Occupational Injuries (CFOI) has published data on fatal occupational injuries for the United States since 1992. During this time, the classification systems and definitions of many data elements have changed. See the CFOI Definitions page (www.bls.gov/iif/definitions/census-of-fatal-occupational-injuries-definitions.htm) for a more detailed description of each data element. Data for all years are revised and final. Totals for major categories may include subcategories not shown separately. Dashes indicate no data reported or data that do not meet publication criteria. CFOI fatal injury counts exclude illness-related deaths unless precipitated by an injury event. |
|||
| Industry | 2023 | 2024 | |
|---|---|---|---|
| Number | Number | Percent (%) | |
|
Total |
91 | 83 | 100 |
|
Private industry (1) |
85 | 80 | 96 |
|
Natural resources and mining |
26 | 21 | 25 |
|
Agriculture, forestry, fishing and hunting |
26 | 21 | 25 |
|
Crop production |
22 | 18 | 22 |
|
Oilseed and grain farming |
12 | 13 | 16 |
|
Soybean farming |
-- | 1 | 1 |
|
Corn farming |
6 | 2 | 2 |
|
Other grain farming |
-- | 1 | 1 |
|
Oilseed and grain combination farming |
-- | 1 | 1 |
|
Greenhouse, nursery, and floriculture production |
-- | 1 | 1 |
|
Nursery and floriculture production |
-- | 1 | 1 |
|
Construction |
15 | 15 | 18 |
|
Construction |
15 | 15 | 18 |
|
Construction of buildings |
-- | 6 | 7 |
|
Specialty trade contractors |
8 | 5 | 6 |
|
Building equipment contractors |
-- | 2 | 2 |
|
Plumbing, heating, and air-conditioning contractors |
-- | 1 | 1 |
|
Residential plumbing, heating, and air-conditioning contractors |
-- | 1 | 1 |
|
Other building equipment contractors |
-- | 1 | 1 |
|
Other nonresidential building equipment contractors |
-- | 1 | 1 |
|
Manufacturing |
6 | 7 | 8 |
|
Manufacturing |
6 | 7 | 8 |
|
Petroleum and coal products manufacturing |
-- | 1 | 1 |
|
Petroleum and coal products manufacturing |
-- | 1 | 1 |
|
Asphalt paving, roofing, and saturated materials manufacturing |
-- | 1 | 1 |
|
Fabricated metal product manufacturing |
-- | 1 | 1 |
|
Architectural and structural metals manufacturing |
-- | 1 | 1 |
|
Plate work and fabricated structural product manufacturing |
-- | 1 | 1 |
|
Fabricated structural metal manufacturing |
-- | 1 | 1 |
|
Computer and electronic product manufacturing |
-- | 1 | 1 |
|
Navigational, measuring, electromedical, and control instruments manufacturing |
-- | 1 | 1 |
|
Navigational, measuring, electromedical, and control instruments manufacturing |
-- | 1 | 1 |
|
Transportation equipment manufacturing |
-- | 1 | 1 |
|
Aerospace product and parts manufacturing |
-- | 1 | 1 |
|
Aerospace product and parts manufacturing |
-- | 1 | 1 |
|
Other aircraft parts and auxiliary equipment manufacturing |
-- | 1 | 1 |
|
Trade, transportation, and utilities |
-- | 18 | 22 |
|
Wholesale trade |
-- | 3 | 4 |
|
Retail trade |
3 | 5 | 6 |
|
Gasoline stations and fuel dealers |
-- | 1 | 1 |
|
Gasoline stations |
-- | 1 | 1 |
|
Sporting goods, hobby, musical instrument, book, and miscellaneous retailers |
-- | 1 | 1 |
|
Used merchandise retailers |
-- | 1 | 1 |
|
Used merchandise retailers |
-- | 1 | 1 |
|
Transportation and warehousing |
19 | 10 | 12 |
|
Truck transportation |
16 | 6 | 7 |
|
General freight trucking |
15 | 4 | 5 |
|
General freight trucking, long-distance |
8 | 3 | 4 |
|
General freight trucking, long-distance, truckload |
-- | 1 | 1 |
|
Specialized freight trucking |
-- | 1 | 1 |
|
Specialized freight (except used goods) trucking, local |
-- | 1 | 1 |
|
Support activities for transportation |
-- | 1 | 1 |
|
Support activities for road transportation |
-- | 1 | 1 |
|
Motor vehicle towing |
-- | 1 | 1 |
|
Warehousing and storage |
-- | 3 | 4 |
|
Warehousing and storage |
-- | 3 | 4 |
|
Information |
-- | 1 | 1 |
|
Information |
-- | 1 | 1 |
|
Telecommunications |
-- | 1 | 1 |
|
Wired and wireless telecommunications (except satellite) |
-- | 1 | 1 |
|
Wired and wireless telecommunications carriers (except satellite) |
-- | 1 | 1 |
|
Wired telecommunications carriers |
-- | 1 | 1 |
|
Financial activities |
-- | 1 | 1 |
|
Finance and insurance |
-- | 1 | 1 |
|
Credit intermediation and related activities |
-- | 1 | 1 |
|
Depository credit intermediation |
-- | 1 | 1 |
|
Commercial banking |
-- | 1 | 1 |
|
Professional and business services |
4 | 6 | 7 |
|
Professional, scientific, and technical services |
-- | 1 | 1 |
|
Professional, scientific, and technical services |
-- | 1 | 1 |
|
Legal services |
-- | 1 | 1 |
|
Offices of lawyers |
-- | 1 | 1 |
|
Administrative and support and waste management and remediation services |
4 | 5 | 6 |
|
Administrative and support services |
-- | 3 | 4 |
|
Waste management and remediation services |
-- | 2 | 2 |
|
Waste collection |
-- | 2 | 2 |
|
Waste collection |
-- | 2 | 2 |
|
Solid waste collection |
-- | 2 | 2 |
|
Educational and health services |
3 | -- | -- |
|
Leisure and hospitality |
-- | -- | -- |
|
Arts, entertainment, and recreation |
1 | 1 | 1 |
|
Amusement, gambling, and recreation industries |
-- | 1 | 1 |
|
Other amusement and recreation industries |
-- | 1 | 1 |
|
Golf courses and country clubs |
-- | 1 | 1 |
|
Other services (except public administration) |
5 | 7 | 8 |
|
Other services (except public administration) |
5 | 7 | 8 |
|
Repair and maintenance |
-- | 4 | 5 |
|
Government (2) |
6 | 3 | 4 |
|
Federal government |
-- | 1 | 1 |
|
State government |
1 | 1 | 1 |
|
Local government |
5 | 1 | 1 |
|
Footnotes: |
|||
|
Note: The Census of Fatal Occupational Injuries (CFOI) has published data on fatal occupational injuries for the United States since 1992. During this time, the classification systems and definitions of many data elements have changed. See the CFOI Definitions page (www.bls.gov/iif/definitions/census-of-fatal-occupational-injuries-definitions.htm) for a more detailed description of each data element. Data for all years are revised and final. Totals for major categories may include subcategories not shown separately. Dashes indicate no data reported or data that do not meet publication criteria. CFOI fatal injury counts exclude illness-related deaths unless precipitated by an injury event. |
|||
| Occupation (1) | 2023 | 2024 | |
|---|---|---|---|
| Number | Number | Percent (%) | |
|
All occupations |
91 | 83 | 100 |
|
Management occupations |
28 | 15 | 18 |
|
Other management occupations |
25 | 13 | 16 |
|
Farmers, ranchers, and other agricultural managers |
-- | 12 | 14 |
|
Farmers, ranchers, and other agricultural managers |
-- | 12 | 14 |
|
Architecture and engineering occupations |
-- | 1 | 1 |
|
Drafters, engineering technicians, and mapping technicians |
-- | 1 | 1 |
|
Community and social service occupations |
-- | 3 | 4 |
|
Counselors, social workers, and other community and social service specialists |
-- | 1 | 1 |
|
Social workers |
-- | 1 | 1 |
|
Child, family, and school social workers |
-- | 1 | 1 |
|
Religious workers |
-- | 2 | 2 |
|
Clergy |
-- | 2 | 2 |
|
Clergy |
-- | 2 | 2 |
|
Building and grounds cleaning and maintenance occupations |
3 | 3 | 4 |
|
Sales and related occupations |
-- | 3 | 4 |
|
Supervisors of sales workers |
-- | 1 | 1 |
|
First-line supervisors of sales workers |
-- | 1 | 1 |
|
First-line supervisors of retail sales workers |
-- | 1 | 1 |
|
Office and administrative support occupations |
-- | 2 | 2 |
|
Supervisors of office and administrative support workers |
-- | 1 | 1 |
|
First-line supervisors of office and administrative support workers |
-- | 1 | 1 |
|
First-line supervisors of office and administrative support workers |
-- | 1 | 1 |
|
Secretaries and administrative assistants |
-- | 1 | 1 |
|
Secretaries and administrative assistants |
-- | 1 | 1 |
|
Farming, fishing, and forestry occupations |
2 | 6 | 7 |
|
Agricultural workers |
2 | 6 | 7 |
|
Miscellaneous agricultural workers |
2 | 6 | 7 |
|
Construction and extraction occupations |
13 | 11 | 13 |
|
Installation, maintenance, and repair occupations |
5 | 9 | 11 |
|
Electrical and electronic equipment mechanics, installers, and repairers |
-- | 1 | 1 |
|
Radio and telecommunications equipment installers and repairers |
-- | 1 | 1 |
|
Vehicle and mobile equipment mechanics, installers, and repairers |
-- | 6 | 7 |
|
Automotive technicians and repairers |
-- | 2 | 2 |
|
Automotive service technicians and mechanics |
-- | 2 | 2 |
|
Other installation, maintenance, and repair occupations |
-- | 2 | 2 |
|
Heating, air conditioning, and refrigeration mechanics and installers |
-- | 1 | 1 |
|
Heating, air conditioning, and refrigeration mechanics and installers |
-- | 1 | 1 |
|
Industrial machinery installation, repair, and maintenance workers |
-- | 1 | 1 |
|
Millwrights |
-- | 1 | 1 |
|
Production occupations |
5 | 4 | 5 |
|
Transportation and material moving occupations |
23 | 21 | 25 |
|
Supervisors of transportation and material moving workers |
-- | 1 | 1 |
|
First-line supervisors of transportation and material moving workers |
-- | 1 | 1 |
|
First-line supervisors of helpers, laborers, and material movers, hand |
-- | 1 | 1 |
|
Air transportation workers |
-- | 1 | 1 |
|
Aircraft pilots and flight engineers |
-- | 1 | 1 |
|
Commercial pilots |
-- | 1 | 1 |
|
Motor vehicle operators |
-- | 14 | 17 |
|
Driver/sales workers and truck drivers |
-- | 14 | 17 |
|
Material moving workers |
-- | 5 | 6 |
|
Crane and tower operators |
-- | 1 | 1 |
|
Crane and tower operators |
-- | 1 | 1 |
|
Laborers and material movers |
-- | 4 | 5 |
|
Footnotes: |
|||
|
Note: The Census of Fatal Occupational Injuries (CFOI) has published data on fatal occupational injuries for the United States since 1992. During this time, the classification systems and definitions of many data elements have changed. See the CFOI Definitions page (www.bls.gov/iif/definitions/census-of-fatal-occupational-injuries-definitions.htm) for a more detailed description of each data element. Data for all years are revised and final. Totals for major categories may include subcategories not shown separately. Dashes indicate no data reported or data that do not meet publication criteria. CFOI fatal injury counts exclude illness-related deaths unless precipitated by an injury event. |
|||
| Demographic | 2023 | 2024 | |
|---|---|---|---|
| Number | Number | Percent (%) | |
|
Total |
91 | 83 | 100 |
|
Employee status |
|||
|
Wage and salary workers (1) |
56 | 58 | 70 |
|
Self-employed (2) |
35 | 25 | 30 |
|
Sex |
|||
|
Male |
84 | 71 | 86 |
|
Female |
7 | 12 | 14 |
|
Age (3) |
|||
|
Under 16 years |
-- | 2 | 2 |
|
16 to 17 years |
-- | -- | -- |
|
18 to 19 years |
-- | -- | -- |
|
20 to 24 years |
-- | 3 | 4 |
|
25 to 34 years |
10 | 11 | 13 |
|
35 to 44 years |
12 | 14 | 17 |
|
45 to 54 years |
12 | 11 | 13 |
|
55 to 64 years |
22 | 15 | 18 |
|
65 years and over |
31 | 27 | 33 |
|
Race or ethnic origin (4) |
|||
|
White, non-Hispanic |
15 | 3 | 4 |
|
Black or African-American, non-Hispanic |
-- | -- | -- |
|
Hispanic or Latino |
-- | -- | -- |
|
American Indian or Alaska Native, non-Hispanic |
-- | -- | -- |
|
Asian, non-Hispanic |
-- | -- | -- |
|
Native Hawaiian or Pacific Islander, non-Hispanic |
-- | -- | -- |
|
Person of multiple races, non-Hispanic |
-- | -- | -- |
|
Other or not reported, non-Hispanic |
72 | 79 | 95 |
|
Footnotes: |
|||
|
Note: The Census of Fatal Occupational Injuries (CFOI) has published data on fatal occupational injuries for the United States since 1992. During this time, the classification systems and definitions of many data elements have changed. See the CFOI Definitions page (www.bls.gov/iif/definitions/census-of-fatal-occupational-injuries-definitions.htm) for a more detailed description of each data element. Data for all years are revised and final. Totals for major categories may include subcategories not shown separately. Dashes indicate no data reported or data that do not meet publication criteria. CFOI fatal injury counts exclude illness-related deaths unless precipitated by an injury event. |
|||
Last Modified Date: Friday, March 27, 2026