An official website of the United States government
An official website of the United States government
The .gov means it's official.
Federal government websites often end in .gov or .mil. Before sharing sensitive information,
make sure you're on a federal government site.
The site is secure.
The
https:// ensures that you are connecting to the official website and that any
information you provide is encrypted and transmitted securely.
26-470-CHI
Friday, March 27, 2026
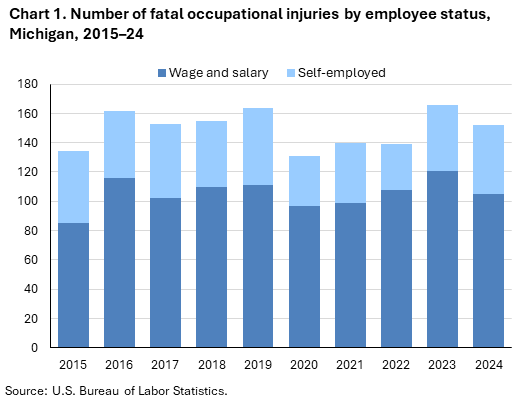
Fatal work injuries totaled 152 in 2024 for Michigan, the U.S. Bureau of Labor Statistics reported today. Assistant Commissioner for Regional Operations Michael Hirniak noted that the number of work-related fatalities in Michigan was down 8.4 percent from 166 in 2023. (See chart 1.) The fatal work injury rate was 3.3 fatalities per 100,000 full-time equivalent (FTE) workers in 2024, a decrease from a rate of 3.6 in 2023. Nationwide, a total of 5,070 fatal work injuries were recorded in 2024, a 4.0-percent decrease from 5,283 in 2023. These data are from the Census of Fatal Occupational Injuries (CFOI).
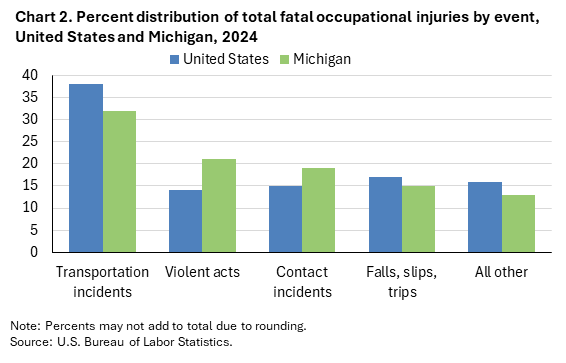
Transportation incidents (48) were the most frequent type of fatal event in Michigan, accounting for 32 percent of all fatal work injuries in the state. Nationally the share was 38 percent. Worker deaths from transportation incidents were down from 55 over the year. (See chart 2 and table 1.)
Violent acts (32) accounted for 21 percent of Michigan worker fatalities; nationally the share was 14 percent.
The construction sector had the highest number of fatalities with 28, down from 39 the previous year. (See table 2.)
Fatal falls, slips, and trips resulted in 12 of the 28 construction sector fatalities.
The specialty trade contractors subsector accounted for 19 of the sector’s fatal workplace injuries.
Construction and extraction workers experienced the largest decrease (-9) in fatal work injuries over the year among the major occupational groups. (See table 3.)
The transportation and material moving occupational group had the highest number of fatal workplace injuries with 30. Transportation incidents resulted in 19 fatalities among these workers. Within the major group, heavy and tractor-trailer drivers accounted for 16 of the major group’s 30 fatal workplace injuries.
Wage and salary workers accounted for 69 percent of fatal workplace injuries in Michigan; the self-employed comprised the remaining 31 percent. (See chart 1 and table 4.) Nationally, wage and salary workers comprised 82 percent of fatalities.
Fatal workplace injuries among female workers decreased from 15 to 10, with violent acts accounting for 40 percent of fatal events in 2024.
White non-Hispanics accounted for 84 percent of those who died from a workplace injury. Nationwide, this group accounted for 56 percent of work-related deaths.
Workers 25-54 years old accounted for 44 percent of the state’s work-related fatalities, compared to 55 percent of on-the-job fatalities nationally. Workers aged 55 years and older accounted for 47 percent of the state’s work-related fatalities in 2024, compared to 37 percent of on-the-job fatalities nationally.
Workers 25-54 years old had a decrease in worker fatalities from 85 in 2023 to 67 in 2024. Fatalities increased from 31 in 2023 to 38 in 2024 for workers aged 65 and over.
Background of the program. The Census of Fatal Occupational Injuries (CFOI), part of the Bureau of Labor Statistics (BLS) Occupational Safety and Health Statistics (OSHS) program, is a count of all fatalities resulting from workplace injuries occurring in the U.S. during the calendar year. For technical information and definitions for the CFOI, see the national CFOI release Technical notes, the BLS Handbook of Methods, and the CFOI definitions.
Acknowledgments. BLS thanks the Michigan Department of Labor and Economic Opportunity for their efforts in collecting accurate, comprehensive, and useful data on fatal work injuries. BLS also appreciates the efforts of all federal, state, local, and private sector entities that provided source documents used to identify fatal work injuries nationally. See the national CFOI release Technical Notes for details on cooperating entities.
If you are deaf, hard of hearing, or have a speech disability, please dial 7-1-1 to access telecommunications relay services.
| Event or Exposure (1) | 2023 | 2024 | |
|---|---|---|---|
| Number | Number | Percent (%) | |
|
All events and exposures |
166 | 152 | 100 |
|
Violent acts |
36 | 32 | 21 |
|
Homicides (violent acts by other person) |
19 | 18 | 12 |
|
Shooting by other person |
17 | 15 | 10 |
|
Multiple violent acts by other person |
-- | 1 | 1 |
|
Suicides (intentional self-harm) |
17 | 14 | 9 |
|
Intentional self-harm-- shooting |
7 | 8 | 5 |
|
Intentional self-harm-- hanging, strangulation, asphyxiation |
6 | 4 | 3 |
|
Transportation incidents |
55 | 48 | 32 |
|
Aircraft incidents |
-- | 1 | 1 |
|
Aircraft crash during takeoff or landing |
-- | 1 | 1 |
|
Aircraft crash during takeoff or landing into structure, object, or ground |
-- | 1 | 1 |
|
Pedestrian incidents involving motorized land vehicles |
12 | 10 | 7 |
|
Pedestrian struck by vehicle in nonroadway area |
-- | 5 | 3 |
|
Pedestrian struck by forward-moving vehicle in nonroadway area |
-- | 3 | 2 |
|
Roadway incidents involving motorized land vehicle |
36 | 23 | 15 |
|
Roadway collision with other vehicle(s) |
26 | 14 | 9 |
|
Roadway collision with other vehicle(s)-intersecting, turning |
11 | 5 | 3 |
|
Roadway collision with other vehicle(s)-moving in same direction |
4 | 3 | 2 |
|
Roadway collision with other vehicle(s)-moving in opposite directions, oncoming |
8 | 2 | 1 |
|
Roadway collision with other vehicle(s)-moving and standing vehicle |
3 | 4 | 3 |
|
Roadway collision with object other than vehicle |
6 | 5 | 3 |
|
Collision with object or animal on side of roadway |
5 | 5 | 3 |
|
Roadway noncollision incident |
4 | 4 | 3 |
|
Roadway noncollision- vehicle overturn |
4 | 3 | 2 |
|
Roadway noncollision- fall or jump from moving vehicle |
-- | 1 | 1 |
|
Nonroadway incidents involving motorized land vehicles |
7 | 12 | 8 |
|
Nonroadway collision with object other than vehicle |
-- | 4 | 3 |
|
Nonroadway noncollision incident |
-- | 7 | 5 |
|
Nonroadway noncollision- vehicle overturn |
-- | 3 | 2 |
|
Nonroadway noncollision- fall or jump from and struck by moving vehicle |
-- | 3 | 2 |
|
Explosions and fires |
6 | -- | -- |
|
Falls, slips, trips |
22 | 23 | 15 |
|
Fall to lower level |
17 | 22 | 14 |
|
Other fall to lower level |
13 | 20 | 13 |
|
Other fall to lower level- less than 6 feet |
-- | 4 | 3 |
|
Other fall to lower level- 6 to 30 feet |
10 | 16 | 11 |
|
Exposure to harmful substances, environments |
19 | 15 | 10 |
|
Exposure to electricity |
-- | 2 | 1 |
|
Indirect exposure to electricity |
-- | 2 | 1 |
|
Indirect exposure to electricity- greater than 220 volts |
-- | 2 | 1 |
|
Exposure to temperature extremes |
-- | 3 | 2 |
|
Exposure to environmental heat |
-- | 3 | 2 |
|
Exposure to harmful substances |
14 | 10 | 7 |
|
Drug, alcohol overdose |
-- | 7 | 5 |
|
Contact incidents |
28 | 29 | 19 |
|
Struck by propelled, falling, or suspended object |
14 | 20 | 13 |
|
Struck by propelled object or substance |
-- | 3 | 2 |
|
Struck by falling object |
-- | 16 | 11 |
|
Struck by object tipping over |
-- | 1 | 1 |
|
Struck by falling part of vehicle or machine, still attached |
-- | 1 | 1 |
|
Struck, caught, or compressed by running powered equipment |
10 | 5 | 3 |
|
Overexertion, repetitive motion, and bodily condition |
-- | -- | -- |
|
Footnotes: |
|||
|
Note: The Census of Fatal Occupational Injuries (CFOI) has published data on fatal occupational injuries for the United States since 1992. During this time, the classification systems and definitions of many data elements have changed. See the CFOI Definitions page (www.bls.gov/iif/definitions/census-of-fatal-occupational-injuries-definitions.htm) for a more detailed description of each data element. Data for all years are revised and final. Totals for major categories may include subcategories not shown separately. Dashes indicate no data reported or data that do not meet publication criteria. CFOI fatal injury counts exclude illness-related deaths unless precipitated by an injury event. |
|||
| Industry | 2023 | 2024 | |
|---|---|---|---|
| Number | Number | Percent (%) | |
|
Total |
166 | 152 | 100 |
|
Private industry (1) |
156 | 142 | 93 |
|
Natural resources and mining |
21 | -- | -- |
|
Agriculture, forestry, fishing and hunting |
21 | 24 | 16 |
|
Crop production |
16 | 14 | 9 |
|
Oilseed and grain farming |
2 | 3 | 2 |
|
Soybean farming |
1 | 1 | 1 |
|
Other grain farming |
1 | 2 | 1 |
|
Oilseed and grain combination farming |
1 | 1 | 1 |
|
Vegetable and melon farming |
-- | 1 | 1 |
|
Vegetable and melon farming |
-- | 1 | 1 |
|
Potato farming |
-- | 1 | 1 |
|
Fruit and tree nut farming |
1 | 2 | 1 |
|
Other crop farming |
4 | 4 | 3 |
|
Hay farming |
-- | 3 | 2 |
|
All other crop farming |
-- | 1 | 1 |
|
Forestry and logging |
-- | 5 | 3 |
|
Logging |
-- | 5 | 3 |
|
Logging |
-- | 5 | 3 |
|
Construction |
39 | 28 | 18 |
|
Construction |
39 | 28 | 18 |
|
Construction of buildings |
7 | 5 | 3 |
|
Residential building construction |
-- | 5 | 3 |
|
Residential building construction |
-- | 5 | 3 |
|
Residential remodelers |
-- | 3 | 2 |
|
Heavy and civil engineering construction |
8 | 4 | 3 |
|
Highway, street, and bridge construction |
-- | 4 | 3 |
|
Highway, street, and bridge construction |
-- | 4 | 3 |
|
Specialty trade contractors |
24 | 19 | 13 |
|
Foundation, structure, and building exterior contractors |
9 | 8 | 5 |
|
Structural steel and precast concrete contractors |
-- | 1 | 1 |
|
Framing contractors |
-- | 1 | 1 |
|
Residential framing contractors |
-- | 1 | 1 |
|
Roofing contractors |
6 | 3 | 2 |
|
Other foundation, structure, and building exterior contractors |
-- | 1 | 1 |
|
Building equipment contractors |
4 | 6 | 4 |
|
Electrical contractors and other wiring installation contractors |
2 | 1 | 1 |
|
Plumbing, heating, and air-conditioning contractors |
2 | 5 | 3 |
|
Nonresidential plumbing, heating, and air-conditioning contractors |
-- | 1 | 1 |
|
Manufacturing |
6 | 16 | 11 |
|
Manufacturing |
6 | 16 | 11 |
|
Food manufacturing |
-- | 3 | 2 |
|
Fabricated metal product manufacturing |
-- | 4 | 3 |
|
Architectural and structural metals manufacturing |
-- | 1 | 1 |
|
Plate work and fabricated structural product manufacturing |
-- | 1 | 1 |
|
Fabricated structural metal manufacturing |
-- | 1 | 1 |
|
Transportation equipment manufacturing |
3 | 7 | 5 |
|
Motor vehicle parts manufacturing |
1 | 4 | 3 |
|
Other motor vehicle parts manufacturing |
-- | 1 | 1 |
|
Trade, transportation, and utilities |
35 | 28 | 18 |
|
Wholesale trade |
8 | 3 | 2 |
|
Retail trade |
11 | 8 | 5 |
|
Building material and garden equipment and supplies dealers |
-- | 2 | 1 |
|
Building material and supplies dealers |
-- | 2 | 1 |
|
Home centers |
-- | 1 | 1 |
|
Other building material dealers |
-- | 1 | 1 |
|
Food and beverage retailers |
3 | 2 | 1 |
|
Grocery and convenience retailers |
-- | 1 | 1 |
|
Convenience retailers and vending machine operators |
-- | 1 | 1 |
|
Convenience retailers |
-- | 1 | 1 |
|
Beer, wine, and liquor retailers |
-- | 1 | 1 |
|
Beer, wine, and liquor retailers |
-- | 1 | 1 |
|
Sporting goods, hobby, musical instrument, book, and miscellaneous retailers |
-- | 1 | 1 |
|
Transportation and warehousing |
13 | 17 | 11 |
|
Truck transportation |
9 | 11 | 7 |
|
General freight trucking |
6 | 9 | 6 |
|
General freight trucking, local |
-- | 3 | 2 |
|
General freight trucking, long-distance |
-- | 6 | 4 |
|
Specialized freight trucking |
3 | 2 | 1 |
|
Specialized freight (except used goods) trucking, local |
-- | 1 | 1 |
|
Specialized freight (except used goods) trucking, long-distance |
-- | 1 | 1 |
|
Couriers and messengers |
-- | 3 | 2 |
|
Information |
-- | 2 | 1 |
|
Information |
-- | 2 | 1 |
|
Financial activities |
-- | 2 | 1 |
|
Real estate and rental and leasing |
4 | 2 | 1 |
|
Real estate |
-- | 2 | 1 |
|
Lessors of real estate |
-- | 2 | 1 |
|
Lessors of residential buildings and dwellings |
-- | 2 | 1 |
|
Professional and business services |
-- | 13 | 9 |
|
Professional, scientific, and technical services |
-- | 2 | 1 |
|
Professional, scientific, and technical services |
-- | 2 | 1 |
|
Administrative and support and waste management and remediation services |
15 | 11 | 7 |
|
Administrative and support services |
12 | 10 | 7 |
|
Waste management and remediation services |
3 | 1 | 1 |
|
Waste collection |
2 | 1 | 1 |
|
Waste collection |
2 | 1 | 1 |
|
Educational and health services |
7 | -- | -- |
|
Health care and social assistance |
7 | 5 | 3 |
|
Leisure and hospitality |
16 | 12 | 8 |
|
Arts, entertainment, and recreation |
10 | 6 | 4 |
|
Performing arts, spectator sports, and related industries |
5 | 4 | 3 |
|
Performing arts companies |
-- | 3 | 2 |
|
Spectator sports |
-- | 1 | 1 |
|
Spectator sports |
-- | 1 | 1 |
|
Accommodation and food services |
6 | 6 | 4 |
|
Accommodation |
-- | 3 | 2 |
|
Traveler accommodation |
-- | 3 | 2 |
|
Hotels (except casino hotels) and motels |
-- | 3 | 2 |
|
Food services and drinking places |
-- | 3 | 2 |
|
Restaurants and other eating places |
-- | 3 | 2 |
|
Restaurants and other eating places |
-- | 3 | 2 |
|
Other services (except public administration) |
8 | 9 | 6 |
|
Other services (except public administration) |
8 | 9 | 6 |
|
Repair and maintenance |
8 | 7 | 5 |
|
Government (2) |
10 | 10 | 7 |
|
Federal government |
1 | -- | -- |
|
State government |
3 | 4 | 3 |
|
Local government |
6 | 6 | 4 |
|
Footnotes: |
|||
|
Note: The Census of Fatal Occupational Injuries (CFOI) has published data on fatal occupational injuries for the United States since 1992. During this time, the classification systems and definitions of many data elements have changed. See the CFOI Definitions page (www.bls.gov/iif/definitions/census-of-fatal-occupational-injuries-definitions.htm) for a more detailed description of each data element. Data for all years are revised and final. Totals for major categories may include subcategories not shown separately. Dashes indicate no data reported or data that do not meet publication criteria. CFOI fatal injury counts exclude illness-related deaths unless precipitated by an injury event. |
|||
| Occupation (1) | 2023 | 2024 | |
|---|---|---|---|
| Number | Number | Percent (%) | |
|
All occupations |
166 | 152 | 100 |
|
Management occupations |
20 | 19 | 13 |
|
Other management occupations |
18 | 16 | 11 |
|
Farmers, ranchers, and other agricultural managers |
11 | 14 | 9 |
|
Farmers, ranchers, and other agricultural managers |
11 | 14 | 9 |
|
Business and financial operations occupations |
-- | -- | -- |
|
Computer and mathematical occupations |
-- | -- | -- |
|
Architecture and engineering occupations |
-- | -- | -- |
|
Life, physical, and social science occupations |
-- | 1 | 1 |
|
Occupational health and safety specialists and technicians |
-- | 1 | 1 |
|
Occupational health and safety specialists and technicians |
-- | 1 | 1 |
|
Occupational health and safety specialists |
-- | 1 | 1 |
|
Community and social service occupations |
-- | -- | -- |
|
Legal occupations |
-- | -- | -- |
|
Educational instruction and library occupations |
-- | -- | -- |
|
Arts, design, entertainment, sports, and media occupations |
5 | 4 | 3 |
|
Entertainers and performers, sports and related workers |
-- | 4 | 3 |
|
Athletes, coaches, umpires, and related workers |
-- | 1 | 1 |
|
Musicians, singers, and related workers |
-- | 3 | 2 |
|
Healthcare practitioners and technical occupations |
5 | 5 | 3 |
|
Healthcare support occupations |
-- | -- | -- |
|
Protective service occupations |
5 | -- | -- |
|
Food preparation and serving related occupations |
5 | -- | -- |
|
Building and grounds cleaning and maintenance occupations |
13 | 11 | 7 |
|
Grounds maintenance workers |
9 | 8 | 5 |
|
Grounds maintenance workers |
9 | 8 | 5 |
|
Landscaping and groundskeeping workers |
6 | 7 | 5 |
|
Tree trimmers and pruners |
3 | 1 | 1 |
|
Personal care and service occupations |
4 | 1 | 1 |
|
Animal care and service workers |
-- | 1 | 1 |
|
Animal caretakers |
-- | 1 | 1 |
|
Animal caretakers |
-- | 1 | 1 |
|
Sales and related occupations |
9 | 7 | 5 |
|
Office and administrative support occupations |
-- | 3 | 2 |
|
Information and record clerks |
-- | 1 | 1 |
|
Hotel, motel, and resort desk clerks |
-- | 1 | 1 |
|
Hotel, motel, and resort desk clerks |
-- | 1 | 1 |
|
Farming, fishing, and forestry occupations |
9 | 10 | 7 |
|
Agricultural workers |
-- | 5 | 3 |
|
Miscellaneous agricultural workers |
-- | 5 | 3 |
|
Forest, conservation, and logging workers |
-- | 5 | 3 |
|
Logging workers |
-- | 5 | 3 |
|
Fallers |
-- | 5 | 3 |
|
Construction and extraction occupations |
32 | 23 | 15 |
|
Construction trades workers |
29 | 21 | 14 |
|
Carpenters |
4 | 6 | 4 |
|
Carpenters |
4 | 6 | 4 |
|
Construction laborers |
9 | 4 | 3 |
|
Construction laborers |
9 | 4 | 3 |
|
Construction equipment operators |
-- | 3 | 2 |
|
Operating engineers and other construction equipment operators |
-- | 3 | 2 |
|
Pipelayers, plumbers, pipefitters, and steamfitters |
-- | 1 | 1 |
|
Plumbers, pipefitters, and steamfitters |
-- | 1 | 1 |
|
Roofers |
6 | 3 | 2 |
|
Roofers |
6 | 3 | 2 |
|
Installation, maintenance, and repair occupations |
21 | 15 | 10 |
|
Supervisors of installation, maintenance, and repair workers |
-- | 1 | 1 |
|
First-line supervisors of mechanics, installers, and repairers |
-- | 1 | 1 |
|
First-line supervisors of mechanics, installers, and repairers |
-- | 1 | 1 |
|
Electrical and electronic equipment mechanics, installers, and repairers |
1 | -- | -- |
|
Miscellaneous electrical and electronic equipment mechanics, installers, and repairers |
-- | 1 | 1 |
|
Audiovisual equipment installers and repairers |
-- | 1 | 1 |
|
Vehicle and mobile equipment mechanics, installers, and repairers |
13 | 5 | 3 |
|
Automotive technicians and repairers |
11 | 4 | 3 |
|
Automotive service technicians and mechanics |
11 | 4 | 3 |
|
Heavy vehicle and mobile equipment service technicians and mechanics |
-- | 1 | 1 |
|
Farm equipment mechanics and service technicians |
-- | 1 | 1 |
|
Other installation, maintenance, and repair occupations |
6 | 7 | 5 |
|
Heating, air conditioning, and refrigeration mechanics and installers |
1 | 3 | 2 |
|
Heating, air conditioning, and refrigeration mechanics and installers |
1 | 3 | 2 |
|
Production occupations |
-- | 10 | 7 |
|
Metal workers and plastic workers |
-- | 5 | 3 |
|
Miscellaneous metal workers and plastic workers |
-- | 3 | 2 |
|
Other production occupations |
-- | 2 | 1 |
|
Transportation and material moving occupations |
31 | 30 | 20 |
|
Motor vehicle operators |
26 | 23 | 15 |
|
Driver/sales workers and truck drivers |
24 | 21 | 14 |
|
Heavy and tractor-trailer truck drivers |
19 | 16 | 11 |
|
Passenger vehicle drivers |
1 | 2 | 1 |
|
Material moving workers |
-- | 5 | 3 |
|
Footnotes: |
|||
|
Note: The Census of Fatal Occupational Injuries (CFOI) has published data on fatal occupational injuries for the United States since 1992. During this time, the classification systems and definitions of many data elements have changed. See the CFOI Definitions page (www.bls.gov/iif/definitions/census-of-fatal-occupational-injuries-definitions.htm) for a more detailed description of each data element. Data for all years are revised and final. Totals for major categories may include subcategories not shown separately. Dashes indicate no data reported or data that do not meet publication criteria. CFOI fatal injury counts exclude illness-related deaths unless precipitated by an injury event. |
|||
| Demographic | 2023 | 2024 | |
|---|---|---|---|
| Number | Number | Percent (%) | |
|
Total |
166 | 152 | 100 |
|
Employee status |
|||
|
Wage and salary workers (1) |
121 | 105 | 69 |
|
Self-employed (2) |
45 | 47 | 31 |
|
Sex |
|||
|
Male |
151 | 142 | 93 |
|
Female |
15 | 10 | 7 |
|
Age (3) |
|||
|
Under 16 years |
-- | -- | -- |
|
16 to 17 years |
-- | -- | -- |
|
18 to 19 years |
4 | 1 | 1 |
|
20 to 24 years |
10 | 11 | 7 |
|
25 to 34 years |
23 | 20 | 13 |
|
35 to 44 years |
28 | 21 | 14 |
|
45 to 54 years |
34 | 26 | 17 |
|
55 to 64 years |
35 | 33 | 22 |
|
65 years and over |
31 | 38 | 25 |
|
Race or ethnic origin (4) |
|||
|
White, non-Hispanic |
128 | 127 | 84 |
|
Black or African-American, non-Hispanic |
25 | 17 | 11 |
|
Hispanic or Latino |
11 | 6 | 4 |
|
American Indian or Alaska Native, non-Hispanic |
-- | -- | -- |
|
Asian, non-Hispanic |
-- | -- | -- |
|
Native Hawaiian or Pacific Islander, non-Hispanic |
-- | -- | -- |
|
Person of multiple races, non-Hispanic |
-- | -- | -- |
|
Other or not reported, non-Hispanic |
-- | -- | -- |
|
Footnotes: |
|||
|
Note: The Census of Fatal Occupational Injuries (CFOI) has published data on fatal occupational injuries for the United States since 1992. During this time, the classification systems and definitions of many data elements have changed. See the CFOI Definitions page (www.bls.gov/iif/definitions/census-of-fatal-occupational-injuries-definitions.htm) for a more detailed description of each data element. Data for all years are revised and final. Totals for major categories may include subcategories not shown separately. Dashes indicate no data reported or data that do not meet publication criteria. CFOI fatal injury counts exclude illness-related deaths unless precipitated by an injury event. |
|||
Last Modified Date: Friday, March 27, 2026