An official website of the United States government
An official website of the United States government
The .gov means it's official.
Federal government websites often end in .gov or .mil. Before sharing sensitive information,
make sure you're on a federal government site.
The site is secure.
The
https:// ensures that you are connecting to the official website and that any
information you provide is encrypted and transmitted securely.
26-448-CHI
Friday, March 27, 2026
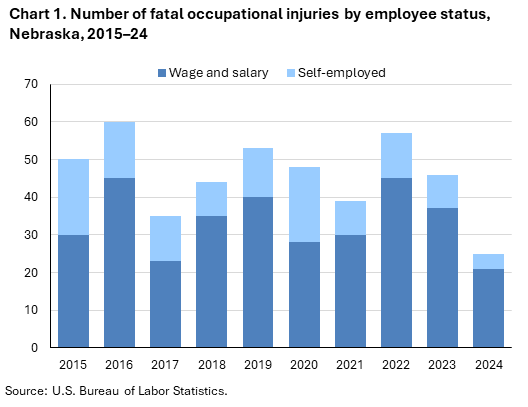
Fatal work injuries totaled 25 in 2024 for Nebraska, the U.S. Bureau of Labor Statistics reported today. Assistant Commissioner for Regional Operations Michael Hirniak noted that the number of work-related fatalities in Nebraska was down 45.7 percent from 46 in 2023. (See chart 1.) The fatal work injury rate was 2.6 fatalities per 100,000 full-time equivalent (FTE) workers in 2024, a decrease from a rate of 4.8 in 2023. Nationwide, a total of 5,070 fatal work injuries were recorded in 2024, a 4.0-percent decrease from 5,283 in 2023. These data are from the Census of Fatal Occupational Injuries (CFOI).
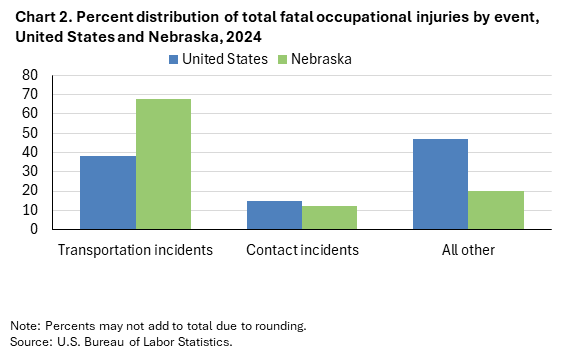
Transportation incidents (17) were the most frequent type of fatal event in Nebraska, accounting for 68 percent of all fatal work injuries in the state. Nationally the share was 38 percent. Worker deaths from transportation incidents were down from 21 over the year. (See chart 2 and table 1.)
Contact incidents declined from eight to three cases in 2024, accounting for 12 percent of Nebraska worker fatalities; nationally the share was 15 percent.
The transportation and warehousing sector had the highest number of fatalities with 10, up from 4 the previous year. (See table 2.)
Transportation incidents accounted for all 10 fatalities in the transportation and warehousing sector.
The truck transportation subsector accounted for five of the sector’s fatal workplace injuries.
Fatal work injuries declined by five over the year in the management occupational group. (See table 3.)
The transportation and material moving occupational group had the highest number of fatal workplace injuries (11), all due to transportation incidents. Motor vehicle operators accounted for 8 of the major group’s 11 fatal workplace injuries.
Wage and salary workers accounted for 84 percent of fatal workplace injuries in Nebraska; the self-employed comprised the remaining 16 percent. (See chart 1 and table 4.) Nationally, wage and salary workers comprised 82 percent of fatalities.
Workers aged 35-44 years old had a decrease in worker fatalities from eight in 2023 to four in 2024.
Workers aged 65 years and older accounted for 36 percent of the state’s work-related fatalities, compared to 16 percent of on-the-job fatalities nationally.
Background of the program. The Census of Fatal Occupational Injuries (CFOI), part of the Bureau of Labor Statistics (BLS) Occupational Safety and Health Statistics (OSHS) program, is a count of all fatalities resulting from workplace injuries occurring in the U.S. during the calendar year. For technical information and definitions for the CFOI, see the national CFOI release Technical notes, the BLS Handbook of Methods, and the CFOI definitions.
Acknowledgments. BLS thanks the Nebraska Workers' Compensation Court for their efforts in collecting accurate, comprehensive, and useful data on fatal work injuries. BLS also appreciates the efforts of all federal, state, local, and private sector entities that provided source documents used to identify fatal work injuries nationally. See the national CFOI release Technical Notes for details on cooperating entities.
If you are deaf, hard of hearing, or have a speech disability, please dial 7-1-1 to access telecommunications relay services.
| Event or Exposure (1) | 2023 | 2024 | |
|---|---|---|---|
| Number | Number | Percent (%) | |
|
All events and exposures |
46 | 25 | 100 |
|
Transportation incidents |
21 | 17 | 68 |
|
Rail vehicle incidents |
-- | 3 | 12 |
|
Pedestrian incidents involving motorized land vehicles |
-- | 2 | 8 |
|
Pedestrian struck by vehicle in nonroadway area |
-- | 2 | 8 |
|
Pedestrian struck by vehicle or object propelled by another vehicle in nonroadway area |
-- | 1 | 4 |
|
Pedestrian struck by vehicle backing up in nonroadway area |
-- | 1 | 4 |
|
Roadway incidents involving motorized land vehicle |
13 | 10 | 40 |
|
Roadway collision with other vehicle(s) |
8 | 7 | 28 |
|
Roadway collision with other vehicle(s)-moving in opposite directions, oncoming |
3 | 3 | 12 |
|
Contact incidents |
8 | 3 | 12 |
|
Footnotes: |
|||
|
Note: The Census of Fatal Occupational Injuries (CFOI) has published data on fatal occupational injuries for the United States since 1992. During this time, the classification systems and definitions of many data elements have changed. See the CFOI Definitions page (www.bls.gov/iif/definitions/census-of-fatal-occupational-injuries-definitions.htm) for a more detailed description of each data element. Data for all years are revised and final. Totals for major categories may include subcategories not shown separately. Dashes indicate no data reported or data that do not meet publication criteria. CFOI fatal injury counts exclude illness-related deaths unless precipitated by an injury event. |
|||
| Industry | 2023 | 2024 | |
|---|---|---|---|
| Number | Number | Percent (%) | |
|
Total |
46 | 25 | 100 |
|
Private industry (1) |
42 | 22 | 88 |
|
Natural resources and mining |
11 | 3 | 12 |
|
Agriculture, forestry, fishing and hunting |
11 | 3 | 12 |
|
Crop production |
6 | 3 | 12 |
|
Other crop farming |
-- | 1 | 4 |
|
Construction |
4 | 4 | 16 |
|
Construction |
4 | 4 | 16 |
|
Specialty trade contractors |
-- | 1 | 4 |
|
Foundation, structure, and building exterior contractors |
-- | 1 | 4 |
|
Roofing contractors |
-- | 1 | 4 |
|
Manufacturing |
4 | -- | -- |
|
Trade, transportation, and utilities |
-- | 12 | 48 |
|
Wholesale trade |
6 | 2 | 8 |
|
Transportation and warehousing |
4 | 10 | 40 |
|
Truck transportation |
3 | 5 | 20 |
|
Transit and ground passenger transportation |
-- | 3 | 12 |
|
Information |
-- | -- | -- |
|
Financial activities |
-- | 1 | 4 |
|
Finance and insurance |
-- | 1 | 4 |
|
Insurance carriers and related activities |
-- | 1 | 4 |
|
Professional and business services |
3 | -- | -- |
|
Educational and health services |
1 | -- | -- |
|
Leisure and hospitality |
-- | 2 | 8 |
|
Arts, entertainment, and recreation |
-- | 2 | 8 |
|
Amusement, gambling, and recreation industries |
-- | 2 | 8 |
|
Other amusement and recreation industries |
-- | 2 | 8 |
|
Other services (except public administration) |
1 | -- | -- |
|
Government (2) |
4 | 3 | 12 |
|
Federal government |
-- | -- | -- |
|
State government |
3 | -- | -- |
|
Local government |
-- | -- | -- |
|
Footnotes: |
|||
|
Note: The Census of Fatal Occupational Injuries (CFOI) has published data on fatal occupational injuries for the United States since 1992. During this time, the classification systems and definitions of many data elements have changed. See the CFOI Definitions page (www.bls.gov/iif/definitions/census-of-fatal-occupational-injuries-definitions.htm) for a more detailed description of each data element. Data for all years are revised and final. Totals for major categories may include subcategories not shown separately. Dashes indicate no data reported or data that do not meet publication criteria. CFOI fatal injury counts exclude illness-related deaths unless precipitated by an injury event. |
|||
| Occupation (1) | 2023 | 2024 | |
|---|---|---|---|
| Number | Number | Percent (%) | |
|
All occupations |
46 | 25 | 100 |
|
Management occupations |
9 | 4 | 16 |
|
Other management occupations |
8 | 4 | 16 |
|
Farmers, ranchers, and other agricultural managers |
-- | 4 | 16 |
|
Farmers, ranchers, and other agricultural managers |
-- | 4 | 16 |
|
Business and financial operations occupations |
-- | 1 | 4 |
|
Business operations specialists |
-- | 1 | 4 |
|
Construction and extraction occupations |
-- | 4 | 16 |
|
Construction trades workers |
-- | 4 | 16 |
|
Transportation and material moving occupations |
14 | 11 | 44 |
|
Motor vehicle operators |
7 | 8 | 32 |
|
Driver/sales workers and truck drivers |
6 | 4 | 16 |
|
Heavy and tractor-trailer truck drivers |
4 | 4 | 16 |
|
Material moving workers |
6 | 1 | 4 |
|
Laborers and material movers |
4 | 1 | 4 |
|
Laborers and freight, stock, and material movers, hand |
4 | 1 | 4 |
|
Footnotes: |
|||
|
Note: The Census of Fatal Occupational Injuries (CFOI) has published data on fatal occupational injuries for the United States since 1992. During this time, the classification systems and definitions of many data elements have changed. See the CFOI Definitions page (www.bls.gov/iif/definitions/census-of-fatal-occupational-injuries-definitions.htm) for a more detailed description of each data element. Data for all years are revised and final. Totals for major categories may include subcategories not shown separately. Dashes indicate no data reported or data that do not meet publication criteria. CFOI fatal injury counts exclude illness-related deaths unless precipitated by an injury event. |
|||
| Demographic | 2023 | 2024 | |
|---|---|---|---|
| Number | Number | Percent (%) | |
|
Total |
46 | 25 | 100 |
|
Employee status |
|||
|
Wage and salary workers (1) |
37 | 21 | 84 |
|
Self-employed (2) |
9 | 4 | 16 |
|
Sex |
|||
|
Male |
43 | -- | -- |
|
Female |
3 | -- | -- |
|
Age (3) |
|||
|
Under 16 years |
-- | -- | -- |
|
16 to 17 years |
-- | -- | -- |
|
18 to 19 years |
-- | -- | -- |
|
20 to 24 years |
5 | -- | -- |
|
25 to 34 years |
7 | -- | -- |
|
35 to 44 years |
8 | 4 | 16 |
|
45 to 54 years |
7 | 5 | 20 |
|
55 to 64 years |
8 | -- | -- |
|
65 years and over |
11 | 9 | 36 |
|
Race or ethnic origin (4) |
|||
|
White, non-Hispanic |
-- | -- | -- |
|
Black or African-American, non-Hispanic |
-- | -- | -- |
|
Hispanic or Latino |
-- | 3 | 12 |
|
American Indian or Alaska Native, non-Hispanic |
-- | -- | -- |
|
Asian, non-Hispanic |
-- | -- | -- |
|
Native Hawaiian or Pacific Islander, non-Hispanic |
-- | -- | -- |
|
Person of multiple races, non-Hispanic |
-- | -- | -- |
|
Other or not reported, non-Hispanic |
43 | 20 | 80 |
|
Footnotes: |
|||
|
Note: The Census of Fatal Occupational Injuries (CFOI) has published data on fatal occupational injuries for the United States since 1992. During this time, the classification systems and definitions of many data elements have changed. See the CFOI Definitions page (www.bls.gov/iif/definitions/census-of-fatal-occupational-injuries-definitions.htm) for a more detailed description of each data element. Data for all years are revised and final. Totals for major categories may include subcategories not shown separately. Dashes indicate no data reported or data that do not meet publication criteria. CFOI fatal injury counts exclude illness-related deaths unless precipitated by an injury event. |
|||
Last Modified Date: Friday, March 27, 2026