An official website of the United States government
An official website of the United States government
The .gov means it's official.
Federal government websites often end in .gov or .mil. Before sharing sensitive information,
make sure you're on a federal government site.
The site is secure.
The
https:// ensures that you are connecting to the official website and that any
information you provide is encrypted and transmitted securely.
26-447-CHI
Friday, March 27, 2026
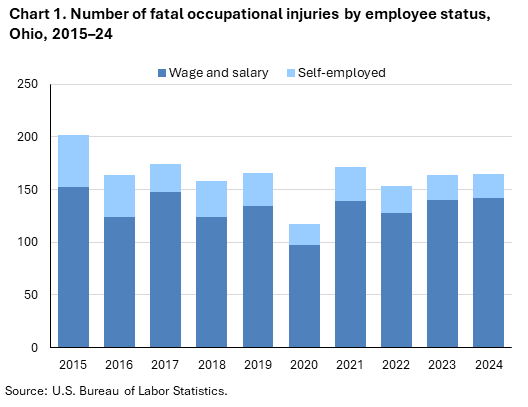
Fatal work injuries totaled 165 in 2024 for Ohio, the U.S. Bureau of Labor Statistics reported today. Assistant Commissioner for Regional Operations Michael Hirniak noted that the number of work-related fatalities in Ohio was similar to the 164 reported in 2023. (See chart 1.) The fatal work injury rate was 3.2 fatalities per 100,000 full-time equivalent (FTE) workers in 2024, compared to a rate of 3.1 in 2023. Nationwide, a total of 5,070 fatal work injuries were recorded in 2024, a 4.0-percent decrease from 5,283 in 2023. These data are from the Census of Fatal Occupational Injuries (CFOI).
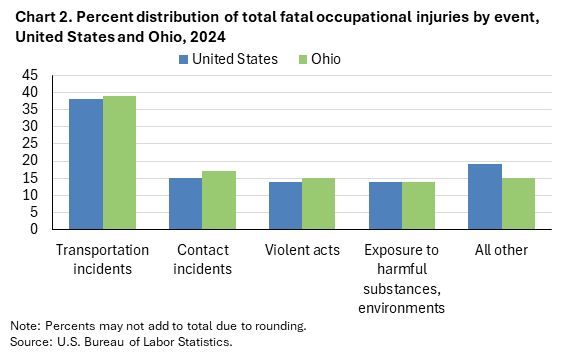
Transportation incidents (64) were the most frequent type of fatal event in Ohio, accounting for 39 percent of all fatal work injuries in the state. Nationally the share was 38 percent. Worker deaths from transportation incidents were up from 51 over the year. (See chart 2 and table 1.)
Contact incidents (28) accounted for 17 percent of Ohio worker fatalities; nationally the share was 15 percent.
The transportation and warehousing sector had the highest number of fatalities with 29, up from 19 the previous year. (See table 2.)
Transportation incidents resulted in 22 of the 29 transportation and warehousing sector fatalities.
The truck transportation subsector accounted for 24 of the sector’s fatal workplace injuries.
The transportation and material moving occupational group had the highest number of fatal workplace injuries with 51, up from 39 in 2023. (See table 3.)
Transportation incidents were the most frequent type of fatal event among transportation and material moving workers, resulting in 36 fatalities. Heavy and tractor-trailer truck drivers accounted for 32 of the major group’s 51 fatal workplace injuries.
Wage and salary workers accounted for 86 percent of fatal workplace injuries in Ohio; the self-employed comprised the remaining 14 percent. (See chart 1 and table 4.) Nationally, wage and salary workers comprised 82 percent of fatalities.
Males accounted for 90 percent of the work-related fatalities in Ohio and 92 percent nationally.
White non-Hispanics accounted for 75 percent of those who died from a workplace injury. Nationwide, this group accounted for 56 percent of work-related deaths.
Workers 35-44 years old had a 25 percent increase in worker fatalities from 32 in 2023 to 40 in 2024.
Background of the program. The Census of Fatal Occupational Injuries (CFOI), part of the Bureau of Labor Statistics (BLS) Occupational Safety and Health Statistics (OSHS) program, is a count of all fatalities resulting from workplace injuries occurring in the U.S. during the calendar year. For technical information and definitions for the CFOI, see the national CFOI release Technical notes, the BLS Handbook of Methods, and the CFOI definitions.
Acknowledgments. BLS thanks the Ohio BWC Division of Safety and Hygiene for their efforts in collecting accurate, comprehensive, and useful data on fatal work injuries. BLS also appreciates the efforts of all federal, state, local, and private sector entities that provided source documents used to identify fatal work injuries nationally. See the national CFOI release Technical Notes for details on cooperating entities.
If you are deaf, hard of hearing, or have a speech disability, please dial 7-1-1 to access telecommunications relay services.
| Event or Exposure (1) | 2023 | 2024 | |
|---|---|---|---|
| Number | Number | Percent (%) | |
|
All events and exposures |
164 | 165 | 100 |
|
Violent acts |
-- | 25 | 15 |
|
Homicides (violent acts by other person) |
-- | 17 | 10 |
|
Shooting by other person |
-- | 14 | 8 |
|
Suicides (intentional self-harm) |
-- | 8 | 5 |
|
Intentional self-harm-- shooting |
-- | 8 | 5 |
|
Transportation incidents |
51 | 64 | 39 |
|
Aircraft incidents |
-- | 1 | 1 |
|
In-flight crash, collision |
-- | 1 | 1 |
|
In-flight crash due to mechanical failure |
-- | 1 | 1 |
|
Pedestrian incidents involving motorized land vehicles |
4 | 6 | 4 |
|
Pedestrian struck by vehicle in roadway |
-- | 1 | 1 |
|
Pedestrian struck by forward-moving vehicle in roadway |
-- | 1 | 1 |
|
Pedestrian struck by vehicle in nonroadway area |
-- | 3 | 2 |
|
Roadway incidents involving motorized land vehicle |
33 | 49 | 30 |
|
Roadway collision with other vehicle(s) |
15 | 33 | 20 |
|
Roadway collision with other vehicle(s)-intersecting, turning |
-- | 13 | 8 |
|
Roadway collision with other vehicle(s)-moving in same direction |
-- | 4 | 2 |
|
Roadway collision with other vehicle(s)-moving in opposite directions, oncoming |
7 | 14 | 8 |
|
Roadway collision with other vehicle(s)-moving and standing vehicle |
-- | 2 | 1 |
|
Roadway collision with object other than vehicle |
13 | 10 | 6 |
|
Collision with stationary object in roadway |
1 | 1 | 1 |
|
Collision with object or animal on side of roadway |
7 | 6 | 4 |
|
Roadway noncollision incident |
5 | 6 | 4 |
|
Roadway noncollision- vehicle overturn |
4 | 3 | 2 |
|
Nonroadway incidents involving motorized land vehicles |
9 | 8 | 5 |
|
Nonroadway noncollision incident |
-- | 6 | 4 |
|
Nonroadway noncollision- vehicle overturn |
-- | 4 | 2 |
|
Nonroadway noncollision- fall or jump from and struck by moving vehicle |
-- | 1 | 1 |
|
Explosions and fires |
-- | 3 | 2 |
|
Falls, slips, trips |
28 | 21 | 13 |
|
Fall to lower level |
22 | 15 | 9 |
|
Other fall to lower level |
-- | 12 | 7 |
|
Other fall to lower level- less than 6 feet |
-- | 4 | 2 |
|
Other fall to lower level- 6 to 30 feet |
-- | 4 | 2 |
|
Slip, trip, stumble or fall on same level |
5 | 6 | 4 |
|
Fall on same level |
4 | 6 | 4 |
|
Exposure to harmful substances, environments |
28 | 23 | 14 |
|
Exposure to harmful substances |
18 | 21 | 13 |
|
Drug, alcohol overdose |
16 | 19 | 12 |
|
Reaction to prescribed medication or vaccines |
-- | 1 | 1 |
|
Inhalation of harmful substance |
-- | 1 | 1 |
|
Inhalation of harmful substance- single episode or single shift |
-- | 1 | 1 |
|
Contact incidents |
30 | 28 | 17 |
|
Contact with animals |
-- | 3 | 2 |
|
Struck by propelled, falling, or suspended object |
17 | 14 | 8 |
|
Struck by propelled object or substance |
-- | 3 | 2 |
|
Struck by falling object |
14 | 9 | 5 |
|
Struck, caught, or compressed by running powered equipment |
10 | 7 | 4 |
|
Struck by running powered equipment- during maintenance, cleaning, testing |
4 | 1 | 1 |
|
Caught or entangled in running powered equipment |
3 | 3 | 2 |
|
Contact with non-running objects or equipment |
-- | 4 | 2 |
|
Footnotes: |
|||
|
Note: The Census of Fatal Occupational Injuries (CFOI) has published data on fatal occupational injuries for the United States since 1992. During this time, the classification systems and definitions of many data elements have changed. See the CFOI Definitions page (www.bls.gov/iif/definitions/census-of-fatal-occupational-injuries-definitions.htm) for a more detailed description of each data element. Data for all years are revised and final. Totals for major categories may include subcategories not shown separately. Dashes indicate no data reported or data that do not meet publication criteria. CFOI fatal injury counts exclude illness-related deaths unless precipitated by an injury event. |
|||
| Industry | 2023 | 2024 | |
|---|---|---|---|
| Number | Number | Percent (%) | |
|
Total |
164 | 165 | 100 |
|
Private industry (1) |
149 | 149 | 90 |
|
Natural resources and mining |
17 | 9 | 5 |
|
Agriculture, forestry, fishing and hunting |
13 | 7 | 4 |
|
Crop production |
9 | 3 | 2 |
|
Animal production and aquaculture |
-- | 1 | 1 |
|
Cattle ranching and farming |
-- | 1 | 1 |
|
Dairy cattle and milk production |
-- | 1 | 1 |
|
Forestry and logging |
-- | 1 | 1 |
|
Logging |
-- | 1 | 1 |
|
Logging |
-- | 1 | 1 |
|
Mining, quarrying, and oil and gas extraction |
4 | 2 | 1 |
|
Mining (except oil and gas) |
-- | 2 | 1 |
|
Nonmetallic mineral mining and quarrying |
-- | 2 | 1 |
|
Sand, gravel, clay, and ceramic and refractory minerals mining and quarrying |
-- | 1 | 1 |
|
Construction sand and gravel mining |
-- | 1 | 1 |
|
Construction |
32 | 21 | 13 |
|
Construction |
32 | 21 | 13 |
|
Construction of buildings |
4 | 6 | 4 |
|
Residential building construction |
3 | 3 | 2 |
|
Residential building construction |
3 | 3 | 2 |
|
Residential remodelers |
-- | 2 | 1 |
|
Nonresidential building construction |
-- | 3 | 2 |
|
Heavy and civil engineering construction |
8 | 1 | 1 |
|
Utility system construction |
5 | 1 | 1 |
|
Power and communication line and related structures construction |
-- | 1 | 1 |
|
Specialty trade contractors |
19 | 12 | 7 |
|
Foundation, structure, and building exterior contractors |
8 | 3 | 2 |
|
Roofing contractors |
3 | 3 | 2 |
|
Building equipment contractors |
7 | 5 | 3 |
|
Electrical contractors and other wiring installation contractors |
3 | 3 | 2 |
|
Building finishing contractors |
4 | 1 | 1 |
|
Drywall and insulation contractors |
-- | 1 | 1 |
|
Other specialty trade contractors |
-- | 3 | 2 |
|
Manufacturing |
21 | 19 | 12 |
|
Manufacturing |
21 | 19 | 12 |
|
Wood product manufacturing |
-- | 1 | 1 |
|
Other wood product manufacturing |
-- | 1 | 1 |
|
Wood container and pallet manufacturing |
-- | 1 | 1 |
|
Transportation equipment manufacturing |
4 | 6 | 4 |
|
Motor vehicle parts manufacturing |
4 | 3 | 2 |
|
Aerospace product and parts manufacturing |
-- | 1 | 1 |
|
Aerospace product and parts manufacturing |
-- | 1 | 1 |
|
Trade, transportation, and utilities |
36 | 47 | 28 |
|
Wholesale trade |
8 | 5 | 3 |
|
Retail trade |
9 | 13 | 8 |
|
Motor vehicle and parts dealers |
-- | 6 | 4 |
|
General merchandise retailers |
-- | 2 | 1 |
|
Warehouse clubs, supercenters, and other general merchandise retailers |
-- | 2 | 1 |
|
Warehouse clubs, supercenters, and other general merchandise retailers |
-- | 2 | 1 |
|
Transportation and warehousing |
19 | 29 | 18 |
|
Truck transportation |
11 | 24 | 15 |
|
General freight trucking |
7 | 12 | 7 |
|
Couriers and messengers |
-- | 1 | 1 |
|
Couriers and express delivery services |
-- | 1 | 1 |
|
Couriers and express delivery services |
-- | 1 | 1 |
|
Information |
-- | -- | -- |
|
Financial activities |
4 | -- | -- |
|
Real estate and rental and leasing |
4 | 5 | 3 |
|
Rental and leasing services |
-- | 5 | 3 |
|
Professional and business services |
-- | -- | -- |
|
Administrative and support and waste management and remediation services |
10 | 17 | 10 |
|
Administrative and support services |
-- | 13 | 8 |
|
Services to buildings and dwellings |
-- | 8 | 5 |
|
Waste management and remediation services |
-- | 4 | 2 |
|
Waste collection |
-- | 3 | 2 |
|
Waste collection |
-- | 3 | 2 |
|
Educational and health services |
8 | -- | -- |
|
Health care and social assistance |
7 | 11 | 7 |
|
Ambulatory health care services |
4 | 7 | 4 |
|
Home health care services |
-- | 3 | 2 |
|
Home health care services |
-- | 3 | 2 |
|
Leisure and hospitality |
9 | 9 | 5 |
|
Accommodation and food services |
5 | 9 | 5 |
|
Accommodation |
1 | 3 | 2 |
|
Traveler accommodation |
1 | 3 | 2 |
|
Hotels (except casino hotels) and motels |
-- | 3 | 2 |
|
Food services and drinking places |
4 | 6 | 4 |
|
Drinking places (alcoholic beverages) |
-- | 2 | 1 |
|
Drinking places (alcoholic beverages) |
-- | 2 | 1 |
|
Restaurants and other eating places |
-- | 4 | 2 |
|
Restaurants and other eating places |
-- | 4 | 2 |
|
Full-service restaurants |
-- | 2 | 1 |
|
Other services (except public administration) |
10 | 3 | 2 |
|
Other services (except public administration) |
10 | 3 | 2 |
|
Government (2) |
-- | 16 | 10 |
|
Federal government |
-- | 1 | 1 |
|
State government |
-- | 5 | 3 |
|
Local government |
13 | 10 | 6 |
|
Footnotes: |
|||
|
Note: The Census of Fatal Occupational Injuries (CFOI) has published data on fatal occupational injuries for the United States since 1992. During this time, the classification systems and definitions of many data elements have changed. See the CFOI Definitions page (www.bls.gov/iif/definitions/census-of-fatal-occupational-injuries-definitions.htm) for a more detailed description of each data element. Data for all years are revised and final. Totals for major categories may include subcategories not shown separately. Dashes indicate no data reported or data that do not meet publication criteria. CFOI fatal injury counts exclude illness-related deaths unless precipitated by an injury event. |
|||
| Occupation (1) | 2023 | 2024 | |
|---|---|---|---|
| Number | Number | Percent (%) | |
|
All occupations |
164 | 165 | 100 |
|
Management occupations |
18 | 15 | 9 |
|
Advertising, marketing, promotions, public relations, and sales managers |
-- | 4 | 2 |
|
Marketing and sales managers |
-- | 4 | 2 |
|
Other management occupations |
15 | 9 | 5 |
|
Farmers, ranchers, and other agricultural managers |
11 | 6 | 4 |
|
Farmers, ranchers, and other agricultural managers |
11 | 6 | 4 |
|
Healthcare practitioners and technical occupations |
4 | 3 | 2 |
|
Healthcare support occupations |
-- | 5 | 3 |
|
Home health and personal care aides; and nursing assistants, orderlies, and psychiatric aides |
-- | 5 | 3 |
|
Protective service occupations |
10 | 12 | 7 |
|
Other protective service workers |
4 | 4 | 2 |
|
Security guards and gambling surveillance officers |
-- | 4 | 2 |
|
Security guards |
-- | 4 | 2 |
|
Food preparation and serving related occupations |
4 | 2 | 1 |
|
Supervisors of food preparation and serving workers |
-- | 1 | 1 |
|
Supervisors of food preparation and serving workers |
-- | 1 | 1 |
|
Chefs and head cooks |
-- | 1 | 1 |
|
Cooks and food preparation workers |
-- | 1 | 1 |
|
Building and grounds cleaning and maintenance occupations |
8 | 12 | 7 |
|
Grounds maintenance workers |
-- | 8 | 5 |
|
Grounds maintenance workers |
-- | 8 | 5 |
|
Landscaping and groundskeeping workers |
-- | 5 | 3 |
|
Sales and related occupations |
6 | 5 | 3 |
|
Supervisors of sales workers |
-- | 2 | 1 |
|
First-line supervisors of sales workers |
-- | 2 | 1 |
|
First-line supervisors of retail sales workers |
-- | 1 | 1 |
|
First-line supervisors of non-retail sales workers |
-- | 1 | 1 |
|
Office and administrative support occupations |
1 | 4 | 2 |
|
Information and record clerks |
1 | 1 | 1 |
|
Hotel, motel, and resort desk clerks |
-- | 1 | 1 |
|
Hotel, motel, and resort desk clerks |
-- | 1 | 1 |
|
Farming, fishing, and forestry occupations |
-- | 1 | 1 |
|
Forest, conservation, and logging workers |
-- | 1 | 1 |
|
Logging workers |
-- | 1 | 1 |
|
Fallers |
-- | 1 | 1 |
|
Construction and extraction occupations |
26 | 24 | 15 |
|
Construction trades workers |
21 | 20 | 12 |
|
Construction laborers |
8 | 7 | 4 |
|
Construction laborers |
8 | 7 | 4 |
|
Construction equipment operators |
-- | 3 | 2 |
|
Electricians |
3 | 4 | 2 |
|
Electricians |
3 | 4 | 2 |
|
Insulation workers |
-- | 1 | 1 |
|
Roofers |
3 | 3 | 2 |
|
Roofers |
3 | 3 | 2 |
|
Installation, maintenance, and repair occupations |
16 | 10 | 6 |
|
Vehicle and mobile equipment mechanics, installers, and repairers |
6 | 3 | 2 |
|
Small engine mechanics |
-- | 1 | 1 |
|
Outdoor power equipment and other small engine mechanics |
-- | 1 | 1 |
|
Other installation, maintenance, and repair occupations |
10 | 7 | 4 |
|
Maintenance and repair workers, general |
-- | 1 | 1 |
|
Maintenance and repair workers, general |
-- | 1 | 1 |
|
Production occupations |
14 | 12 | 7 |
|
Metal workers and plastic workers |
5 | 3 | 2 |
|
Other production occupations |
4 | 7 | 4 |
|
Transportation and material moving occupations |
39 | 51 | 31 |
|
Motor vehicle operators |
26 | 44 | 27 |
|
Driver/sales workers and truck drivers |
23 | 44 | 27 |
|
Heavy and tractor-trailer truck drivers |
14 | 32 | 19 |
|
Material moving workers |
9 | 5 | 3 |
|
Footnotes: |
|||
|
Note: The Census of Fatal Occupational Injuries (CFOI) has published data on fatal occupational injuries for the United States since 1992. During this time, the classification systems and definitions of many data elements have changed. See the CFOI Definitions page (www.bls.gov/iif/definitions/census-of-fatal-occupational-injuries-definitions.htm) for a more detailed description of each data element. Data for all years are revised and final. Totals for major categories may include subcategories not shown separately. Dashes indicate no data reported or data that do not meet publication criteria. CFOI fatal injury counts exclude illness-related deaths unless precipitated by an injury event. |
|||
| Demographic | 2023 | 2024 | |
|---|---|---|---|
| Number | Number | Percent (%) | |
|
Total |
164 | 165 | 100 |
|
Employee status |
|||
|
Wage and salary workers (1) |
140 | 142 | 86 |
|
Self-employed (2) |
24 | 23 | 14 |
|
Sex |
|||
|
Male |
150 | 148 | 90 |
|
Female |
14 | 17 | 10 |
|
Age (3) |
|||
|
Under 16 years |
-- | -- | -- |
|
16 to 17 years |
-- | -- | -- |
|
18 to 19 years |
2 | 2 | 1 |
|
20 to 24 years |
6 | 6 | 4 |
|
25 to 34 years |
31 | 26 | 16 |
|
35 to 44 years |
32 | 40 | 24 |
|
45 to 54 years |
32 | 27 | 16 |
|
55 to 64 years |
29 | 32 | 19 |
|
65 years and over |
32 | 31 | 19 |
|
Race or ethnic origin (4) |
|||
|
White, non-Hispanic |
126 | 123 | 75 |
|
Black or African-American, non-Hispanic |
19 | 22 | 13 |
|
Hispanic or Latino |
13 | 13 | 8 |
|
American Indian or Alaska Native, non-Hispanic |
-- | -- | -- |
|
Asian, non-Hispanic |
6 | 2 | 1 |
|
Native Hawaiian or Pacific Islander, non-Hispanic |
-- | -- | -- |
|
Person of multiple races, non-Hispanic |
-- | 3 | 2 |
|
Other or not reported, non-Hispanic |
-- | -- | -- |
|
Footnotes: |
|||
|
Note: The Census of Fatal Occupational Injuries (CFOI) has published data on fatal occupational injuries for the United States since 1992. During this time, the classification systems and definitions of many data elements have changed. See the CFOI Definitions page (www.bls.gov/iif/definitions/census-of-fatal-occupational-injuries-definitions.htm) for a more detailed description of each data element. Data for all years are revised and final. Totals for major categories may include subcategories not shown separately. Dashes indicate no data reported or data that do not meet publication criteria. CFOI fatal injury counts exclude illness-related deaths unless precipitated by an injury event. |
|||
Last Modified Date: Friday, March 27, 2026