An official website of the United States government
An official website of the United States government
The .gov means it's official.
Federal government websites often end in .gov or .mil. Before sharing sensitive information,
make sure you're on a federal government site.
The site is secure.
The
https:// ensures that you are connecting to the official website and that any
information you provide is encrypted and transmitted securely.
26-472-CHI
Friday, March 27, 2026
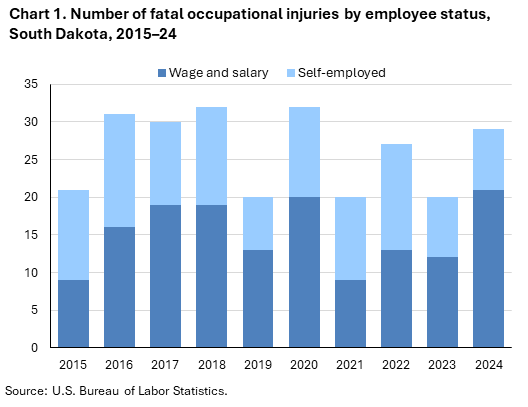
Fatal work injuries totaled 29 in 2024 for South Dakota, the U.S. Bureau of Labor Statistics reported today. Assistant Commissioner for Regional Operations Michael Hirniak noted that the number of work-related fatalities in South Dakota was up 45.0 percent from 20 in 2023. (See chart 1.) The fatal work injury rate was 5.8 fatalities per 100,000 full-time equivalent (FTE) workers in 2024, an increase from a rate of 4.3 in 2023. Nationwide, a total of 5,070 fatal work injuries were recorded in 2024, a 4.0-percent decrease from 5,283 in 2023. These data are from the Census of Fatal Occupational Injuries (CFOI).
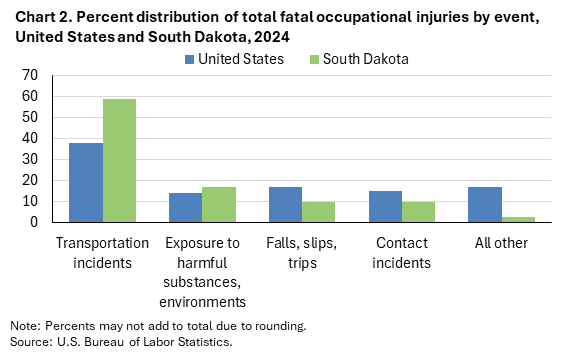
Transportation incidents (17) were the most frequent type of fatal event in South Dakota, accounting for 59 percent of all fatal work injuries in the state. Nationally the share was 38 percent. Worker deaths from transportation incidents were up from nine over the year. (See chart 2 and table 1.)
The construction sector had the highest number of fatalities with nine, up from four the previous year. (See table 2.) Transportation incidents resulted in 4 of the 9 construction sector fatalities. The specialty trade contractors subsector accounted for five of the sector’s fatal workplace injuries.
The agriculture, forestry, fishing and hunting sector had eight fatalities. (See table 2.) The crop production subsector accounted for five of the sector’s fatal workplace injuries.
Construction and extraction workers experienced the largest increase (+5) in fatal work injuries over the year among the major occupational groups. (See table 3.) This occupational group also had the highest number of fatal workplace injuries with nine. Transportation incidents resulted in four fatal work injuries among these workers. Construction trades workers accounted for seven of the major group’s nine fatal workplace injuries.
Wage and salary workers accounted for 72 percent of fatal workplace injuries in South Dakota; the self-employed comprised the remaining 28 percent. (See chart 1 and table 4.) Nationally, wage and salary workers comprised 82 percent of fatalities.
White non-Hispanics accounted for 83 percent of those who died from a workplace injury. Nationwide, this group accounted for 56 percent of work-related deaths.
Workers 25-54 years old accounted for 55 percent of the state’s work-related fatalities, the same as the national share. Workers aged 55 years and older accounted for 28 percent of the state’s work-related fatalities in 2024, compared to 37 percent of on-the-job fatalities nationally.
Workers 55 years and older had a decrease in worker fatalities from 12 in 2023 to 8 in 2024.
Background of the program. The Census of Fatal Occupational Injuries (CFOI), part of the Bureau of Labor Statistics (BLS) Occupational Safety and Health Statistics (OSHS) program, is a count of all fatalities resulting from workplace injuries occurring in the U.S. during the calendar year. For technical information and definitions for the CFOI, see the national CFOI release Technical notes, the BLS Handbook of Methods, and the CFOI definitions.
Acknowledgments. BLS appreciates the efforts of all federal, state, local, and private sector entities that provided source documents used to identify fatal work injuries nationally. See the national CFOI release Technical Notes for details on cooperating entities.
If you are deaf, hard of hearing, or have a speech disability, please dial 7-1-1 to access telecommunications relay services.
| Event or Exposure (1) | 2023 | 2024 | |
|---|---|---|---|
| Number | Number | Percent (%) | |
|
All events and exposures |
20 | 29 | 100 |
|
Violent acts |
-- | -- | -- |
|
Transportation incidents |
9 | 17 | 59 |
|
Roadway incidents involving motorized land vehicle |
6 | 12 | 41 |
|
Roadway collision with other vehicle(s) |
4 | 9 | 31 |
|
Roadway collision with other vehicle(s)-moving in opposite directions, oncoming |
2 | 5 | 17 |
|
Explosions and fires |
-- | -- | -- |
|
Falls, slips, trips |
-- | 3 | 10 |
|
Exposure to harmful substances, environments |
-- | 5 | 17 |
|
Contact incidents |
5 | 3 | 10 |
|
Overexertion, repetitive motion, and bodily condition |
-- | -- | -- |
|
Footnotes: |
|||
|
Note: The Census of Fatal Occupational Injuries (CFOI) has published data on fatal occupational injuries for the United States since 1992. During this time, the classification systems and definitions of many data elements have changed. See the CFOI Definitions page (www.bls.gov/iif/definitions/census-of-fatal-occupational-injuries-definitions.htm) for a more detailed description of each data element. Data for all years are revised and final. Totals for major categories may include subcategories not shown separately. Dashes indicate no data reported or data that do not meet publication criteria. CFOI fatal injury counts exclude illness-related deaths unless precipitated by an injury event. |
|||
| Industry | 2023 | 2024 | |
|---|---|---|---|
| Number | Number | Percent (%) | |
|
Total |
20 | 29 | 100 |
|
Private industry (1) |
19 | 28 | 97 |
|
Natural resources and mining |
-- | 8 | 28 |
|
Agriculture, forestry, fishing and hunting |
7 | 8 | 28 |
|
Crop production |
6 | 5 | 17 |
|
Oilseed and grain farming |
4 | 3 | 10 |
|
Other grain farming |
-- | 2 | 7 |
|
Oilseed and grain combination farming |
-- | 2 | 7 |
|
Animal production and aquaculture |
1 | 3 | 10 |
|
Cattle ranching and farming |
1 | 3 | 10 |
|
Beef cattle ranching and farming, including feedlots |
-- | 2 | 7 |
|
Construction |
4 | 9 | 31 |
|
Construction |
4 | 9 | 31 |
|
Specialty trade contractors |
-- | 5 | 17 |
|
Foundation, structure, and building exterior contractors |
-- | 3 | 10 |
|
Manufacturing |
-- | 1 | 3 |
|
Manufacturing |
-- | 1 | 3 |
|
Food manufacturing |
-- | 1 | 3 |
|
Grain and oilseed milling |
-- | 1 | 3 |
|
Trade, transportation, and utilities |
-- | 9 | 31 |
|
Transportation and warehousing |
-- | 4 | 14 |
|
Information |
-- | -- | -- |
|
Financial activities |
-- | -- | -- |
|
Professional and business services |
-- | -- | -- |
|
Educational and health services |
1 | -- | -- |
|
Leisure and hospitality |
-- | -- | -- |
|
Other services (except public administration) |
1 | -- | -- |
|
Government (2) |
1 | 1 | 3 |
|
Federal government |
-- | -- | -- |
|
State government |
-- | -- | -- |
|
Local government |
1 | 1 | 3 |
|
Footnotes: |
|||
|
Note: The Census of Fatal Occupational Injuries (CFOI) has published data on fatal occupational injuries for the United States since 1992. During this time, the classification systems and definitions of many data elements have changed. See the CFOI Definitions page (www.bls.gov/iif/definitions/census-of-fatal-occupational-injuries-definitions.htm) for a more detailed description of each data element. Data for all years are revised and final. Totals for major categories may include subcategories not shown separately. Dashes indicate no data reported or data that do not meet publication criteria. CFOI fatal injury counts exclude illness-related deaths unless precipitated by an injury event. |
|||
| Occupation (1) | 2023 | 2024 | |
|---|---|---|---|
| Number | Number | Percent (%) | |
|
All occupations |
20 | 29 | 100 |
|
Management occupations |
5 | 4 | 14 |
|
Other management occupations |
5 | 4 | 14 |
|
Business and financial operations occupations |
-- | -- | -- |
|
Computer and mathematical occupations |
-- | -- | -- |
|
Architecture and engineering occupations |
-- | -- | -- |
|
Life, physical, and social science occupations |
-- | -- | -- |
|
Community and social service occupations |
-- | -- | -- |
|
Legal occupations |
-- | -- | -- |
|
Educational instruction and library occupations |
-- | -- | -- |
|
Arts, design, entertainment, sports, and media occupations |
-- | -- | -- |
|
Healthcare practitioners and technical occupations |
1 | -- | -- |
|
Healthcare support occupations |
-- | -- | -- |
|
Protective service occupations |
-- | -- | -- |
|
Food preparation and serving related occupations |
-- | -- | -- |
|
Building and grounds cleaning and maintenance occupations |
-- | -- | -- |
|
Personal care and service occupations |
-- | -- | -- |
|
Sales and related occupations |
-- | -- | -- |
|
Office and administrative support occupations |
-- | -- | -- |
|
Farming, fishing, and forestry occupations |
-- | 5 | 17 |
|
Agricultural workers |
-- | 5 | 17 |
|
Miscellaneous agricultural workers |
-- | 5 | 17 |
|
Construction and extraction occupations |
4 | 9 | 31 |
|
Construction trades workers |
4 | 7 | 24 |
|
Carpet, floor, and tile installers and finishers |
-- | 1 | 3 |
|
Carpet installers |
-- | 1 | 3 |
|
Pipelayers, plumbers, pipefitters, and steamfitters |
-- | 1 | 3 |
|
Plumbers, pipefitters, and steamfitters |
-- | 1 | 3 |
|
Other construction and related workers |
-- | 1 | 3 |
|
Construction and building inspectors |
-- | 1 | 3 |
|
Construction and building inspectors |
-- | 1 | 3 |
|
Extraction workers |
-- | 1 | 3 |
|
Surface mining machine operators and earth drillers |
-- | 1 | 3 |
|
Earth drillers, except oil and gas |
-- | 1 | 3 |
|
Installation, maintenance, and repair occupations |
-- | 3 | 10 |
|
Production occupations |
-- | -- | -- |
|
Transportation and material moving occupations |
5 | 4 | 14 |
|
Motor vehicle operators |
-- | 4 | 14 |
|
Driver/sales workers and truck drivers |
-- | 4 | 14 |
|
Heavy and tractor-trailer truck drivers |
-- | 4 | 14 |
|
Footnotes: |
|||
|
Note: The Census of Fatal Occupational Injuries (CFOI) has published data on fatal occupational injuries for the United States since 1992. During this time, the classification systems and definitions of many data elements have changed. See the CFOI Definitions page (www.bls.gov/iif/definitions/census-of-fatal-occupational-injuries-definitions.htm) for a more detailed description of each data element. Data for all years are revised and final. Totals for major categories may include subcategories not shown separately. Dashes indicate no data reported or data that do not meet publication criteria. CFOI fatal injury counts exclude illness-related deaths unless precipitated by an injury event. |
|||
| Demographic | 2023 | 2024 | |
|---|---|---|---|
| Number | Number | Percent (%) | |
|
Total |
20 | 29 | 100 |
|
Employee status |
|||
|
Wage and salary workers (1) |
12 | 21 | 72 |
|
Self-employed (2) |
8 | 8 | 28 |
|
Sex |
|||
|
Male |
-- | 26 | 90 |
|
Female |
-- | 3 | 10 |
|
Age (3) |
|||
|
Under 16 years |
-- | -- | -- |
|
16 to 17 years |
-- | -- | -- |
|
18 to 19 years |
-- | -- | -- |
|
20 to 24 years |
-- | 3 | 10 |
|
25 to 34 years |
-- | 4 | 14 |
|
35 to 44 years |
-- | 6 | 21 |
|
45 to 54 years |
5 | 6 | 21 |
|
55 to 64 years |
5 | 3 | 10 |
|
65 years and over |
7 | 5 | 17 |
|
Race or ethnic origin (4) |
|||
|
White, non-Hispanic |
17 | 24 | 83 |
|
Black or African-American, non-Hispanic |
-- | -- | -- |
|
Hispanic or Latino |
-- | 5 | 17 |
|
American Indian or Alaska Native, non-Hispanic |
-- | -- | -- |
|
Asian, non-Hispanic |
-- | -- | -- |
|
Native Hawaiian or Pacific Islander, non-Hispanic |
-- | -- | -- |
|
Person of multiple races, non-Hispanic |
-- | -- | -- |
|
Other or not reported, non-Hispanic |
-- | -- | -- |
|
Footnotes: |
|||
|
Note: The Census of Fatal Occupational Injuries (CFOI) has published data on fatal occupational injuries for the United States since 1992. During this time, the classification systems and definitions of many data elements have changed. See the CFOI Definitions page (www.bls.gov/iif/definitions/census-of-fatal-occupational-injuries-definitions.htm) for a more detailed description of each data element. Data for all years are revised and final. Totals for major categories may include subcategories not shown separately. Dashes indicate no data reported or data that do not meet publication criteria. CFOI fatal injury counts exclude illness-related deaths unless precipitated by an injury event. |
|||
Last Modified Date: Friday, March 27, 2026