An official website of the United States government
An official website of the United States government
The .gov means it's official.
Federal government websites often end in .gov or .mil. Before sharing sensitive information,
make sure you're on a federal government site.
The site is secure.
The
https:// ensures that you are connecting to the official website and that any
information you provide is encrypted and transmitted securely.
25-1084-KAN
Wednesday, July 02, 2025
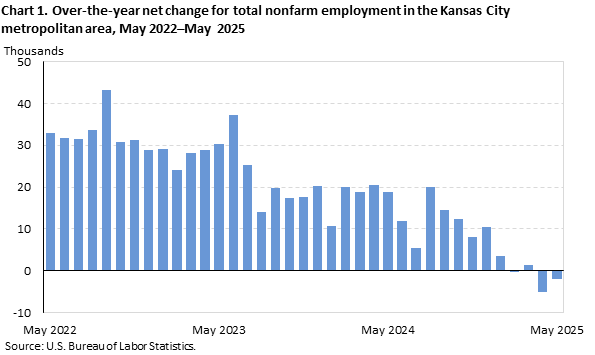
Total nonfarm employment for the Kansas City, MO-KS, metropolitan area stood at 1,154,600 in May, the U.S. Bureau of Labor Statistics reported today. (See chart 1 and table 1.) Assistant Commissioner for Regional Operations Michael Hirniak noted that employment in the Kansas City area was little changed over the year, while the national rate of job gain was 1.1 percent. (All data in this release are not seasonally adjusted; accordingly, over-the-year analysis is used throughout.)
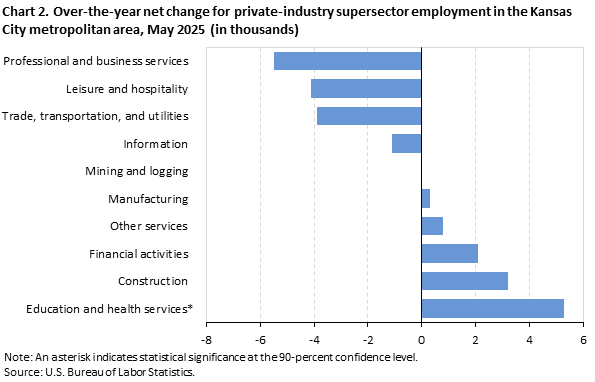
Industry employmentIn Kansas City, MO-KS, education and health services had the only significant gain (+5,300) among the metropolitan area’s private-industry supersectors. Employment gain within this supersector was concentrated in the health care and social assistance sector (+5,700). (See chart 2.) The 3.0-percent increase in the metropolitan area’s education and health services supersector compared to the 3.5-percent gain on a national level.
The Metropolitan Area Employment and Unemployment release for June 2025 is scheduled to be released on Wednesday, July 30, 2025, at 9:00 a.m. (CT).
This release presents nonfarm payroll employment estimates from the CES program. More information about the CES data is available in the State Employment and Unemployment Summary and the Metropolitan Area Employment and Unemployment Summary. See the Metropolitan Area Employment and Unemployment Technical Note for more information on definitions and methodology.
Reliability of the employment estimates. The estimates presented in this release are based on sample surveys, administrative data, and modeling and, thus, are subject to sampling and other types of errors. Changes in metropolitan area nonfarm payroll employment are cited in the analysis of this release only if they have been determined to be statistically significant at the 90-percent confidence level. Documentation on the reliability of state and area estimates is available for metropolitan areas and metropolitan divisions.
Area definitions. The substate area data published in this news release reflect the U.S. Office of Management and Budget delineations issued on July 21, 2023.
The Kansas City, MO-KS Metropolitan Statistical Area includes Bates, Caldwell, Cass, Clay, Clinton, Jackson, Lafayette, Platte, and Ray Counties in Missouri and Johnson, Leavenworth, Linn, Miami, and Wyandotte Counties in Kansas.
Additional information
Employment data from the CES program are available on the BLS website at www.bls.gov/sae/.
Information in this release will be made available to individuals with sensory impairments upon request. Voice phone: (202) 691-5200; Telecommunications Relay Service: 7-1-1.
| Area and Industry |
May 2024 |
Mar 2025 |
Apr 2025 |
May 2025(p) |
May 2024 to May 2025(p) |
|
|---|---|---|---|---|---|---|
| Net change | Percent change | |||||
|
United States |
||||||
|
Total nonfarm |
158,256 | 158,402 | 159,238 | 159,964 | 1,708 | 1.1 |
|
Mining and logging |
624 | 619 | 621 | 624 | 0 | 0.0 |
|
Construction |
8,237 | 8,071 | 8,218 | 8,354 | 117 | 1.4 |
|
Manufacturing |
12,829 | 12,714 | 12,721 | 12,740 | -89 | -0.7 |
|
Trade, transportation, and utilities |
28,794 | 28,862 | 28,848 | 28,954 | 160 | 0.6 |
|
Information |
2,939 | 2,921 | 2,921 | 2,928 | -11 | -0.4 |
|
Financial activities |
9,126 | 9,180 | 9,186 | 9,223 | 97 | 1.1 |
|
Professional and business services |
22,682 | 22,351 | 22,571 | 22,618 | -64 | -0.3 |
|
Education and health services |
26,375 | 27,222 | 27,337 | 27,296 | 921 | 3.5 |
|
Leisure and hospitality |
17,076 | 16,558 | 16,858 | 17,331 | 255 | 1.5 |
|
Other services |
5,983 | 5,993 | 6,019 | 6,059 | 76 | 1.3 |
|
Government |
23,591 | 23,911 | 23,938 | 23,837 | 246 | 1.0 |
|
Kansas City, MO-KS, MSA |
||||||
|
Total nonfarm |
1,156.5 | 1,139.4 | 1,146.7 | 1,154.6 | -1.9 | -0.2 |
|
Mining, logging, and construction |
62.6 | 62.1 | 64.1 | 65.8 | 3.2 | 5.1 |
|
Manufacturing |
90.8 | 89.6 | 88.8 | 91.1 | 0.3 | 0.3 |
|
Trade, transportation, and utilities |
230.3 | 227.4 | 226.4 | 226.4 | -3.9 | -1.7 |
|
Information |
17.2 | 16.3 | 16.3 | 16.1 | -1.1 | -6.4 |
|
Financial activities |
77.6 | 80.0 | 79.1 | 79.7 | 2.1 | 2.7 |
|
Professional and business services |
186.3 | 182.0 | 182.9 | 180.8 | -5.5 | -3.0 |
|
Education and health services |
174.5 | 178.2 | 179.8 | 179.8 | 5.3 | 3.0 |
|
Leisure and hospitality |
119.9 | 107.2 | 111.1 | 115.8 | -4.1 | -3.4 |
|
Other services |
42.0 | 41.6 | 42.0 | 42.8 | 0.8 | 1.9 |
|
Government |
155.3 | 155.0 | 156.2 | 156.3 | 1.0 | 0.6 |
Last Modified Date: Wednesday, July 02, 2025