An official website of the United States government
An official website of the United States government
The .gov means it's official.
Federal government websites often end in .gov or .mil. Before sharing sensitive information,
make sure you're on a federal government site.
The site is secure.
The
https:// ensures that you are connecting to the official website and that any
information you provide is encrypted and transmitted securely.

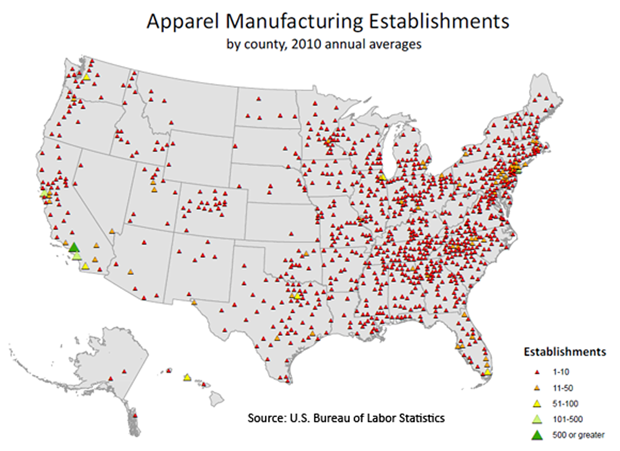
| County | Number of establishments |
|---|---|
Kent County, Delaware | 5 |
New Castle County, Delaware | 3 |
Sussex County, Delaware | 1 |
District of Columbia | 6 |
Alachua County, Florida | 1 |
Bay County, Florida | 1 |
Brevard County, Florida | 5 |
Broward County, Florida | 34 |
Charlotte County, Florida | 3 |
Collier County, Florida | 2 |
Duval County, Florida | 13 |
Escambia County, Florida | 1 |
Highlands County, Florida | 0 |
Hillsborough County, Florida | 20 |
Indian River County, Florida | 0 |
Lake County, Florida | 1 |
Lee County, Florida | 2 |
Leon County, Florida | 1 |
Marion County, Florida | 2 |
Martin County, Florida | 1 |
Miami-Dade County, Florida | 98 |
Monroe County, Florida | 1 |
Okaloosa County, Florida | 2 |
Orange County, Florida | 13 |
Osceola County, Florida | 3 |
Palm Beach County, Florida | 22 |
Pasco County, Florida | 3 |
Pinellas County, Florida | 11 |
Polk County, Florida | 2 |
St. Johns County, Florida | 1 |
St. Lucie County, Florida | 2 |
Santa Rosa County, Florida | 2 |
Sarasota County, Florida | 3 |
Seminole County, Florida | 4 |
Volusia County, Florida | 1 |
Washington County, Florida | 1 |
Unknown Or Undefined, Florida | 16 |
Appling County, Georgia | 2 |
Baldwin County, Georgia | 1 |
Barrow County, Georgia | 2 |
Ben Hill County, Georgia | 1 |
Bibb County, Georgia | 2 |
Burke County, Georgia | 1 |
Candler County, Georgia | 1 |
Carroll County, Georgia | 6 |
Chattooga County, Georgia | 1 |
Cherokee County, Georgia | 2 |
Clarke County, Georgia | 1 |
Cobb County, Georgia | 6 |
Colquitt County, Georgia | 2 |
Columbia County, Georgia | 1 |
De Kalb County, Georgia | 3 |
Dooly County, Georgia | 1 |
Fayette County, Georgia | 2 |
Franklin County, Georgia | 1 |
Fulton County, Georgia | 15 |
Glynn County, Georgia | 1 |
Grady County, Georgia | 1 |
Gwinnett County, Georgia | 8 |
Habersham County, Georgia | 2 |
Hall County, Georgia | 1 |
Haralson County, Georgia | 1 |
Henry County, Georgia | 1 |
Jefferson County, Georgia | 2 |
Jenkins County, Georgia | 1 |
Liberty County, Georgia | 1 |
Lowndes County, Georgia | 1 |
Lumpkin County, Georgia | 1 |
McDuffie County, Georgia | 1 |
Madison County, Georgia | 1 |
Mitchell County, Georgia | 2 |
Morgan County, Georgia | 1 |
Muscogee County, Georgia | 3 |
Peach County, Georgia | 1 |
Pickens County, Georgia | 1 |
Pierce County, Georgia | 1 |
Richmond County, Georgia | 2 |
Rockdale County, Georgia | 1 |
Spalding County, Georgia | 1 |
Toombs County, Georgia | 7 |
Union County, Georgia | 1 |
Ware County, Georgia | 1 |
Wayne County, Georgia | 4 |
Whitfield County, Georgia | 2 |
Unknown Or Undefined, Georgia | 10 |
Hawaii County, Hawaii | 0 |
Honolulu County, Hawaii | 53 |
Kauai County, Hawaii | 1 |
Maui + Kalawao County, Hawaii | 3 |
Ada County, Idaho | 8 |
Bingham County, Idaho | 1 |
Bonner County, Idaho | 5 |
Bonneville County, Idaho | 2 |
Boundary County, Idaho | 1 |
Canyon County, Idaho | 2 |
Elmore County, Idaho | 1 |
Gem County, Idaho | 1 |
Jefferson County, Idaho | 1 |
Jerome County, Idaho | 1 |
Kootenai County, Idaho | 3 |
Nez Perce County, Idaho | 1 |
Payette County, Idaho | 1 |
Shoshone County, Idaho | 1 |
Teton County, Idaho | 1 |
Twin Falls County, Idaho | 1 |
Unknown Or Undefined, Idaho | 1 |
Adams County, Illinois | 2 |
Bond County, Illinois | 1 |
Carroll County, Illinois | 1 |
Cass County, Illinois | 1 |
Champaign County, Illinois | 2 |
Clinton County, Illinois | 2 |
Cook County, Illinois | 100 |
Cumberland County, Illinois | 1 |
Douglas County, Illinois | 1 |
Du Page County, Illinois | 13 |
Henry County, Illinois | 1 |
Jasper County, Illinois | 1 |
Jefferson County, Illinois | 1 |
Jo Daviess County, Illinois | 1 |
Kane County, Illinois | 3 |
Kankakee County, Illinois | 2 |
Kendall County, Illinois | 1 |
Knox County, Illinois | 1 |
Lake County, Illinois | 5 |
Lawrence County, Illinois | 1 |
Livingston County, Illinois | 1 |
McLean County, Illinois | 1 |
Macoupin County, Illinois | 1 |
Madison County, Illinois | 1 |
Marshall County, Illinois | 1 |
St. Clair County, Illinois | 1 |
Saline County, Illinois | 2 |
Sangamon County, Illinois | 1 |
Tazewell County, Illinois | 1 |
Vermilion County, Illinois | 1 |
Will County, Illinois | 2 |
Williamson County, Illinois | 1 |
Winnebago County, Illinois | 2 |
Woodford County, Illinois | 1 |
Unknown Or Undefined, Illinois | 22 |
Allen County, Indiana | 6 |
Boone County, Indiana | 1 |
Brown County, Indiana | 1 |
Carroll County, Indiana | 1 |
Daviess County, Indiana | 2 |
Delaware County, Indiana | 1 |
Elkhart County, Indiana | 1 |
Grant County, Indiana | 1 |
Greene County, Indiana | 1 |
Hamilton County, Indiana | 2 |
Hancock County, Indiana | 1 |
Hendricks County, Indiana | 1 |
Johnson County, Indiana | 3 |
Lake County, Indiana | 3 |
La Porte County, Indiana | 2 |
Lawrence County, Indiana | 1 |
Madison County, Indiana | 2 |
Marion County, Indiana | 12 |
Miami County, Indiana | 1 |
Montgomery County, Indiana | 1 |
Noble County, Indiana | 2 |
Ohio County, Indiana | 1 |
Porter County, Indiana | 2 |
Randolph County, Indiana | 1 |
Ripley County, Indiana | 1 |
St. Joseph County, Indiana | 1 |
Shelby County, Indiana | 1 |
Vigo County, Indiana | 1 |
Wabash County, Indiana | 1 |
Washington County, Indiana | 0 |
Wayne County, Indiana | 1 |
Black Hawk County, Iowa | 1 |
Cherokee County, Iowa | 1 |
Dickinson County, Iowa | 2 |
Dubuque County, Iowa | 1 |
Hamilton County, Iowa | 1 |
Hancock County, Iowa | 1 |
Hardin County, Iowa | 1 |
Jefferson County, Iowa | 2 |
Mahaska County, Iowa | 1 |
Mitchell County, Iowa | 2 |
Muscatine County, Iowa | 1 |
Polk County, Iowa | 3 |
Poweshiek County, Iowa | 1 |
Scott County, Iowa | 1 |
Shelby County, Iowa | 1 |
Sioux County, Iowa | 2 |
Webster County, Iowa | 1 |
Woodbury County, Iowa | 1 |
Cherokee County, Kansas | 1 |
Johnson County, Kansas | 8 |
Miami County, Kansas | 1 |
Sedgwick County, Kansas | 3 |
Wyandotte County, Kansas | 1 |
Adair County, Kentucky | 1 |
Barren County, Kentucky | 0 |
Bourbon County, Kentucky | 1 |
Caldwell County, Kentucky | 2 |
Calloway County, Kentucky | 1 |
Carter County, Kentucky | 2 |
Christian County, Kentucky | 3 |
Cumberland County, Kentucky | 1 |
Daviess County, Kentucky | 1 |
Estill County, Kentucky | 1 |
Fayette County, Kentucky | 3 |
Green County, Kentucky | 1 |
Hopkins County, Kentucky | 1 |
Jefferson County, Kentucky | 7 |
Knox County, Kentucky | 1 |
Larue County, Kentucky | 1 |
Lincoln County, Kentucky | 1 |
Mason County, Kentucky | 1 |
Metcalfe County, Kentucky | 2 |
Monroe County, Kentucky | 2 |
Montgomery County, Kentucky | 1 |
Pulaski County, Kentucky | 1 |
Russell County, Kentucky | 1 |
Scott County, Kentucky | 1 |
Shelby County, Kentucky | 1 |
Spencer County, Kentucky | 1 |
Taylor County, Kentucky | 1 |
Trigg County, Kentucky | 1 |
Webster County, Kentucky | 1 |
Whitley County, Kentucky | 2 |
Unknown Or Undefined, Kentucky | 1 |
Ascension Parish, Louisiana | 3 |
Bossier Parish, Louisiana | 1 |
Caddo Parish, Louisiana | 1 |
East Baton Rouge Parish, Louisiana | 4 |
Jefferson Parish, Louisiana | 9 |
Lafayette Parish, Louisiana | 2 |
Livingston Parish, Louisiana | 1 |
Orleans Parish, Louisiana | 7 |
Ouachita Parish, Louisiana | 2 |
Rapides Parish, Louisiana | 1 |
St. Bernard Parish, Louisiana | 1 |
St. Landry Parish, Louisiana | 3 |
St. Mary Parish, Louisiana | 1 |
St. Tammany Parish, Louisiana | 1 |
Tangipahoa Parish, Louisiana | 1 |
Washington Parish, Louisiana | 1 |
Androscoggin County, Maine | 1 |
Cumberland County, Maine | 3 |
Hancock County, Maine | 2 |
Knox County, Maine | 0 |
Oxford County, Maine | 1 |
Penobscot County, Maine | 2 |
Piscataquis County, Maine | 1 |
Somerset County, Maine | 1 |
Waldo County, Maine | 1 |
York County, Maine | 1 |
Allegany County, Maryland | 2 |
Anne Arundel County, Maryland | 3 |
Baltimore County, Maryland | 4 |
Caroline County, Maryland | 1 |
Carroll County, Maryland | 5 |
Charles County, Maryland | 1 |
Frederick County, Maryland | 1 |
Garrett County, Maryland | 1 |
Harford County, Maryland | 2 |
Howard County, Maryland | 5 |
Montgomery County, Maryland | 4 |
Prince Georges County, Maryland | 4 |
Wicomico County, Maryland | 0 |
Worcester County, Maryland | 2 |
Baltimore City, Maryland | 12 |
Unknown Or Undefined, Maryland | 1 |
Barnstable County, Massachusetts | 4 |
Berkshire County, Massachusetts | 1 |
Bristol County, Massachusetts | 23 |
Essex County, Massachusetts | 8 |
Hampden County, Massachusetts | 5 |
Hampshire County, Massachusetts | 2 |
Middlesex County, Massachusetts | 19 |
Norfolk County, Massachusetts | 6 |
Plymouth County, Massachusetts | 4 |
Suffolk County, Massachusetts | 15 |
Worcester County, Massachusetts | 7 |
Allegan County, Michigan | 1 |
Antrim County, Michigan | 3 |
Arenac County, Michigan | 1 |
Barry County, Michigan | 1 |
Bay County, Michigan | 1 |
Clinton County, Michigan | 1 |
Delta County, Michigan | 1 |
Hillsdale County, Michigan | 1 |
Ingham County, Michigan | 3 |
Ionia County, Michigan | 1 |
Isabella County, Michigan | 1 |
Jackson County, Michigan | 1 |
Kalamazoo County, Michigan | 2 |
Kent County, Michigan | 4 |
Livingston County, Michigan | 1 |
Macomb County, Michigan | 10 |
Manistee County, Michigan | 1 |
Oakland County, Michigan | 12 |
Ottawa County, Michigan | 1 |
Presque Isle County, Michigan | 1 |
Saginaw County, Michigan | 1 |
St. Clair County, Michigan | 1 |
St. Joseph County, Michigan | 1 |
Shiawassee County, Michigan | 1 |
Tuscola County, Michigan | 0 |
Washtenaw County, Michigan | 2 |
Wayne County, Michigan | 14 |
Unknown Or Undefined, Michigan | 3 |
Anoka County, Minnesota | 6 |
Beltrami County, Minnesota | 1 |
Carlton County, Minnesota | 3 |
Carver County, Minnesota | 1 |
Chisago County, Minnesota | 2 |
Crow Wing County, Minnesota | 1 |
Dakota County, Minnesota | 5 |
Douglas County, Minnesota | 1 |
Hennepin County, Minnesota | 30 |
Hubbard County, Minnesota | 1 |
Itasca County, Minnesota | 0 |
Meeker County, Minnesota | 1 |
Mille Lacs County, Minnesota | 1 |
Morrison County, Minnesota | 1 |
Otter Tail County, Minnesota | 1 |
Ramsey County, Minnesota | 9 |
Rice County, Minnesota | 1 |
St. Louis County, Minnesota | 4 |
Scott County, Minnesota | 1 |
Stearns County, Minnesota | 3 |
Steele County, Minnesota | 3 |
Swift County, Minnesota | 1 |
Waseca County, Minnesota | 1 |
Washington County, Minnesota | 3 |
Winona County, Minnesota | 1 |
Wright County, Minnesota | 2 |
Yellow Medicine County, Minnesota | 1 |
Unknown Or Undefined, Minnesota | 5 |
Adams County, Mississippi | 1 |
Alcorn County, Mississippi | 4 |
Amite County, Mississippi | 1 |
Attala County, Mississippi | 1 |
Calhoun County, Mississippi | 1 |
Coahoma County, Mississippi | 2 |
Copiah County, Mississippi | 2 |
De Soto County, Mississippi | 1 |
Forrest County, Mississippi | 1 |
George County, Mississippi | 1 |
Harrison County, Mississippi | 1 |
Hinds County, Mississippi | 1 |
Jones County, Mississippi | 1 |
Lafayette County, Mississippi | 1 |
Lamar County, Mississippi | 1 |
Lee County, Mississippi | 2 |
Lowndes County, Mississippi | 4 |
Neshoba County, Mississippi | 1 |
Oktibbeha County, Mississippi | 1 |
Pearl River County, Mississippi | 1 |
Perry County, Mississippi | 1 |
Pike County, Mississippi | 1 |
Prentiss County, Mississippi | 1 |
Sunflower County, Mississippi | 1 |
Tishomingo County, Mississippi | 2 |
Walthall County, Mississippi | 0 |
Wayne County, Mississippi | 2 |
Webster County, Mississippi | 2 |
Winston County, Mississippi | 1 |
Unknown Or Undefined, Mississippi | 1 |
Benton County, Missouri | 1 |
Bollinger County, Missouri | 1 |
Buchanan County, Missouri | 2 |
Camden County, Missouri | 1 |
Cape Girardeau County, Missouri | 1 |
Christian County, Missouri | 1 |
Clay County, Missouri | 1 |
Franklin County, Missouri | 2 |
Gasconade County, Missouri | 1 |
Greene County, Missouri | 3 |
Howell County, Missouri | 1 |
Jackson County, Missouri | 5 |
Jasper County, Missouri | 0 |
Jefferson County, Missouri | 1 |
Laclede County, Missouri | 1 |
Linn County, Missouri | 1 |
Livingston County, Missouri | 1 |
Madison County, Missouri | 1 |
Miller County, Missouri | 2 |
Osage County, Missouri | 1 |
Polk County, Missouri | 1 |
Ripley County, Missouri | 0 |
St. Charles County, Missouri | 1 |
St. Louis County, Missouri | 13 |
Saline County, Missouri | 2 |
Scott County, Missouri | 2 |
Shannon County, Missouri | 1 |
Stoddard County, Missouri | 1 |
Stone County, Missouri | 1 |
Sullivan County, Missouri | 1 |
Texas County, Missouri | 2 |
Webster County, Missouri | 1 |
St. Louis City, Missouri | 8 |
Gallatin County, Montana | 2 |
Lake County, Montana | 1 |
Lewis and Clark County, Montana | 1 |
Missoula County, Montana | 1 |
Cheyenne County, Nebraska | 1 |
Cuming County, Nebraska | 1 |
Custer County, Nebraska | 1 |
Dawson County, Nebraska | 1 |
Dodge County, Nebraska | 1 |
Douglas County, Nebraska | 6 |
Sarpy County, Nebraska | 1 |
Clark County, Nevada | 11 |
Washoe County, Nevada | 2 |
Carson City, Nevada | 1 |
Belknap County, New Hampshire | 1 |
Carroll County, New Hampshire | 6 |
Cheshire County, New Hampshire | 1 |
Coos County, New Hampshire | 4 |
Grafton County, New Hampshire | 1 |
Hillsborough County, New Hampshire | 3 |
Merrimack County, New Hampshire | 1 |
Rockingham County, New Hampshire | 1 |
Strafford County, New Hampshire | 2 |
Atlantic County, New Jersey | 1 |
Bergen County, New Jersey | 32 |
Burlington County, New Jersey | 5 |
Camden County, New Jersey | 7 |
Cumberland County, New Jersey | 4 |
Essex County, New Jersey | 23 |
Gloucester County, New Jersey | 2 |
Hudson County, New Jersey | 50 |
Mercer County, New Jersey | 3 |
Middlesex County, New Jersey | 10 |
Monmouth County, New Jersey | 7 |
Morris County, New Jersey | 7 |
Ocean County, New Jersey | 3 |
Passaic County, New Jersey | 17 |
Salem County, New Jersey | 1 |
Somerset County, New Jersey | 2 |
Union County, New Jersey | 11 |
Warren County, New Jersey | 2 |
Unknown Or Undefined, New Jersey | 12 |
Bernalillo County, New Mexico | 7 |
Dona Ana County, New Mexico | 1 |
Mckinley County, New Mexico | 2 |
San Miguel County, New Mexico | 1 |
Santa Fe County, New Mexico | 5 |
Taos County, New Mexico | 2 |
Unknown Or Undefined, New Mexico | 1 |
Albany County, New York | 4 |
Bronx County, New York | 19 |
Broome County, New York | 1 |
Chautauqua County, New York | 1 |
Chemung County, New York | 1 |
Clinton County, New York | 2 |
Columbia County, New York | 1 |
Delaware County, New York | 1 |
Dutchess County, New York | 2 |
Erie County, New York | 14 |
Essex County, New York | 1 |
Franklin County, New York | 0 |
Fulton County, New York | 8 |
Genesee County, New York | 1 |
Herkimer County, New York | 1 |
Jefferson County, New York | 2 |
Kings County, New York | 270 |
Monroe County, New York | 8 |
Montgomery County, New York | 1 |
Nassau County, New York | 47 |
New York County, New York | 803 |
Niagara County, New York | 1 |
Oneida County, New York | 4 |
Onondaga County, New York | 3 |
Ontario County, New York | 1 |
Orange County, New York | 7 |
Otsego County, New York | 2 |
Putnam County, New York | 1 |
Queens County, New York | 163 |
Rensselaer County, New York | 2 |
Richmond County, New York | 4 |
Rockland County, New York | 4 |
St. Lawrence County, New York | 1 |
Saratoga County, New York | 4 |
Schenectady County, New York | 4 |
Suffolk County, New York | 32 |
Tompkins County, New York | 1 |
Ulster County, New York | 6 |
Warren County, New York | 0 |
Westchester County, New York | 19 |
Wyoming County, New York | 1 |
Unknown Or Undefined, New York | 11 |
Alamance County, North Carolina | 20 |
Alexander County, North Carolina | 2 |
Anson County, North Carolina | 2 |
Avery County, North Carolina | 1 |
Buncombe County, North Carolina | 4 |
Burke County, North Carolina | 13 |
Cabarrus County, North Carolina | 9 |
Caldwell County, North Carolina | 4 |
Carteret County, North Carolina | 2 |
Caswell County, North Carolina | 2 |
Catawba County, North Carolina | 24 |
Cleveland County, North Carolina | 3 |
Craven County, North Carolina | 1 |
Cumberland County, North Carolina | 4 |
Dare County, North Carolina | 1 |
Davidson County, North Carolina | 10 |
Davie County, North Carolina | 4 |
Durham County, North Carolina | 2 |
Edgecombe County, North Carolina | 1 |
Forsyth County, North Carolina | 10 |
Franklin County, North Carolina | 1 |
Gaston County, North Carolina | 5 |
Guilford County, North Carolina | 13 |
Halifax County, North Carolina | 1 |
Henderson County, North Carolina | 1 |
Iredell County, North Carolina | 4 |
Jackson County, North Carolina | 1 |
Lee County, North Carolina | 1 |
Lincoln County, North Carolina | 1 |
McDowell County, North Carolina | 2 |
Mecklenburg County, North Carolina | 5 |
Montgomery County, North Carolina | 9 |
Moore County, North Carolina | 1 |
Nash County, North Carolina | 3 |
Northampton County, North Carolina | 1 |
Orange County, North Carolina | 2 |
Pitt County, North Carolina | 2 |
Polk County, North Carolina | 2 |
Randolph County, North Carolina | 18 |
Richmond County, North Carolina | 2 |
Robeson County, North Carolina | 5 |
Rockingham County, North Carolina | 2 |
Rowan County, North Carolina | 2 |
Rutherford County, North Carolina | 1 |
Sampson County, North Carolina | 3 |
Stanly County, North Carolina | 4 |
Surry County, North Carolina | 8 |
Union County, North Carolina | 5 |
Wake County, North Carolina | 11 |
Watauga County, North Carolina | 2 |
Wayne County, North Carolina | 2 |
Wilkes County, North Carolina | 7 |
Wilson County, North Carolina | 2 |
Yancey County, North Carolina | 1 |
Cass County, North Dakota | 1 |
Morton County, North Dakota | 1 |
Stark County, North Dakota | 1 |
Stutsman County, North Dakota | 1 |
Ward County, North Dakota | 1 |
Butler County, Ohio | 2 |
Clark County, Ohio | 2 |
Columbiana County, Ohio | 1 |
Coshocton County, Ohio | 1 |
Crawford County, Ohio | 1 |
Cuyahoga County, Ohio | 16 |
Darke County, Ohio | 1 |
Erie County, Ohio | 1 |
Franklin County, Ohio | 2 |
Hamilton County, Ohio | 12 |
Hancock County, Ohio | 1 |
Holmes County, Ohio | 2 |
Huron County, Ohio | 1 |
Logan County, Ohio | 1 |
Lucas County, Ohio | 4 |
Mahoning County, Ohio | 2 |
Marion County, Ohio | 1 |
Medina County, Ohio | 1 |
Miami County, Ohio | 1 |
Monroe County, Ohio | 2 |
Montgomery County, Ohio | 5 |
Muskingum County, Ohio | 2 |
Perry County, Ohio | 1 |
Pickaway County, Ohio | 1 |
Portage County, Ohio | 1 |
Preble County, Ohio | 1 |
Richland County, Ohio | 1 |
Seneca County, Ohio | 3 |
Shelby County, Ohio | 1 |
Stark County, Ohio | 1 |
Summit County, Ohio | 2 |
Trumbull County, Ohio | 1 |
Tuscarawas County, Ohio | 3 |
Union County, Ohio | 1 |
Van Wert County, Ohio | 1 |
Warren County, Ohio | 2 |
Wayne County, Ohio | 1 |
Williams County, Ohio | 1 |
Wood County, Ohio | 1 |
Unknown Or Undefined, Ohio | 3 |
Canadian County, Oklahoma | 1 |
Carter County, Oklahoma | 1 |
Cleveland County, Oklahoma | 3 |
Cotton County, Oklahoma | 2 |
Creek County, Oklahoma | 2 |
McClain County, Oklahoma | 1 |
Mayes County, Oklahoma | 1 |
Oklahoma County, Oklahoma | 9 |
Pawnee County, Oklahoma | 1 |
Pittsburg County, Oklahoma | 1 |
Pottawatomie County, Oklahoma | 2 |
Seminole County, Oklahoma | 1 |
Stephens County, Oklahoma | 1 |
Tulsa County, Oklahoma | 12 |
Clackamas County, Oregon | 2 |
Columbia County, Oregon | 2 |
Deschutes County, Oregon | 3 |
Douglas County, Oregon | 1 |
Hood River County, Oregon | 1 |
Jackson County, Oregon | 6 |
Josephine County, Oregon | 1 |
Lane County, Oregon | 4 |
Linn County, Oregon | 1 |
Marion County, Oregon | 8 |
Multnomah County, Oregon | 25 |
Wasco County, Oregon | 1 |
Washington County, Oregon | 10 |
Unknown Or Undefined, Oregon | 0 |
Allegheny County, Pennsylvania | 13 |
Beaver County, Pennsylvania | 1 |
Berks County, Pennsylvania | 12 |
Blair County, Pennsylvania | 1 |
Bucks County, Pennsylvania | 13 |
Butler County, Pennsylvania | 1 |
Cambria County, Pennsylvania | 5 |
Carbon County, Pennsylvania | 4 |
Chester County, Pennsylvania | 8 |
Clearfield County, Pennsylvania | 3 |
Clinton County, Pennsylvania | 1 |
Columbia County, Pennsylvania | 2 |
Cumberland County, Pennsylvania | 1 |
Dauphin County, Pennsylvania | 4 |
Delaware County, Pennsylvania | 7 |
Erie County, Pennsylvania | 2 |
Franklin County, Pennsylvania | 2 |
Jefferson County, Pennsylvania | 2 |
Juniata County, Pennsylvania | 1 |
Lackawanna County, Pennsylvania | 6 |
Lancaster County, Pennsylvania | 15 |
Lebanon County, Pennsylvania | 6 |
Lehigh County, Pennsylvania | 34 |
Luzerne County, Pennsylvania | 3 |
Lycoming County, Pennsylvania | 3 |
Mifflin County, Pennsylvania | 1 |
Monroe County, Pennsylvania | 2 |
Montgomery County, Pennsylvania | 17 |
Montour County, Pennsylvania | 1 |
Northampton County, Pennsylvania | 16 |
Northumberland County, Pennsylvania | 1 |
Philadelphia County, Pennsylvania | 44 |
Pike County, Pennsylvania | 1 |
Schuylkill County, Pennsylvania | 9 |
Snyder County, Pennsylvania | 3 |
Somerset County, Pennsylvania | 2 |
Susquehanna County, Pennsylvania | 1 |
Washington County, Pennsylvania | 1 |
Wayne County, Pennsylvania | 1 |
Westmoreland County, Pennsylvania | 3 |
York County, Pennsylvania | 7 |
Bristol County, Rhode Island | 1 |
Kent County, Rhode Island | 2 |
Newport County, Rhode Island | 1 |
Providence County, Rhode Island | 6 |
Washington County, Rhode Island | 2 |
Aiken County, South Carolina | 2 |
Allendale County, South Carolina | 1 |
Anderson County, South Carolina | 2 |
Barnwell County, South Carolina | 1 |
Beaufort County, South Carolina | 4 |
Charleston County, South Carolina | 7 |
Cherokee County, South Carolina | 3 |
Chesterfield County, South Carolina | 3 |
Darlington County, South Carolina | 1 |
Dorchester County, South Carolina | 2 |
Greenville County, South Carolina | 9 |
Horry County, South Carolina | 7 |
Kershaw County, South Carolina | 2 |
Lancaster County, South Carolina | 1 |
Laurens County, South Carolina | 2 |
Lexington County, South Carolina | 1 |
Marion County, South Carolina | 1 |
Newberry County, South Carolina | 1 |
Oconee County, South Carolina | 1 |
Richland County, South Carolina | 2 |
Spartanburg County, South Carolina | 5 |
Sumter County, South Carolina | 2 |
Williamsburg County, South Carolina | 4 |
York County, South Carolina | 1 |
Unknown Or Undefined, South Carolina | 4 |
Beadle County, South Dakota | 1 |
Bon Homme County, South Dakota | 1 |
Lake County, South Dakota | 1 |
Lawrence County, South Dakota | 1 |
Minnehaha County, South Dakota | 2 |
Anderson County, Tennessee | 1 |
Bedford County, Tennessee | 2 |
Benton County, Tennessee | 1 |
Bradley County, Tennessee | 3 |
Campbell County, Tennessee | 1 |
Carroll County, Tennessee | 2 |
Chester County, Tennessee | 1 |
Claiborne County, Tennessee | 3 |
Coffee County, Tennessee | 1 |
Crockett County, Tennessee | 1 |
Cumberland County, Tennessee | 1 |
Davidson County, Tennessee | 9 |
Decatur County, Tennessee | 1 |
De Kalb County, Tennessee | 1 |
Fentress County, Tennessee | 2 |
Franklin County, Tennessee | 4 |
Gibson County, Tennessee | 2 |
Giles County, Tennessee | 2 |
Greene County, Tennessee | 1 |
Grundy County, Tennessee | 1 |
Hamblen County, Tennessee | 1 |
Hamilton County, Tennessee | 7 |
Hickman County, Tennessee | 1 |
Knox County, Tennessee | 8 |
Lauderdale County, Tennessee | 1 |
Lawrence County, Tennessee | 1 |
Loudon County, Tennessee | 1 |
McMinn County, Tennessee | 2 |
McNairy County, Tennessee | 3 |
Macon County, Tennessee | 3 |
Marion County, Tennessee | 1 |
Maury County, Tennessee | 2 |
Monroe County, Tennessee | 4 |
Montgomery County, Tennessee | 1 |
Moore County, Tennessee | 1 |
Obion County, Tennessee | 1 |
Polk County, Tennessee | 1 |
Rhea County, Tennessee | 3 |
Roane County, Tennessee | 1 |
Rutherford County, Tennessee | 2 |
Scott County, Tennessee | 2 |
Sevier County, Tennessee | 1 |
Shelby County, Tennessee | 7 |
Sullivan County, Tennessee | 4 |
Union County, Tennessee | 1 |
Washington County, Tennessee | 1 |
Wayne County, Tennessee | 2 |
Weakley County, Tennessee | 1 |
White County, Tennessee | 2 |
Williamson County, Tennessee | 2 |
Wilson County, Tennessee | 1 |
Unknown Or Undefined, Tennessee | 2 |
Bastrop County, Texas | 2 |
Bell County, Texas | 3 |
Bexar County, Texas | 13 |
Brazos County, Texas | 1 |
Brewster County, Texas | 1 |
Brown County, Texas | 1 |
Burnet County, Texas | 1 |
Caldwell County, Texas | 1 |
Cameron County, Texas | 4 |
Camp County, Texas | 1 |
Cass County, Texas | 2 |
Cherokee County, Texas | 1 |
Collin County, Texas | 8 |
Comal County, Texas | 1 |
Cooke County, Texas | 1 |
Crockett County, Texas | 1 |
Dallas County, Texas | 77 |
Denton County, Texas | 2 |
De Witt County, Texas | 1 |
Ector County, Texas | 1 |
Ellis County, Texas | 3 |
El Paso County, Texas | 22 |
Erath County, Texas | 3 |
Fayette County, Texas | 1 |
Foard County, Texas | 1 |
Fort Bend County, Texas | 4 |
Frio County, Texas | 1 |
Galveston County, Texas | 1 |
Gillespie County, Texas | 1 |
Grayson County, Texas | 1 |
Gregg County, Texas | 2 |
Harris County, Texas | 39 |
Harrison County, Texas | 0 |
Henderson County, Texas | 3 |
Hidalgo County, Texas | 4 |
Houston County, Texas | 1 |
Hunt County, Texas | 1 |
Jefferson County, Texas | 1 |
Johnson County, Texas | 1 |
Kaufman County, Texas | 1 |
Lamar County, Texas | 1 |
Lubbock County, Texas | 3 |
McLennan County, Texas | 2 |
Maverick County, Texas | 1 |
Montague County, Texas | 1 |
Montgomery County, Texas | 2 |
Navarro County, Texas | 1 |
Newton County, Texas | 2 |
Nueces County, Texas | 4 |
Orange County, Texas | 0 |
Randall County, Texas | 1 |
Reeves County, Texas | 1 |
Rockwall County, Texas | 1 |
Rusk County, Texas | 1 |
Scurry County, Texas | 1 |
Smith County, Texas | 0 |
Tarrant County, Texas | 16 |
Taylor County, Texas | 1 |
Tom Green County, Texas | 2 |
Travis County, Texas | 10 |
Uvalde County, Texas | 1 |
Webb County, Texas | 2 |
Wharton County, Texas | 1 |
Wichita County, Texas | 1 |
Willacy County, Texas | 1 |
Wise County, Texas | 1 |
Unknown Or Undefined, Texas | 2 |
Box Elder County, Utah | 2 |
Cache County, Utah | 2 |
Davis County, Utah | 2 |
Iron County, Utah | 1 |
Salt Lake County, Utah | 15 |
San Juan County, Utah | 1 |
Summit County, Utah | 1 |
Uintah County, Utah | 2 |
Utah County, Utah | 11 |
Washington County, Utah | 1 |
Weber County, Utah | 1 |
Addison County, Vermont | 4 |
Bennington County, Vermont | 1 |
Caledonia County, Vermont | 2 |
Chittenden County, Vermont | 2 |
Lamoille County, Vermont | 2 |
Orange County, Vermont | 2 |
Orleans County, Vermont | 1 |
Washington County, Vermont | 3 |
Albemarle County, Virginia | 2 |
Augusta County, Virginia | 1 |
Bath County, Virginia | 1 |
Botetourt County, Virginia | 1 |
Buchanan County, Virginia | 1 |
Campbell County, Virginia | 1 |
Carroll County, Virginia | 0 |
Charles City County, Virginia | 1 |
Charlotte County, Virginia | 1 |
Chesterfield County, Virginia | 2 |
Clarke County, Virginia | 1 |
Fairfax County, Virginia | 8 |
Franklin County, Virginia | 1 |
Greene County, Virginia | 1 |
Henrico County, Virginia | 2 |
Henry County, Virginia | 1 |
Lancaster County, Virginia | 1 |
Lee County, Virginia | 1 |
Loudoun County, Virginia | 1 |
Mecklenburg County, Virginia | 1 |
Page County, Virginia | 1 |
Patrick County, Virginia | 2 |
Pittsylvania County, Virginia | 1 |
Prince William County, Virginia | 2 |
Pulaski County, Virginia | 1 |
Roanoke County, Virginia | 1 |
Rockingham County, Virginia | 1 |
Russell County, Virginia | 1 |
Smyth County, Virginia | 1 |
Spotsylvania County, Virginia | 1 |
Stafford County, Virginia | 1 |
Warren County, Virginia | 1 |
Wythe County, Virginia | 1 |
York County, Virginia | 1 |
Alexandria City, Virginia | 3 |
Bristol City, Virginia | 1 |
Charlottesville City, Virginia | 1 |
Danville City, Virginia | 1 |
Galax City, Virginia | 4 |
Hampton City, Virginia | 2 |
Martinsville City, Virginia | 1 |
Newport News City, Virginia | 1 |
Richmond City, Virginia | 8 |
Roanoke City, Virginia | 1 |
Salem City, Virginia | 1 |
Suffolk City, Virginia | 1 |
Virginia Beach City, Virginia | 7 |
Unknown Or Undefined, Virginia | 0 |
Benton County, Washington | 1 |
Chelan County, Washington | 1 |
Clark County, Washington | 2 |
Grays Harbor County, Washington | 1 |
Jefferson County, Washington | 1 |
King County, Washington | 54 |
Kitsap County, Washington | 2 |
Kittitas County, Washington | 1 |
Lewis County, Washington | 4 |
Mason County, Washington | 1 |
Pierce County, Washington | 10 |
Skagit County, Washington | 1 |
Snohomish County, Washington | 3 |
Spokane County, Washington | 2 |
Thurston County, Washington | 1 |
Whatcom County, Washington | 3 |
Cabell County, West Virginia | 1 |
Greenbrier County, West Virginia | 1 |
Kanawha County, West Virginia | 2 |
Marshall County, West Virginia | 1 |
Mingo County, West Virginia | 1 |
Preston County, West Virginia | 1 |
Putnam County, West Virginia | 1 |
Tyler County, West Virginia | 1 |
Upshur County, West Virginia | 1 |
Ashland County, Wisconsin | 1 |
Barron County, Wisconsin | 1 |
Brown County, Wisconsin | 1 |
Burnett County, Wisconsin | 1 |
Chippewa County, Wisconsin | 2 |
Clark County, Wisconsin | 2 |
Columbia County, Wisconsin | 2 |
Dane County, Wisconsin | 3 |
Grant County, Wisconsin | 1 |
Green Lake County, Wisconsin | 2 |
Jackson County, Wisconsin | 1 |
Jefferson County, Wisconsin | 1 |
Kenosha County, Wisconsin | 0 |
La Crosse County, Wisconsin | 1 |
Langlade County, Wisconsin | 1 |
Marathon County, Wisconsin | 1 |
Marinette County, Wisconsin | 2 |
Milwaukee County, Wisconsin | 4 |
Monroe County, Wisconsin | 2 |
Ozaukee County, Wisconsin | 1 |
Pierce County, Wisconsin | 0 |
Polk County, Wisconsin | 1 |
Rock County, Wisconsin | 1 |
St. Croix County, Wisconsin | 3 |
Sheboygan County, Wisconsin | 1 |
Washburn County, Wisconsin | 1 |
Washington County, Wisconsin | 1 |
Waukesha County, Wisconsin | 2 |
Winnebago County, Wisconsin | 2 |
Unknown Or Undefined, Wisconsin | 0 |
Lincoln County, Wyoming | 1 |
Teton County, Wyoming | 3 |
Adjuntas Municipio, Puerto Rico | 1 |
Aguada Municipio, Puerto Rico | 1 |
Aguas Buenas Municipio, Puerto Rico | 1 |
Arecibo Municipio, Puerto Rico | 1 |
Barranquitas Municipio, Puerto Rico | 2 |
Bayamo'n Municipio, Puerto Rico | 5 |
Cabo Rojo Municipio, Puerto Rico | 3 |
Caguas Municipio, Puerto Rico | 7 |
Camuy Municipio, Puerto Rico | 1 |
Carolina Municipio, Puerto Rico | 1 |
Cayey Municipio, Puerto Rico | 3 |
Ciales Municipio, Puerto Rico | 1 |
Cidra Municipio, Puerto Rico | 3 |
Comerio Municipio, Puerto Rico | 1 |
Corozal Municipio, Puerto Rico | 3 |
Guanica Municipio, Puerto Rico | 1 |
Guayama Municipio, Puerto Rico | 1 |
Guaynabo Municipio, Puerto Rico | 1 |
Humacao Municipio, Puerto Rico | 1 |
Lajas Municipio, Puerto Rico | 4 |
Lares Municipio, Puerto Rico | 1 |
Las Marias Municipio, Puerto Rico | 2 |
Mayaguez Municipio, Puerto Rico | 9 |
Moca Municipio, Puerto Rico | 1 |
Morovis Municipio, Puerto Rico | 2 |
Naguabo Municipio, Puerto Rico | 1 |
Naranjito Municipio, Puerto Rico | 2 |
Orocovis Municipio, Puerto Rico | 3 |
Ponce Municipio, Puerto Rico | 5 |
Sabana Grande Municipio, Puerto Rico | 1 |
San Juan Municipio, Puerto Rico | 13 |
San Lorenzo Municipio, Puerto Rico | 2 |
San Sebastian Municipio, Puerto Rico | 4 |
Toa Alta Municipio, Puerto Rico | 1 |
Utuado Municipio, Puerto Rico | 1 |
Vega Alta Municipio, Puerto Rico | 1 |
Yabucoa Municipio, Puerto Rico | 3 |
St. John, Virgin Islands | 1 |
St. Thomas, Virgin Islands | 1 |
Baldwin County, Alabama | 2 |
Blount County, Alabama | 1 |
Butler County, Alabama | 0 |
Calhoun County, Alabama | 1 |
Cherokee County, Alabama | 3 |
Clarke County, Alabama | 3 |
Clay County, Alabama | 1 |
Cleburne County, Alabama | 2 |
Coffee County, Alabama | 2 |
Colbert County, Alabama | 1 |
Conecuh County, Alabama | 1 |
Covington County, Alabama | 2 |
Cullman County, Alabama | 2 |
Dale County, Alabama | 1 |
Dallas County, Alabama | 1 |
DeKalb County, Alabama | 30 |
Elmore County, Alabama | 1 |
Fayette County, Alabama | 2 |
Houston County, Alabama | 3 |
Jefferson County, Alabama | 8 |
Lauderdale County, Alabama | 1 |
Lawrence County, Alabama | 2 |
Limestone County, Alabama | 2 |
Lowndes County, Alabama | 1 |
Madison County, Alabama | 1 |
Marengo County, Alabama | 1 |
Marion County, Alabama | 2 |
Marshall County, Alabama | 1 |
Mobile County, Alabama | 2 |
Monroe County, Alabama | 1 |
Morgan County, Alabama | 2 |
Randolph County, Alabama | 1 |
Russell County, Alabama | 2 |
St. Clair County, Alabama | 2 |
Talladega County, Alabama | 1 |
Tallapoosa County, Alabama | 3 |
Anchorage Borough, Alaska | 0 |
Fairbanks North Star Borough, Alaska | 2 |
Juneau Borough, Alaska | 1 |
Mantanuska-Susitna Borough, Alaska | 1 |
Cochise County, Arizona | 1 |
Coconino County, Arizona | 1 |
La Paz County, Arizona | 1 |
Maricopa County, Arizona | 20 |
Pima County, Arizona | 4 |
Santa Cruz County, Arizona | 1 |
Ashley County, Arkansas | 1 |
Benton County, Arkansas | 2 |
Boone County, Arkansas | 2 |
Chicot County, Arkansas | 3 |
Clark County, Arkansas | 1 |
Cleburne County, Arkansas | 1 |
Craighead County, Arkansas | 1 |
Crittenden County, Arkansas | 1 |
Desha County, Arkansas | 1 |
Hempstead County, Arkansas | 1 |
Johnson County, Arkansas | 1 |
Lafayette County, Arkansas | 1 |
Lawrence County, Arkansas | 1 |
Lincoln County, Arkansas | 1 |
Pike County, Arkansas | 1 |
Pulaski County, Arkansas | 3 |
Saline County, Arkansas | 2 |
Searcy County, Arkansas | 1 |
Sebastian County, Arkansas | 2 |
Sharp County, Arkansas | 1 |
Unknown Or Undefined, Arkansas | 1 |
Alameda County, California | 40 |
Butte County, California | 3 |
Contra Costa County, California | 12 |
El Dorado County, California | 1 |
Fresno County, California | 4 |
Humboldt County, California | 3 |
Imperial County, California | 2 |
Kern County, California | 5 |
Kings County, California | 1 |
Los Angeles County, California | 2509 |
Marin County, California | 10 |
Mendocino County, California | 2 |
Merced County, California | 1 |
Monterey County, California | 4 |
Napa County, California | 2 |
Nevada County, California | 1 |
Orange County, California | 259 |
Placer County, California | 3 |
Riverside County, California | 16 |
Sacramento County, California | 5 |
San Bernardino County, California | 38 |
San Diego County, California | 82 |
San Francisco County, California | 116 |
San Joaquin County, California | 2 |
San Luis Obispo County, California | 8 |
San Mateo County, California | 8 |
Santa Barbara County, California | 3 |
Santa Clara County, California | 16 |
Santa Cruz County, California | 6 |
Shasta County, California | 1 |
Siskiyou County, California | 1 |
Solano County, California | 3 |
Sonoma County, California | 10 |
Stanislaus County, California | 2 |
Sutter County, California | 1 |
Ventura County, California | 12 |
Yolo County, California | 3 |
Yuba County, California | 1 |
Unknown Or Undefined, California | 14 |
Adams County, Colorado | 1 |
Arapahoe County, Colorado | 6 |
Boulder County, Colorado | 7 |
Delta County, Colorado | 1 |
Denver County, Colorado | 9 |
Douglas County, Colorado | 1 |
Eagle County, Colorado | 1 |
El Paso County, Colorado | 8 |
Garfield County, Colorado | 1 |
Jefferson County, Colorado | 2 |
Lake County, Colorado | 1 |
La Plata County, Colorado | 2 |
Larimer County, Colorado | 1 |
Mesa County, Colorado | 5 |
Montrose County, Colorado | 2 |
Park County, Colorado | 1 |
Pitkin County, Colorado | 1 |
Routt County, Colorado | 1 |
Summit County, Colorado | 1 |
Weld County, Colorado | 2 |
Fairfield County, Connecticut | 2 |
Hartford County, Connecticut | 7 |
Litchfield County, Connecticut | 1 |
Middlesex County, Connecticut | 1 |
New Haven County, Connecticut | 7 |
New London County, Connecticut | 1 |
Notes: | |
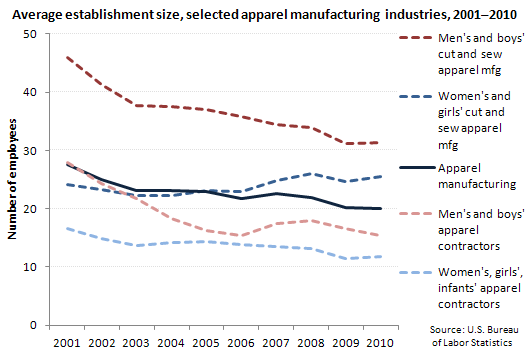
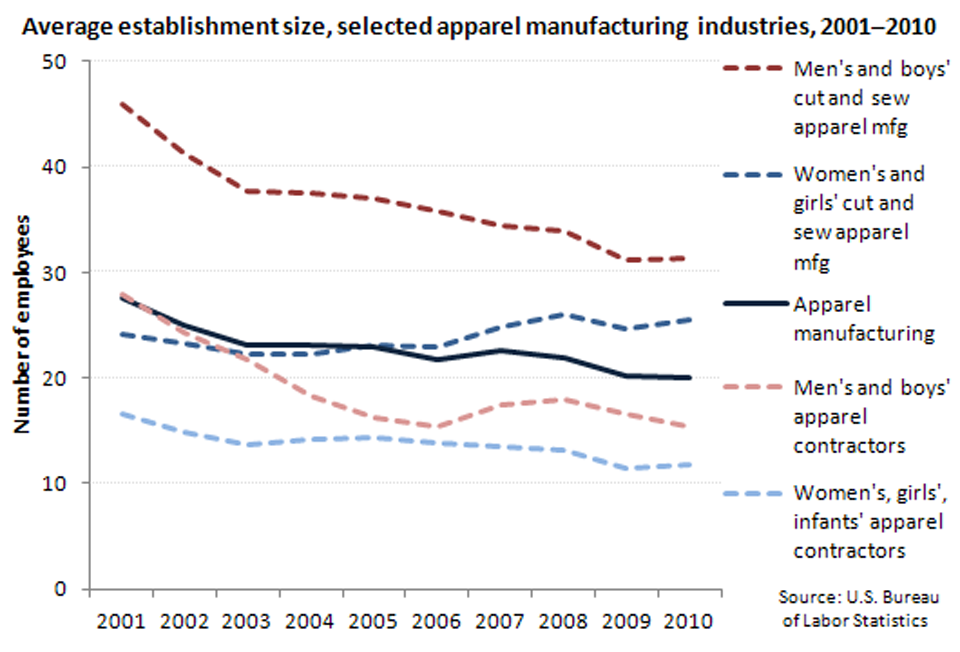
| Year | Apparel manufacturing | Men's and boys' cut and sew apparel manufacturing | Women's and girls' cut and sew apparel manufacturing | Men's and boys' apparel contractors | Women's, girls', infants' apparel contractors |
|---|---|---|---|---|---|
2001 | 27.5 | 45.9 | 24.2 | 27.8 | 16.6 |
2002 | 25.0 | 41.3 | 23.3 | 24.3 | 14.8 |
2003 | 23.1 | 37.7 | 22.2 | 21.8 | 13.7 |
2004 | 23.0 | 37.5 | 22.3 | 18.3 | 14.3 |
2005 | 22.9 | 37.0 | 23.1 | 16.3 | 14.4 |
2006 | 21.8 | 35.9 | 23.0 | 15.4 | 13.9 |
2007 | 22.5 | 34.4 | 24.8 | 17.4 | 13.5 |
2008 | 22.0 | 33.9 | 26.0 | 18.0 | 13.1 |
2009 | 20.1 | 31.2 | 24.7 | 16.6 | 11.5 |
2010 | 20.1 | 31.3 | 25.5 | 15.3 | 11.7 |
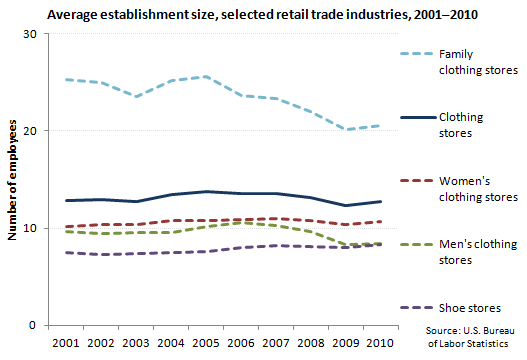
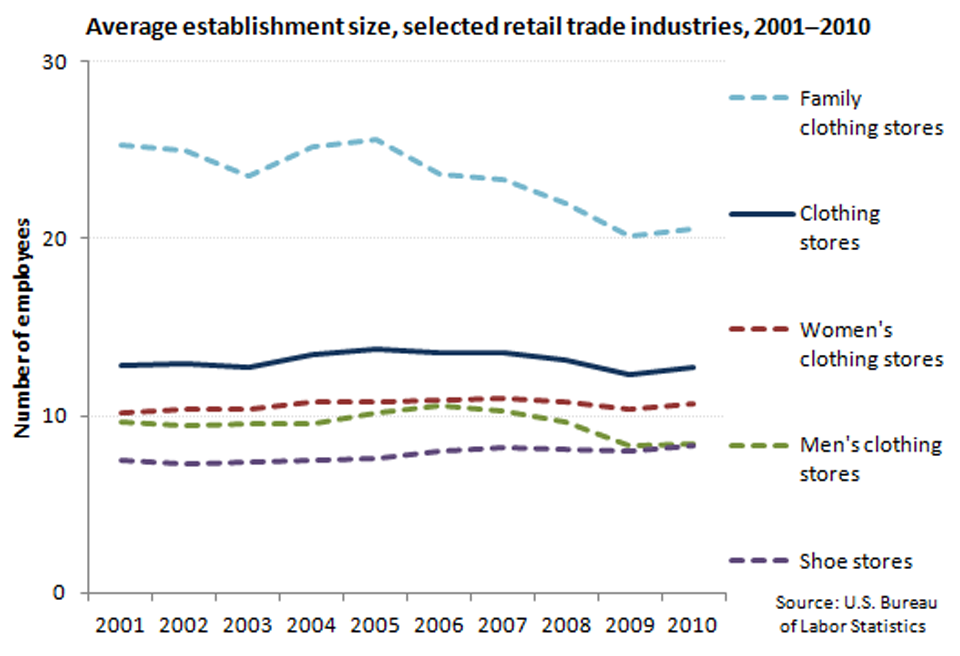
| Year | Clothing stores | Men's clothing stores | Women's clothing stores | Family clothing stores | Shoe stores |
|---|---|---|---|---|---|
2001 | 12.8 | 9.6 | 10.1 | 25.3 | 7.4 |
2002 | 12.9 | 9.4 | 10.3 | 25.0 | 7.2 |
2003 | 12.8 | 9.5 | 10.4 | 23.5 | 7.4 |
2004 | 13.4 | 9.6 | 10.8 | 25.2 | 7.4 |
2005 | 13.7 | 10.1 | 10.8 | 25.6 | 7.6 |
2006 | 13.6 | 10.6 | 10.9 | 23.6 | 8.0 |
2007 | 13.6 | 10.2 | 10.9 | 23.4 | 8.2 |
2008 | 13.2 | 9.7 | 10.7 | 22.0 | 8.1 |
2009 | 12.3 | 8.3 | 10.3 | 20.1 | 8.0 |
2010 | 12.7 | 8.5 | 10.6 | 20.6 | 8.3 |
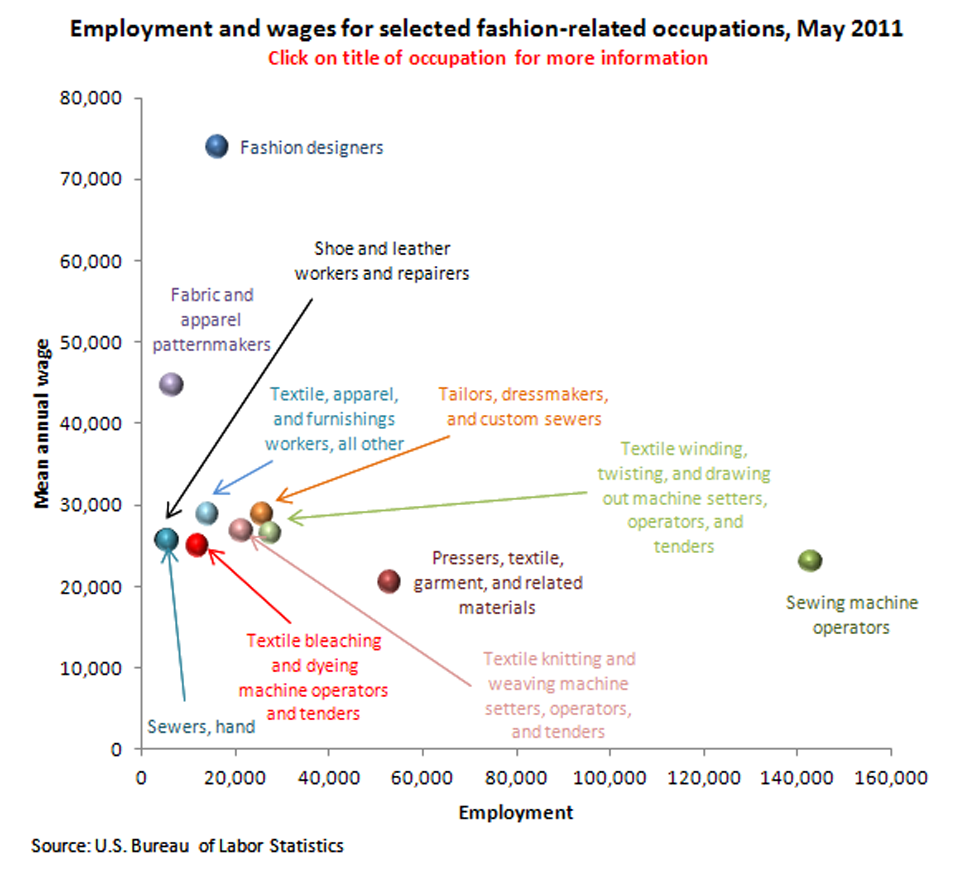
| Occupation | Employment | Mean annual wages |
|---|---|---|
Sewing machine operators | 142,860 | $23,080 |
Pressers, textile, garment, and related materials | 52,790 | 20,530 |
Textile winding, twisting, and drawing out machine setters, operators, and tenders | 27,400 | 26,460 |
Tailors, dressmakers, and custom sewers | 25,530 | 28,800 |
Textile knitting and weaving machine setters, operators, and tenders | 21,160 | 26,760 |
Fashion designers | 16,010 | 73,930 |
Textile, apparel, and furnishings workers, all other | 13,980 | 28,850 |
Textile bleaching and dyeing machine operators and tenders | 11,870 | 24,980 |
Fabric and apparel patternmakers | 6,410 | 44,650 |
Sewers, hand | 5,460 | 25,590 |
Shoe and leather workers and repairers | 5,360 | 25,680 |
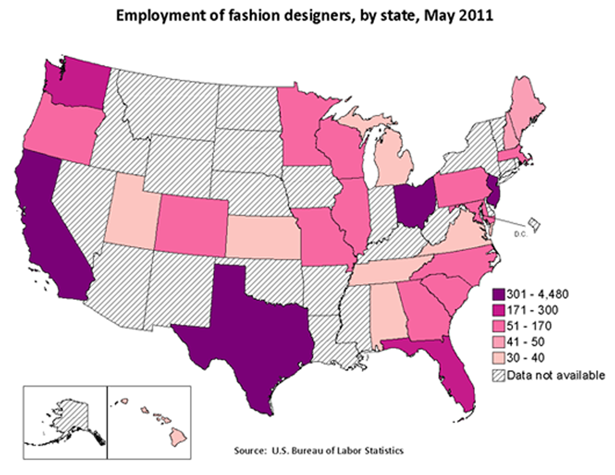
| State | Employment |
|---|---|
Alabama | 40 |
Alaska | (1) |
Arizona | (1) |
Arkansas | (1) |
California | 4,480 |
Colorado | 80 |
Connecticut | (1) |
Delaware | (1) |
District of Columbia | (1) |
Florida | 260 |
Georgia | 130 |
Hawaii | 30 |
Idaho | (1) |
Illinois | 110 |
Indiana | (1) |
Iowa | (1) |
Kansas | 30 |
Kentucky | (1) |
Louisiana | (1) |
Maine | 50 |
Maryland | 100 |
Massachusetts | 170 |
Michigan | 30 |
Minnesota | 60 |
Mississippi | (1) |
Missouri | 120 |
Montana | (1) |
Nebraska | (1) |
Nevada | (1) |
New Hampshire | 50 |
New Jersey | 460 |
New Mexico | (1) |
New York | (1) |
North Carolina | 110 |
North Dakota | (1) |
Ohio | 380 |
Oklahoma | (1) |
Oregon | 100 |
Pennsylvania | 170 |
Rhode Island | (1) |
South Carolina | 80 |
South Dakota | (1) |
Tennessee | 40 |
Texas | 410 |
Utah | 40 |
Vermont | (1) |
Virginia | 30 |
Washington | 300 |
West Virginia | (1) |
Wisconsin | 170 |
Wyoming | (1) |
Footnotes: | |
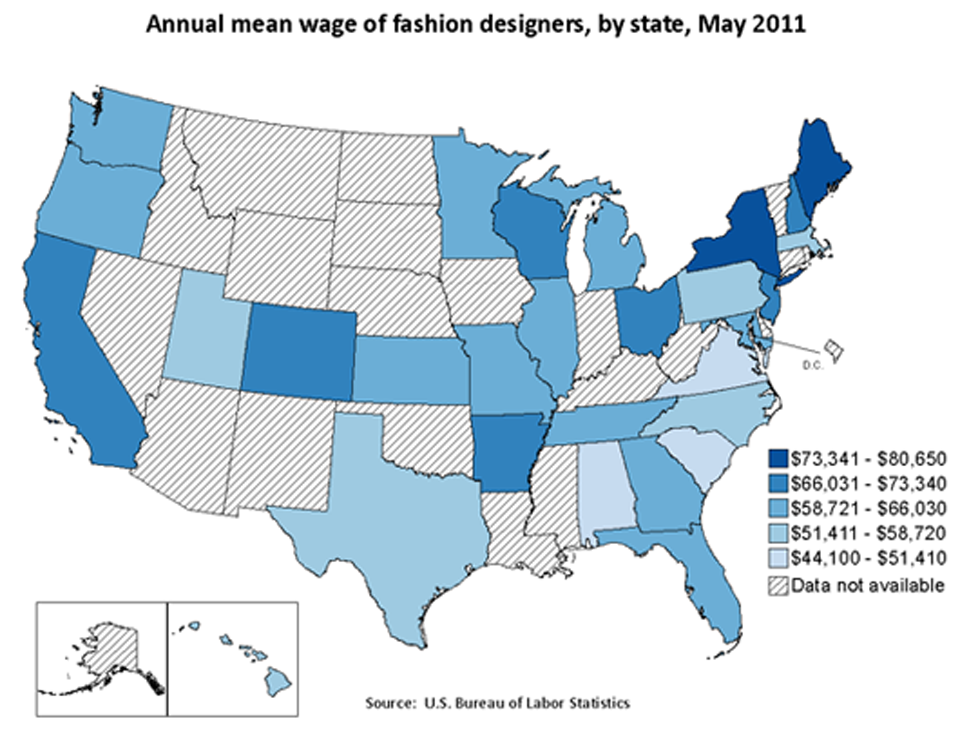
| State | Annual mean wage |
|---|---|
Alabama | $45,760 |
Alaska | (1) |
Arizona | (1) |
Arkansas | 68,690 |
California | 72,910 |
Colorado | 66,420 |
Connecticut | (1) |
Delaware | (1) |
District of Columbia | (1) |
Florida | 63,410 |
Georgia | 64,760 |
Hawaii | 54,610 |
Idaho | (1) |
Illinois | 61,340 |
Indiana | (1) |
Iowa | (1) |
Kansas | 63,190 |
Kentucky | (1) |
Louisiana | (1) |
Maine | 80,650 |
Maryland | 61,400 |
Massachusetts | 57,370 |
Michigan | 60,580 |
Minnesota | 64,680 |
Mississippi | (1) |
Missouri | 62,120 |
Montana | (1) |
Nebraska | (1) |
Nevada | (1) |
New Hampshire | 71,060 |
New Jersey | 67,220 |
New Mexico | (1) |
New York | 80,650 |
North Carolina | 56,580 |
North Dakota | (1) |
Ohio | 70,810 |
Oklahoma | (1) |
Oregon | 61,490 |
Pennsylvania | 57,220 |
Rhode Island | (1) |
South Carolina | 48,880 |
South Dakota | (1) |
Tennessee | 62,520 |
Texas | 55,310 |
Utah | 51,730 |
Vermont | (1) |
Virginia | 44,100 |
Washington | 64,710 |
West Virginia | (1) |
Wisconsin | 71,960 |
Wyoming | (1) |
Footnotes: | |
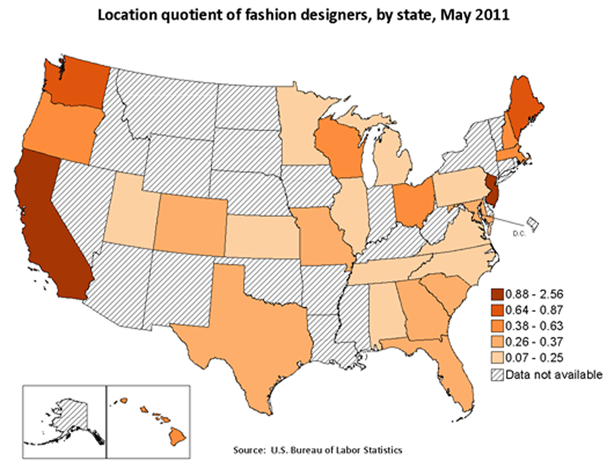
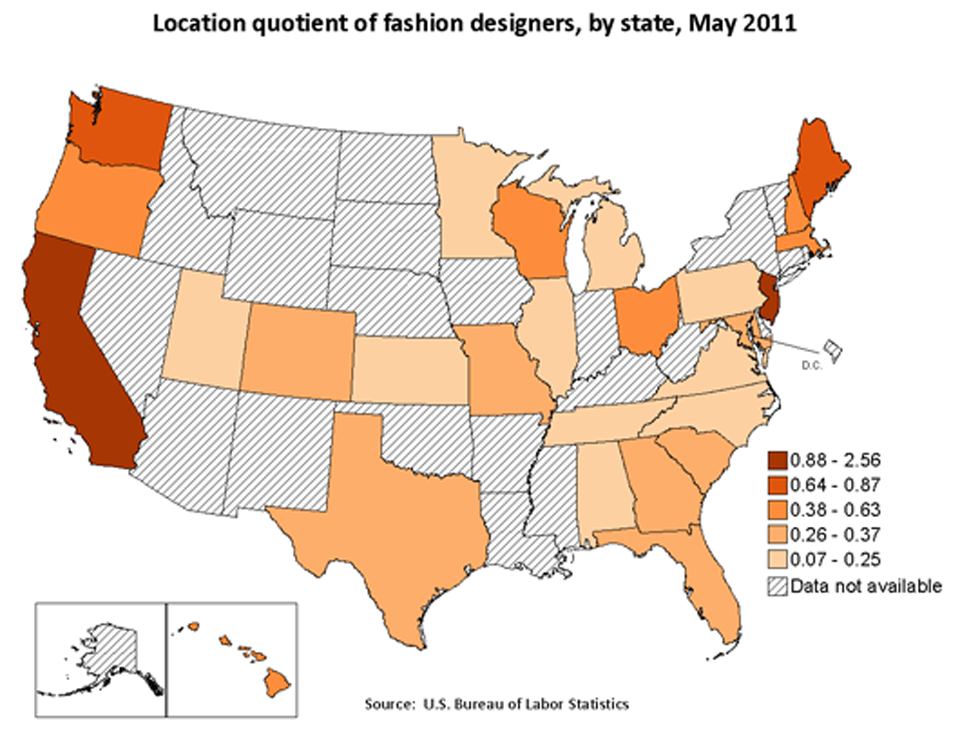
| State | Location quotient |
|---|---|
Alabama | 0.18 |
Alaska | (1) |
Arizona | (1) |
Arkansas | (1) |
California | 2.56 |
Colorado | 0.29 |
Connecticut | (1) |
Delaware | (1) |
District of Columbia | (1) |
Florida | 0.29 |
Georgia | 0.28 |
Hawaii | 0.45 |
Idaho | (1) |
Illinois | 0.15 |
Indiana | (1) |
Iowa | (1) |
Kansas | 0.19 |
Kentucky | (1) |
Louisiana | (1) |
Maine | 0.72 |
Maryland | 0.33 |
Massachusetts | 0.44 |
Michigan | 0.07 |
Minnesota | 0.18 |
Mississippi | (1) |
Missouri | 0.37 |
Montana | (1) |
Nebraska | (1) |
Nevada | (1) |
New Hampshire | 0.63 |
New Jersey | 0.98 |
New Mexico | (1) |
New York | (1) |
North Carolina | 0.23 |
North Dakota | (1) |
Ohio | 0.62 |
Oklahoma | (1) |
Oregon | 0.52 |
Pennsylvania | 0.25 |
Rhode Island | (1) |
South Carolina | 0.37 |
South Dakota | (1) |
Tennessee | 0.12 |
Texas | 0.32 |
Utah | 0.25 |
Vermont | (1) |
Virginia | 0.08 |
Washington | 0.87 |
West Virginia | (1) |
Wisconsin | 0.52 |
Wyoming | (1) |
Footnotes: | |
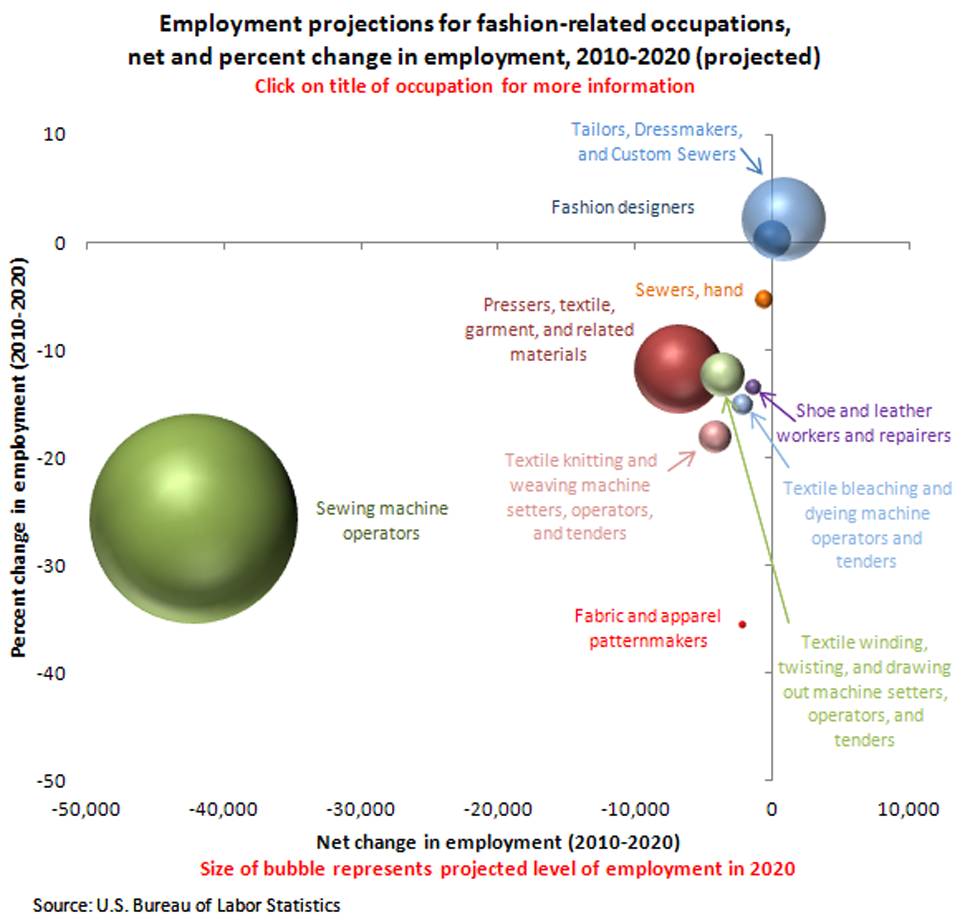
| Occupation | Net change in employment | Percent change in employment | Projected level of employment in 2020 |
|---|---|---|---|
Fabric and apparel patternmakers | -2,100 | -35.6 | 3.9 |
Fashion designers | 0 | 0.2 | 21.5 |
Pressers, textile, garment, and related materials | -6,800 | -11.8 | 51.0 |
Sewers, hand | -600 | -5.4 | 9.8 |
Sewing machine operators | -42,100 | -25.8 | 121.1 |
Shoe and leather workers and repairers | -1,400 | -13.6 | 8.8 |
Tailors, dressmakers, and custom sewers | 900 | 2.0 | 48.1 |
Textile bleaching and dyeing machine operators and tenders | -2,100 | -15.2 | 11.8 |
Textile knitting and weaving machine setters, operators, and tenders | -4,100 | -18.2 | 18.4 |
Textile winding, twisting, and drawing out machine setters, operators, and tenders | -3,600 | -12.4 | 25.4 |
Source: Employment Projections
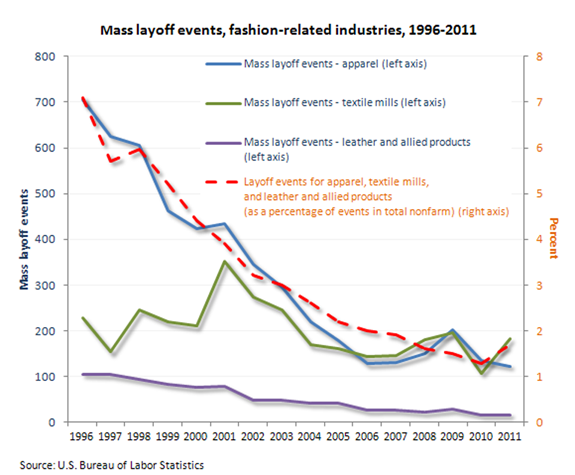
| Year | Mass layoff events - apparel | Mass layoff events - textile mills | Mass layoff events - leather and allied products | Layoff events for apparel, textile mills, and leather and allied products (as a percentage of events in total nonfarm) |
|---|---|---|---|---|
1996 | 706 | 228 | 106 | 7.1 |
1997 | 625 | 153 | 104 | 5.7 |
1998 | 605 | 245 | 94 | 6.0 |
1999 | 463 | 218 | 83 | 5.2 |
2000 | 424 | 209 | 76 | 4.4 |
2001 | 433 | 352 | 79 | 3.9 |
2002 | 346 | 272 | 48 | 3.2 |
2003 | 295 | 245 | 48 | 3.0 |
2004 | 220 | 169 | 42 | 2.6 |
2005 | 179 | 160 | 41 | 2.2 |
2006 | 128 | 143 | 26 | 2.0 |
2007 | 131 | 146 | 27 | 1.9 |
2008 | 149 | 179 | 22 | 1.6 |
2009 | 201 | 195 | 28 | 1.5 |
2010 | 134 | 109 | 17 | 1.3 |
2011 | 124 | 182 | 17 | 1.7 |
Source: Mass Layoff Statistics
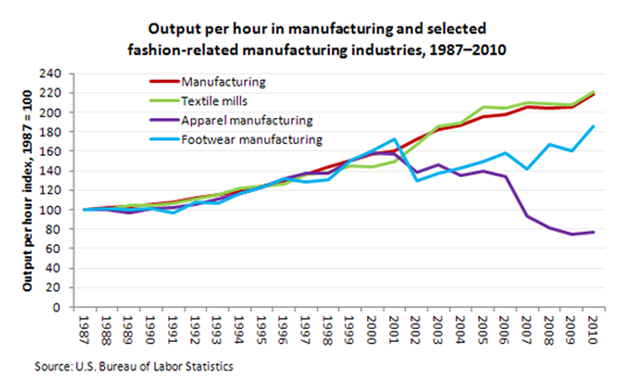
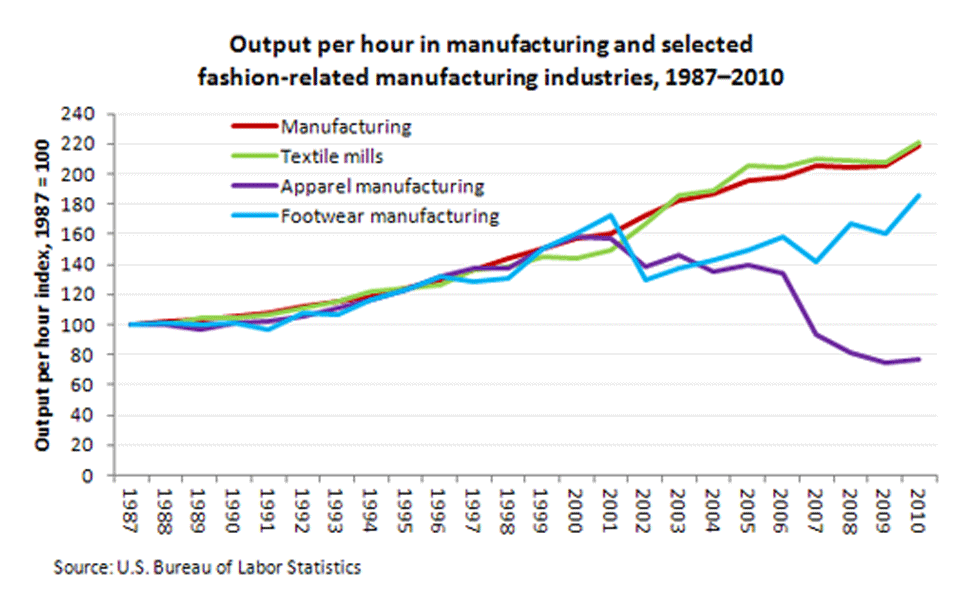
| Year | Output per hour | |||
|---|---|---|---|---|
| Manufacturing | Textile mills | Apparel manufacturing | Footwear manufacturing | |
1987 | 100.0 | 100.0 | 100.0 | 100.0 |
1988 | 102.1 | 100.2 | 100.3 | 101.1 |
1989 | 103.1 | 104.3 | 96.5 | 99.5 |
1990 | 105.4 | 104.8 | 100.9 | 100.5 |
1991 | 108.1 | 106.0 | 102.5 | 96.5 |
1992 | 112.2 | 111.3 | 105.6 | 107.8 |
1993 | 115.1 | 115.3 | 110.7 | 106.5 |
1994 | 119.2 | 121.6 | 116.0 | 116.0 |
1995 | 124.6 | 123.9 | 122.9 | 123.2 |
1996 | 129.1 | 126.6 | 131.4 | 131.3 |
1997 | 136.1 | 135.8 | 136.9 | 128.5 |
1998 | 143.7 | 138.9 | 137.5 | 130.4 |
1999 | 150.7 | 144.6 | 150.1 | 151.0 |
2000 | 157.4 | 144.2 | 158.2 | 160.1 |
2001 | 160.4 | 149.3 | 157.1 | 171.9 |
2002 | 172.1 | 167.1 | 137.9 | 129.4 |
2003 | 182.8 | 185.7 | 146.1 | 137.0 |
2004 | 187.0 | 188.8 | 134.7 | 142.3 |
2005 | 195.9 | 205.3 | 138.9 | 149.9 |
2006 | 197.7 | 204.3 | 134.5 | 158.3 |
2007 | 205.4 | 210.2 | 93.0 | 141.2 |
2008 | 204.4 | 208.8 | 81.3 | 167.5 |
2009 | 205.5 | 208.0 | 74.3 | 160.7 |
2010 | 219.1 | 220.5 | 77.0 | 185.6 |
Source: Labor Productivity and Costs
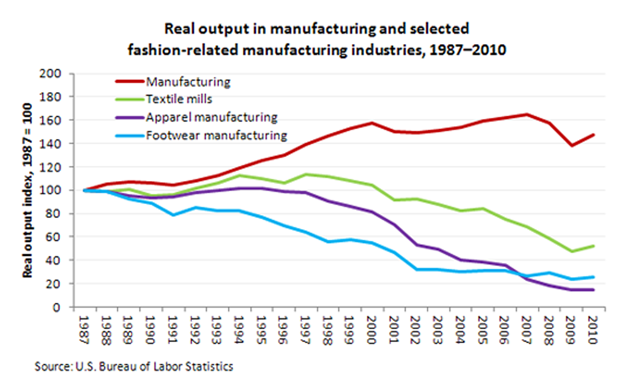
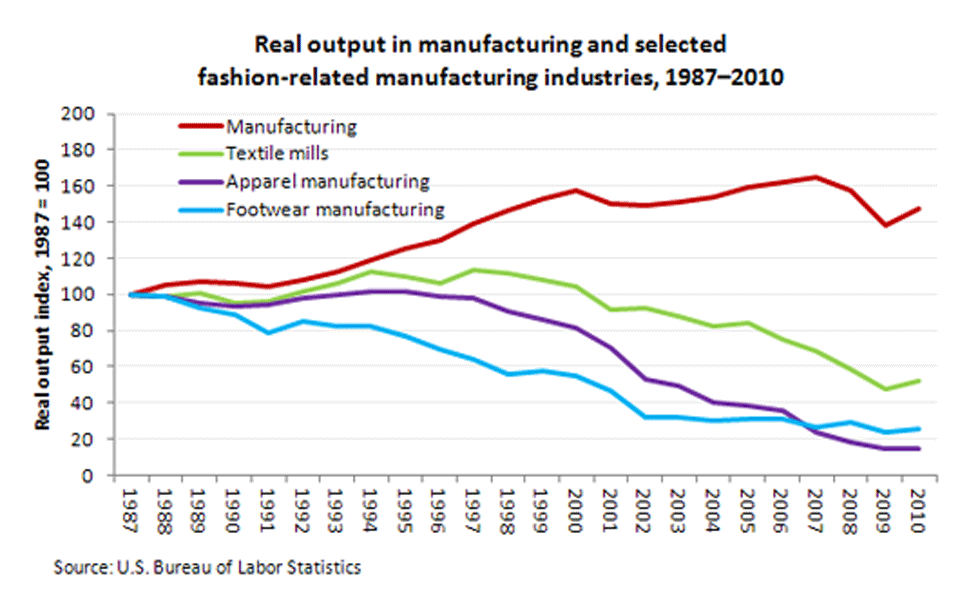
| Year | Total output | |||
|---|---|---|---|---|
| Manufacturing | Textile mills | Apparel manufacturing | Footwear manufacturing | |
1987 | 100.0 | 100.0 | 100.0 | 100.0 |
1988 | 105.2 | 98.9 | 98.9 | 98.6 |
1989 | 106.9 | 101.0 | 94.8 | 92.6 |
1990 | 106.6 | 95.4 | 93.5 | 88.8 |
1991 | 104.7 | 95.8 | 94.6 | 78.6 |
1992 | 108.2 | 101.6 | 97.5 | 84.8 |
1993 | 112.4 | 106.3 | 99.9 | 81.9 |
1994 | 119.1 | 112.4 | 102.0 | 82.8 |
1995 | 125.3 | 110.2 | 102.0 | 76.5 |
1996 | 129.6 | 106.1 | 99.0 | 69.9 |
1997 | 139.1 | 113.4 | 97.8 | 63.7 |
1998 | 146.5 | 111.5 | 90.9 | 55.7 |
1999 | 152.6 | 107.9 | 86.1 | 57.5 |
2000 | 157.3 | 104.0 | 81.4 | 54.6 |
2001 | 149.8 | 91.2 | 70.8 | 46.8 |
2002 | 149.3 | 92.5 | 53.3 | 31.8 |
2003 | 150.9 | 87.7 | 49.0 | 32.2 |
2004 | 153.5 | 82.4 | 40.7 | 30.2 |
2005 | 159.1 | 84.0 | 38.3 | 31.4 |
2006 | 161.7 | 75.1 | 35.5 | 31.5 |
2007 | 165.2 | 68.4 | 23.9 | 26.4 |
2008 | 157.9 | 58.3 | 18.3 | 29.6 |
2009 | 138.0 | 47.6 | 14.3 | 24.1 |
2010 | 147.2 | 52.1 | 14.3 | 25.3 |
Source: Labor Productivity and Costs
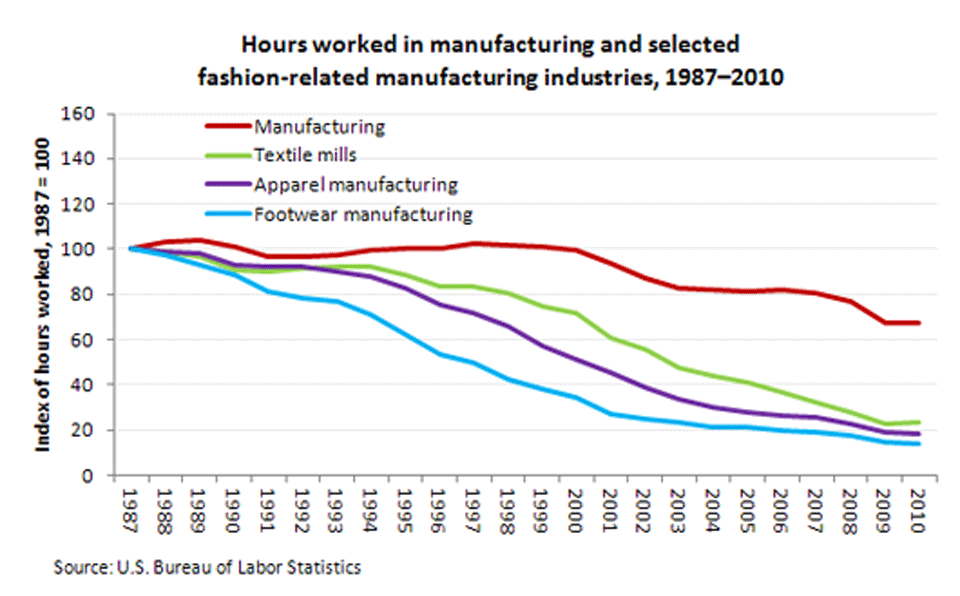
| Year | Hours | |||
|---|---|---|---|---|
| Manufacturing | Textile mills | Apparel manufacturing | Footwear manufacturing | |
1987 | 100.0 | 100.0 | 100.0 | 100.0 |
1988 | 103.0 | 98.6 | 98.6 | 97.5 |
1989 | 103.7 | 96.8 | 98.3 | 93.1 |
1990 | 101.1 | 91.0 | 92.6 | 88.3 |
1991 | 96.8 | 90.3 | 92.3 | 81.5 |
1992 | 96.4 | 91.3 | 92.3 | 78.7 |
1993 | 97.6 | 92.2 | 90.3 | 76.9 |
1994 | 99.9 | 92.5 | 87.9 | 71.4 |
1995 | 100.6 | 88.9 | 83.0 | 62.1 |
1996 | 100.4 | 83.8 | 75.3 | 53.2 |
1997 | 102.2 | 83.5 | 71.4 | 49.6 |
1998 | 101.9 | 80.3 | 66.1 | 42.7 |
1999 | 101.2 | 74.6 | 57.4 | 38.1 |
2000 | 99.9 | 72.1 | 51.5 | 34.1 |
2001 | 93.4 | 61.1 | 45.1 | 27.2 |
2002 | 86.8 | 55.3 | 38.7 | 24.6 |
2003 | 82.5 | 47.2 | 33.5 | 23.5 |
2004 | 82.1 | 43.7 | 30.2 | 21.2 |
2005 | 81.2 | 40.9 | 27.6 | 20.9 |
2006 | 81.8 | 36.7 | 26.4 | 19.9 |
2007 | 80.4 | 32.5 | 25.7 | 18.7 |
2008 | 77.2 | 27.9 | 22.5 | 17.7 |
2009 | 67.2 | 22.9 | 19.3 | 15.0 |
2010 | 67.2 | 23.6 | 18.6 | 13.6 |
Source: Labor Productivity and Costs
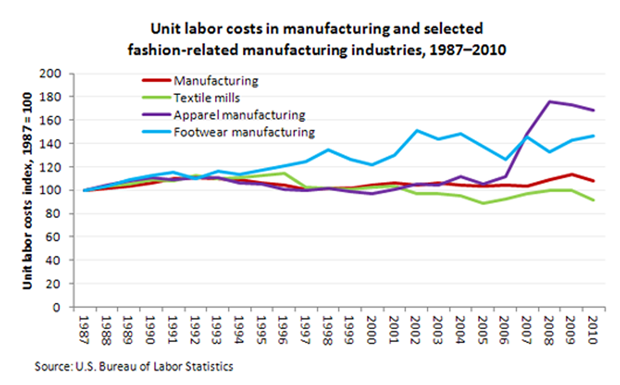
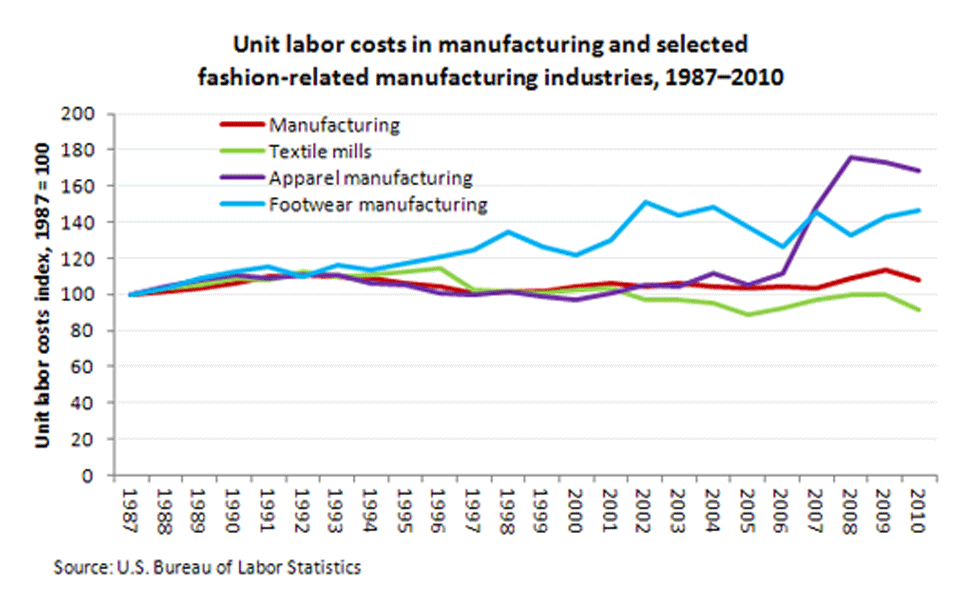
| Year | Unit labor costs | |||
|---|---|---|---|---|
| Manufacturing | Textile mills | Apparel manufacturing | Footwear manufacturing | |
1987 | 100.0 | 100.0 | 100.0 | 100.0 |
1988 | 101.4 | 103.6 | 104.0 | 103.6 |
1989 | 103.5 | 105.3 | 108.2 | 109.0 |
1990 | 106.1 | 108.8 | 110.9 | 112.4 |
1991 | 109.6 | 108.4 | 109.3 | 115.3 |
1992 | 110.5 | 112.3 | 111.0 | 110.0 |
1993 | 110.2 | 110.0 | 111.0 | 116.2 |
1994 | 109.1 | 110.6 | 106.4 | 113.2 |
1995 | 106.0 | 112.3 | 105.5 | 116.9 |
1996 | 104.1 | 114.0 | 101.0 | 120.6 |
1997 | 101.1 | 102.1 | 99.9 | 124.7 |
1998 | 101.7 | 101.8 | 101.6 | 134.7 |
1999 | 101.2 | 100.6 | 99.0 | 126.6 |
2000 | 104.4 | 102.7 | 97.4 | 121.6 |
2001 | 106.3 | 103.0 | 100.8 | 130.2 |
2002 | 104.6 | 96.9 | 105.5 | 151.0 |
2003 | 106.3 | 97.4 | 104.6 | 143.5 |
2004 | 104.8 | 95.6 | 111.8 | 148.5 |
2005 | 103.3 | 88.4 | 105.0 | 137.2 |
2006 | 104.5 | 92.2 | 111.4 | 125.9 |
2007 | 103.8 | 97.3 | 148.6 | 145.1 |
2008 | 108.7 | 100.1 | 176.1 | 132.9 |
2009 | 113.1 | 99.6 | 172.9 | 142.9 |
2010 | 107.8 | 91.6 | 168.7 | 146.2 |
Source: Labor Productivity and Costs
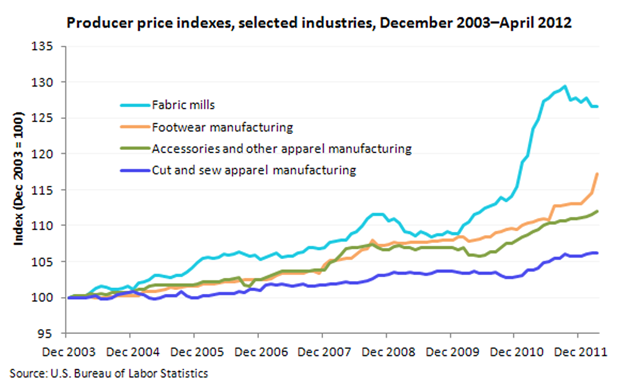
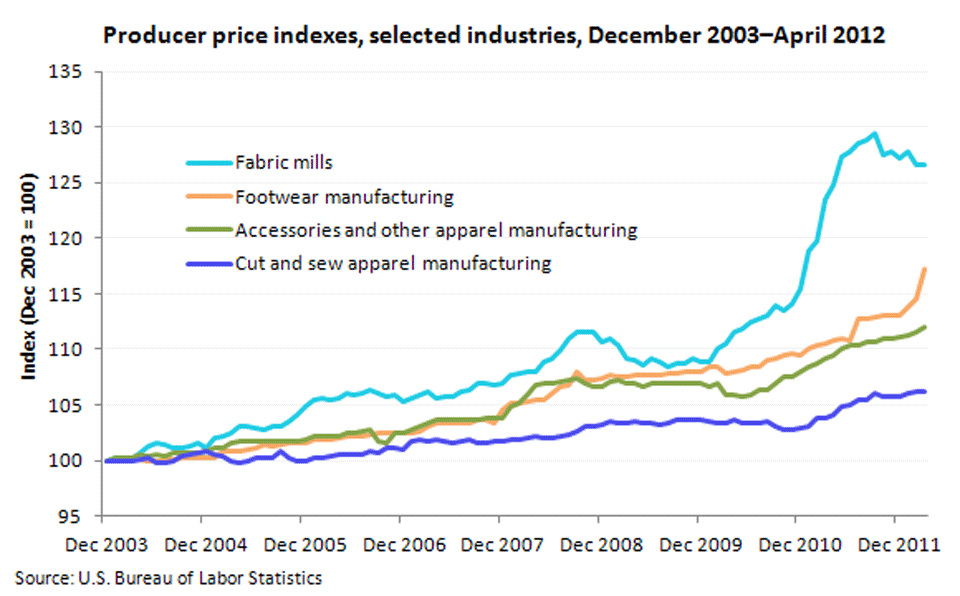
| Month | Cut and sew apparel manufacturing | Accessories and other apparel manufacturing | Footwear manufacturing | Fabric mills |
|---|---|---|---|---|
Dec 2003 | 100.0 | 100.0 | 100.0 | 100.0 |
Jan 2004 | 100.0 | 100.3 | 99.9 | 100.3 |
Feb 2004 | 99.9 | 100.3 | 100.1 | 100.3 |
Mar 2004 | 100.0 | 100.3 | 100.2 | 100.1 |
Apr 2004 | 100.1 | 100.5 | 100.1 | 100.7 |
May 2004 | 100.2 | 100.4 | 100.0 | 101.3 |
Jun 2004 | 99.8 | 100.6 | 100.0 | 101.5 |
Jul 2004 | 99.8 | 100.4 | 100.1 | 101.4 |
Aug 2004 | 99.9 | 100.7 | 100.1 | 101.1 |
Sep 2004 | 100.4 | 100.7 | 100.2 | 101.2 |
Oct 2004 | 100.5 | 100.7 | 100.2 | 101.3 |
Nov 2004 | 100.7 | 100.7 | 100.3 | 101.5 |
Dec 2004 | 100.8 | 100.8 | 100.3 | 101.2 |
Jan 2005 | 100.6 | 101.2 | 100.3 | 102.0 |
Feb 2005 | 100.4 | 101.2 | 100.9 | 102.1 |
Mar 2005 | 99.9 | 101.6 | 100.9 | 102.4 |
Apr 2005 | 99.8 | 101.7 | 100.9 | 103.0 |
May 2005 | 100.0 | 101.7 | 101.0 | 103.0 |
Jun 2005 | 100.3 | 101.7 | 101.1 | 102.9 |
Jul 2005 | 100.2 | 101.7 | 101.4 | 102.7 |
Aug 2005 | 100.3 | 101.7 | 101.3 | 103.0 |
Sep 2005 | 100.8 | 101.7 | 101.4 | 103.0 |
Oct 2005 | 100.2 | 101.7 | 101.5 | 103.5 |
Nov 2005 | 100.0 | 101.7 | 101.6 | 104.1 |
Dec 2005 | 100.0 | 101.8 | 101.5 | 104.8 |
Jan 2006 | 100.2 | 102.1 | 101.9 | 105.4 |
Feb 2006 | 100.3 | 102.1 | 101.9 | 105.6 |
Mar 2006 | 100.4 | 102.1 | 101.9 | 105.5 |
Apr 2006 | 100.5 | 102.2 | 102.0 | 105.6 |
May 2006 | 100.6 | 102.4 | 102.1 | 106.1 |
Jun 2006 | 100.5 | 102.4 | 102.1 | 105.9 |
Jul 2006 | 100.5 | 102.6 | 102.2 | 106.0 |
Aug 2006 | 100.8 | 102.7 | 102.3 | 106.3 |
Sep 2006 | 100.7 | 101.7 | 102.4 | 106.0 |
Oct 2006 | 101.1 | 101.6 | 102.4 | 105.8 |
Nov 2006 | 101.1 | 102.4 | 102.4 | 105.9 |
Dec 2006 | 101.0 | 102.4 | 102.4 | 105.3 |
Jan 2007 | 101.7 | 102.8 | 102.5 | 105.6 |
Feb 2007 | 101.8 | 103.0 | 102.6 | 105.9 |
Mar 2007 | 101.7 | 103.3 | 103.0 | 106.2 |
Apr 2007 | 101.9 | 103.6 | 103.3 | 105.6 |
May 2007 | 101.7 | 103.6 | 103.3 | 105.7 |
Jun 2007 | 101.6 | 103.6 | 103.3 | 105.8 |
Jul 2007 | 101.7 | 103.7 | 103.3 | 106.2 |
Aug 2007 | 101.8 | 103.6 | 103.3 | 106.3 |
Sep 2007 | 101.5 | 103.7 | 103.7 | 106.9 |
Oct 2007 | 101.6 | 103.8 | 103.6 | 106.9 |
Nov 2007 | 101.7 | 103.8 | 103.3 | 106.8 |
Dec 2007 | 101.7 | 103.8 | 104.5 | 106.9 |
Jan 2008 | 101.9 | 104.9 | 105.1 | 107.7 |
Feb 2008 | 101.8 | 105.2 | 105.2 | 107.8 |
Mar 2008 | 102.0 | 105.9 | 105.3 | 108.0 |
Apr 2008 | 102.2 | 106.8 | 105.5 | 108.0 |
May 2008 | 102.0 | 106.9 | 105.5 | 108.8 |
Jun 2008 | 102.0 | 106.9 | 106.1 | 109.1 |
Jul 2008 | 102.2 | 107.1 | 106.6 | 109.9 |
Aug 2008 | 102.3 | 107.2 | 106.8 | 111.0 |
Sep 2008 | 102.6 | 107.4 | 108.0 | 111.6 |
Oct 2008 | 103.1 | 106.9 | 107.2 | 111.6 |
Nov 2008 | 103.1 | 106.7 | 107.2 | 111.6 |
Dec 2008 | 103.2 | 106.6 | 107.4 | 110.7 |
Jan 2009 | 103.5 | 107.1 | 107.7 | 111.0 |
Feb 2009 | 103.4 | 107.2 | 107.5 | 110.4 |
Mar 2009 | 103.4 | 106.9 | 107.6 | 109.1 |
Apr 2009 | 103.5 | 106.9 | 107.7 | 109.0 |
May 2009 | 103.3 | 106.6 | 107.7 | 108.6 |
Jun 2009 | 103.3 | 106.9 | 107.7 | 109.1 |
Jul 2009 | 103.2 | 106.9 | 107.7 | 108.9 |
Aug 2009 | 103.4 | 107.0 | 107.8 | 108.5 |
Sep 2009 | 103.6 | 107.0 | 107.8 | 108.7 |
Oct 2009 | 103.7 | 107.0 | 108.0 | 108.7 |
Nov 2009 | 103.7 | 107.0 | 108.0 | 109.1 |
Dec 2009 | 103.7 | 107.0 | 108.0 | 108.8 |
Jan 2010 | 103.5 | 106.7 | 108.5 | 108.8 |
Feb 2010 | 103.4 | 107.0 | 108.4 | 110.0 |
Mar 2010 | 103.4 | 105.9 | 107.9 | 110.5 |
Apr 2010 | 103.6 | 105.9 | 108.0 | 111.5 |
May 2010 | 103.4 | 105.8 | 108.1 | 111.8 |
Jun 2010 | 103.4 | 105.9 | 108.5 | 112.4 |
Jul 2010 | 103.4 | 106.3 | 108.5 | 112.8 |
Aug 2010 | 103.5 | 106.4 | 109.0 | 113.1 |
Sep 2010 | 103.0 | 106.9 | 109.2 | 113.9 |
Oct 2010 | 102.8 | 107.6 | 109.5 | 113.5 |
Nov 2010 | 102.8 | 107.6 | 109.6 | 114.1 |
Dec 2010 | 102.9 | 108.0 | 109.4 | 115.5 |
Jan 2011 | 103.1 | 108.4 | 110.1 | 118.8 |
Feb 2011 | 103.8 | 108.7 | 110.3 | 119.7 |
Mar 2011 | 103.8 | 109.1 | 110.5 | 123.5 |
Apr 2011 | 104.1 | 109.4 | 110.8 | 124.8 |
May 2011 | 104.9 | 110.1 | 110.9 | 127.3 |
Jun 2011 | 105.0 | 110.3 | 110.8 | 127.8 |
Jul 2011 | 105.5 | 110.4 | 112.7 | 128.6 |
Aug 2011 | 105.4 | 110.7 | 112.8 | 128.8 |
Sep 2011 | 106.0 | 110.7 | 112.9 | 129.4 |
Oct 2011 | 105.8 | 111.0 | 113.0 | 127.5 |
Nov 2011 | 105.8 | 111.0 | 113.1 | 127.8 |
Dec 2011 | 105.8 | 111.1 | 113.1 | 127.2 |
Jan 2012 | 106.1 | 111.3 | 113.8 | 127.8 |
Feb 2012 | 106.2 | 111.6 | 114.5 | 126.6 |
Mar 2012 | 106.2 | 112.0 | 117.2 | 126.6 |
Apr 2012 | 106.4 | 114.1 | 118.1 | 126.4 |
Source: Producer Price Index
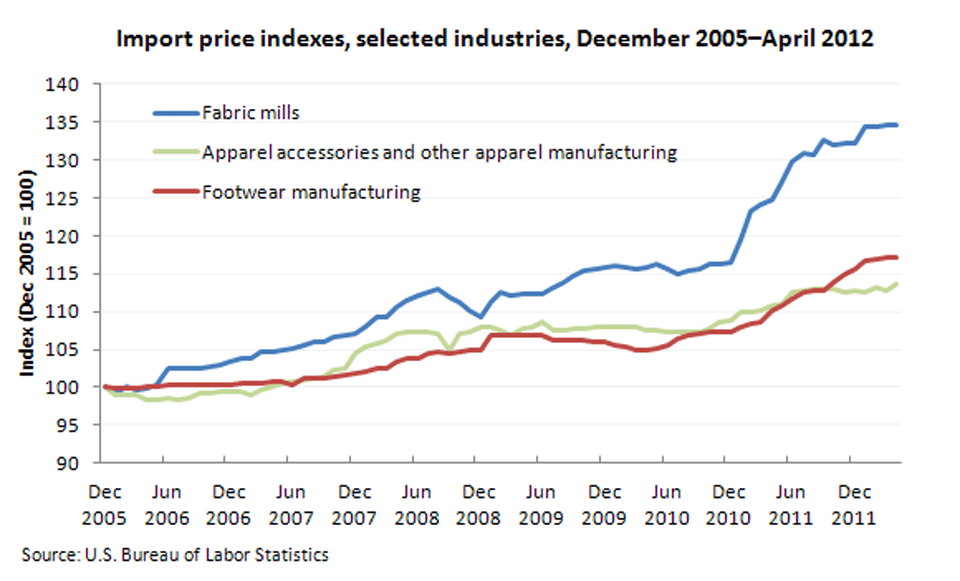
| Month | Fabric mills | Apparel accessories and other apparel manufacturing | Footwear manufacturing |
|---|---|---|---|
Dec 2005 | 100.0 | 100.0 | 100.0 |
Jan 2006 | 99.3 | 99.1 | 99.9 |
Feb 2006 | 100.0 | 99.1 | 99.9 |
Mar 2006 | 99.7 | 99.1 | 99.9 |
Apr 2006 | 99.9 | 98.4 | 100.0 |
May 2006 | 100.2 | 98.4 | 100.0 |
Jun 2006 | 102.4 | 98.6 | 100.2 |
Jul 2006 | 102.4 | 98.3 | 100.3 |
Aug 2006 | 102.5 | 98.5 | 100.3 |
Sep 2006 | 102.5 | 99.2 | 100.4 |
Oct 2006 | 102.7 | 99.2 | 100.4 |
Nov 2006 | 102.9 | 99.4 | 100.4 |
Dec 2006 | 103.3 | 99.4 | 100.4 |
Jan 2007 | 103.8 | 99.4 | 100.6 |
Feb 2007 | 103.9 | 99.0 | 100.6 |
Mar 2007 | 104.7 | 99.7 | 100.6 |
Apr 2007 | 104.7 | 100.1 | 100.7 |
May 2007 | 104.9 | 100.5 | 100.7 |
Jun 2007 | 105.1 | 100.7 | 100.4 |
Jul 2007 | 105.5 | 100.9 | 101.1 |
Aug 2007 | 105.9 | 101.1 | 101.2 |
Sep 2007 | 105.9 | 101.3 | 101.2 |
Oct 2007 | 106.6 | 102.2 | 101.3 |
Nov 2007 | 106.8 | 102.5 | 101.6 |
Dec 2007 | 107.1 | 104.5 | 101.8 |
Jan 2008 | 107.9 | 105.3 | 102.1 |
Feb 2008 | 109.2 | 105.7 | 102.4 |
Mar 2008 | 109.3 | 106.1 | 102.5 |
Apr 2008 | 110.6 | 107.0 | 103.4 |
May 2008 | 111.5 | 107.2 | 103.8 |
Jun 2008 | 112.2 | 107.4 | 103.8 |
Jul 2008 | 112.6 | 107.3 | 104.5 |
Aug 2008 | 112.9 | 107.0 | 104.6 |
Sep 2008 | 111.9 | 104.9 | 104.4 |
Oct 2008 | 111.3 | 107.1 | 104.6 |
Nov 2008 | 110.2 | 107.3 | 104.9 |
Dec 2008 | 109.2 | 108.0 | 105.0 |
Jan 2009 | 111.2 | 107.9 | 106.8 |
Feb 2009 | 112.6 | 107.5 | 106.8 |
Mar 2009 | 112.2 | 106.9 | 106.8 |
Apr 2009 | 112.3 | 107.7 | 106.9 |
May 2009 | 112.3 | 107.9 | 106.8 |
Jun 2009 | 112.4 | 108.5 | 106.8 |
Jul 2009 | 113.1 | 107.5 | 106.2 |
Aug 2009 | 113.9 | 107.6 | 106.3 |
Sep 2009 | 114.8 | 107.8 | 106.2 |
Oct 2009 | 115.3 | 107.8 | 106.1 |
Nov 2009 | 115.6 | 108.0 | 106.0 |
Dec 2009 | 115.9 | 108.0 | 105.9 |
Jan 2010 | 116.1 | 108.0 | 105.6 |
Feb 2010 | 115.9 | 108.0 | 105.3 |
Mar 2010 | 115.7 | 107.9 | 104.8 |
Apr 2010 | 115.8 | 107.6 | 105.0 |
May 2010 | 116.3 | 107.6 | 105.2 |
Jun 2010 | 115.5 | 107.4 | 105.6 |
Jul 2010 | 114.9 | 107.4 | 106.5 |
Aug 2010 | 115.4 | 107.3 | 106.8 |
Sep 2010 | 115.5 | 107.3 | 107.1 |
Oct 2010 | 116.2 | 107.8 | 107.3 |
Nov 2010 | 116.2 | 108.6 | 107.4 |
Dec 2010 | 116.4 | 108.8 | 107.4 |
Jan 2011 | 119.5 | 109.9 | 107.9 |
Feb 2011 | 123.2 | 110.0 | 108.3 |
Mar 2011 | 124.2 | 110.1 | 108.6 |
Apr 2011 | 124.7 | 110.8 | 110.1 |
May 2011 | 127.1 | 111.0 | 110.9 |
Jun 2011 | 129.9 | 112.5 | 111.6 |
Jul 2011 | 130.9 | 112.8 | 112.5 |
Aug 2011 | 130.7 | 113.0 | 112.8 |
Sep 2011 | 132.7 | 113.0 | 112.8 |
Oct 2011 | 132.0 | 113.0 | 113.9 |
Nov 2011 | 132.2 | 112.6 | 114.9 |
Dec 2011 | 132.3 | 112.7 | 115.5 |
Jan 2012 | 134.3 | 112.5 | 116.6 |
Feb 2012 | 134.3 | 113.1 | 117.0 |
Mar 2012 | 134.7 | 112.7 | 117.1 |
Apr 2012 | 134.7 | 113.6 | 117.2 |
Source: Import/Export Price Indexes