
An official website of the United States government
The .gov means it's official.
Federal government websites often end in .gov or .mil. Before sharing sensitive information,
make sure you're on a federal government site.
The site is secure.
The
https:// ensures that you are connecting to the official website and that any
information you provide is encrypted and transmitted securely.
Abraham T. Mosisa
Abraham T. Mosisa
This Spotlight highlights the labor market characteristics of foreign-born workers using data from the Current Population Survey (CPS). The foreign born are persons who reside in the United States but who were born outside the country or one of its outlying areas to parents who were not U.S. citizens. The foreign born include legally admitted immigrants, refugees, temporary residents such as students and temporary workers, and undocumented immigrants. The survey data, however, do not separately identify the numbers of persons in these categories. The native born are persons born in the United States or one of its outlying areas such as Puerto Rico or Guam or who were born abroad of at least one parent who was a U.S. citizen. Comparable data on nativity have been collected as part of the CPS since 1996.
Characteristic | Number | Percent |
---|---|---|
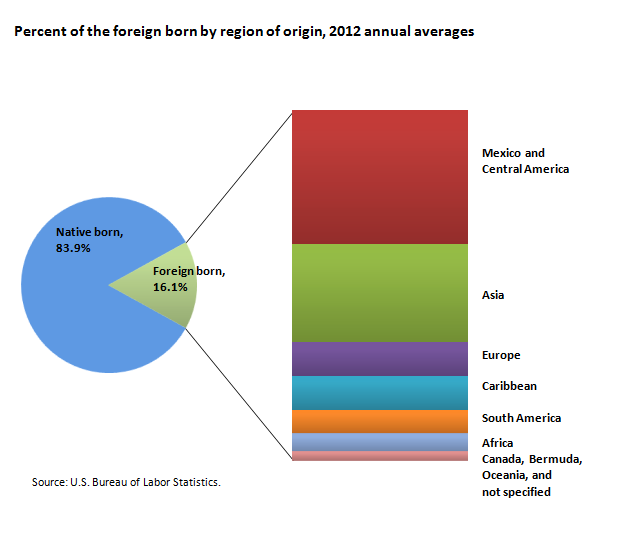
Native born | 129,948,000 | 83.9 |
Foreign born | 25,026,000 | 16.1 |
Mexico and Central America | 9,548,000 | 38.2 |
Asia, including the Middle East | 7,020,000 | 28.1 |
Europe | 2,467,000 | 9.9 |
Caribbean | 2,425,000 | 9.7 |
South America | 1,679,000 | 6.7 |
Africa | 1,232,000 | 4.9 |
Canada, Bermuda, Oceania, and not specified | 654,000 | 2.6 |
Note: MEXICO and CENTRAL AMERICA includes categories for Mexico, Belize, Costa Rica, El Salvador, Guatemala, Honduras, Nicaragua, and Panama. ASIA includes categories for Armenia, Azerbaijan, Georgia, Afghanistan, Bangladesh, Myanmar (Burma), Cambodia, China, Cyprus, Hong Kong, India, Indonesia, Iran, Iraq, Israel, Japan, Jordan, Korea, South Korea, Kuwait, Laos, Lebanon, Malaysia, Nepal, Pakistan, Philippines, Saudi Arabia, Singapore, Sri Lanka, Syria, Taiwan, Thailand, Turkey, Uzbekistan, Vietnam, Yemen, and Asia (not specified). EUROPE includes categories for Albania, Austria, Belgium, Bulgaria, Czechoslovakia, Denmark, Finland, France, Germany, Greece, Hungary, Ireland, Italy, Netherlands, Norway, Poland, Portugal, Azores, Romania, Spain, Sweden, Switzerland, United Kingdom, England, Scotland, Wales, Northern Ireland, Yugoslavia, Czech Republic, Slovakia, Bosnia and Herzegovina, Croatia, Macedonia, Serbia, Latvia, Lithuania, Belarus, Moldova, Russia, Ukraine, USSR, Europe (not specified), and Kosovo. CARIBBEAN includes categories for Antigua and Barbuda, Bahamas, Barbados, Cuba, Dominica, Dominican Republic, Grenada, Haiti, Jamaica, St. Kitts–Nevis, St. Lucia, St. Vincent and the Grenadines, Trinidad and Tobago, and West Indies (not specified). SOUTH AMERICA includes categories for Argentina, Bolivia, Brazil, Chile, Columbia, Ecuador, Guyana, Paraguay, Peru, Uruguay, Venezuela, South America (not specified), and Americas (not specified). AFRICA includes categories for Algeria, Cameroon, Cape Verde, Egypt, Ethiopia, Eritrea, Ghana, Kenya, Liberia, Morocco, Nigeria, Senegal, Sierra Leone, Somalia, South Africa, Sudan, Tanzania, Uganda, Zimbabwe, and Africa (not specified). OCEANIA includes categories for Australia, Fiji, New Zealand, Tonga, Samoa, and Oceania (not specified). |
In 2012, there were 25 million foreign-born persons age 16 years and older in the U.S. labor force, representing 16.1 percent of the total. About 130 million workers were native born, making up the remaining 83.9 percent of the total U.S. labor force. About 38 percent (9.5 million workers) of the foreign born were from Mexico and Central America, and 28 percent (7 million workers) were from Asia (including the Middle East). The share of foreign–born workers from Europe and the Caribbean was about 10 percent for each.
The share of the labor force that is foreign born grew steadily from 1996 to 2007, increasing from 10.8 percent to 15.7 percent over that period. After showing little change in 2008 and 2009, the share of the foreign-born labor force resumed a general upward trend, reaching 16.1 percent in 2012. Over the 1996–2012 period, the total labor force increased by about 21 million and more than half (about 11 million) of the increase was among the foreign born.
In 2012, more than three-fourths (75.6 percent) of the foreign-born labor force were between the ages of 25 and 54, whereas less than two-thirds (63.4 percent) of the native-born labor force were in that age group. In contrast, the share of the labor force age 55 and older was higher for the native born than for the foreign born: 21.7 percent versus 16.8 percent. The share of those ages 16 to 24 also was higher for the native born than for the foreign born: 14.9 percent versus 7.6 percent.
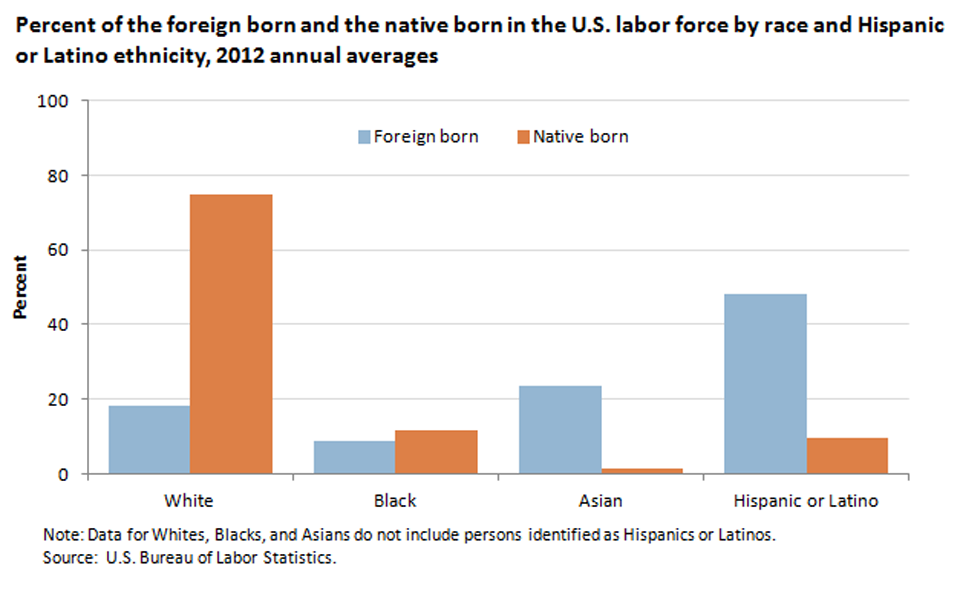
Race, ethnicity | Foreign born | Native born |
---|---|---|
White | 18.2 | 74.9 |
Black | 8.7 | 11.6 |
Asian | 23.7 | 1.5 |
Hispanic or Latino | 48.3 | 9.5 |
Other | 1.2 | 2.5 |
Note: Data for Whites, Blacks, and Asians do not include persons identified as Hispanics or Latinos. |
Hispanics made up 48.3 percent of the foreign-born labor force in 2012, compared with 9.5 percent of the native-born labor force. By contrast, Whites made up 18.2 percent of the foreign-born labor force and 74.9 percent of the native-born labor force. A greater share of the foreign-born labor force was Asian (23.7 percent) than was the native-born labor force (1.5 percent). Blacks made up 8.7 percent of the foreign-born labor force and 11.6 percent of the native-born labor force.
In 2012, the labor force participation rate was 66.3 percent for the foreign born and 63.2 percent for the native born. Men were more likely than women to be in the labor force, regardless of their nativity.
As has historically been the case, foreign-born men were more likely to be labor force participants (78.5 percent) than were native-born men (68.6 percent). In contrast, foreign-born women were less likely than native-born women to be in the labor force, 54.8 percent versus 58.2 percent.
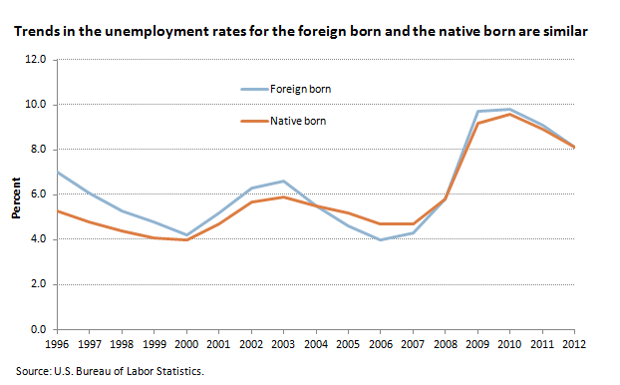
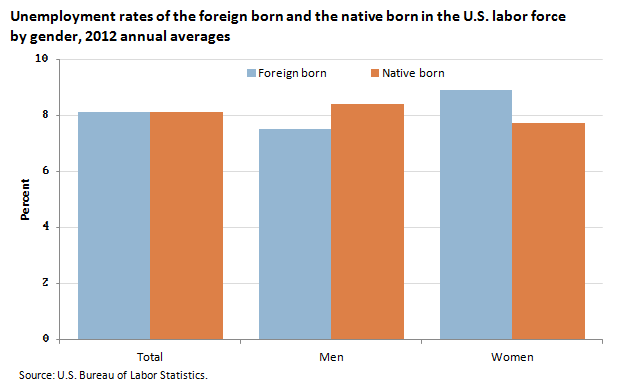
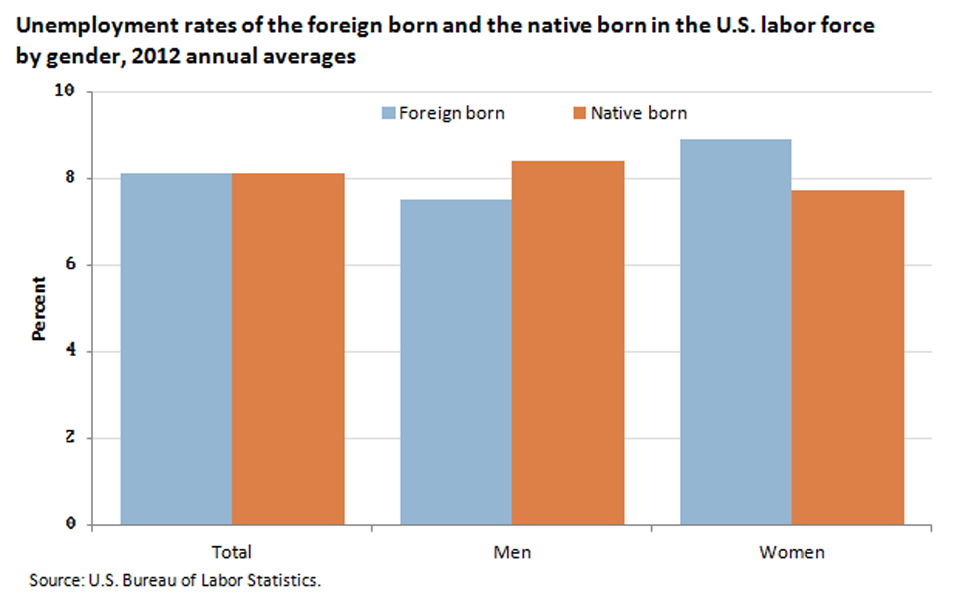
Year | Native born | Foreign born |
---|---|---|
1996 | 5.3 | 7.0 |
1997 | 4.8 | 6.1 |
1998 | 4.4 | 5.3 |
1999 | 4.1 | 4.8 |
2000 | 4.0 | 4.2 |
2001 | 4.7 | 5.2 |
2002 | 5.7 | 6.3 |
2003 | 5.9 | 6.6 |
2004 | 5.5 | 5.5 |
2005 | 5.2 | 4.6 |
2006 | 4.7 | 4.0 |
2007 | 4.7 | 4.3 |
2008 | 5.8 | 5.8 |
2009 | 9.2 | 9.7 |
2010 | 9.6 | 9.8 |
2011 | 8.9 | 9.1 |
2012 | 8.1 | 8.1 |
Source: U.S. Bureau of Labor Statistics. |
From 1996 to 2003, the jobless rate of the foreign born was higher than that of the native born. From 2005 to 2007, the unemployment rate for the foreign born was below the rate of the native born. The jobless rates of the foreign born and the native born were about the same from 2008 to 2012.
In 2012, the jobless rate for both the foreign born and native born was 8.1 percent. The unemployment rate for foreign-born men was lower than for native-born men: 7.5 percent versus 8.4 percent. Among women, however, the jobless rate for the foreign born was higher than that of the native born: 8.9 percent versus 7.7 percent.
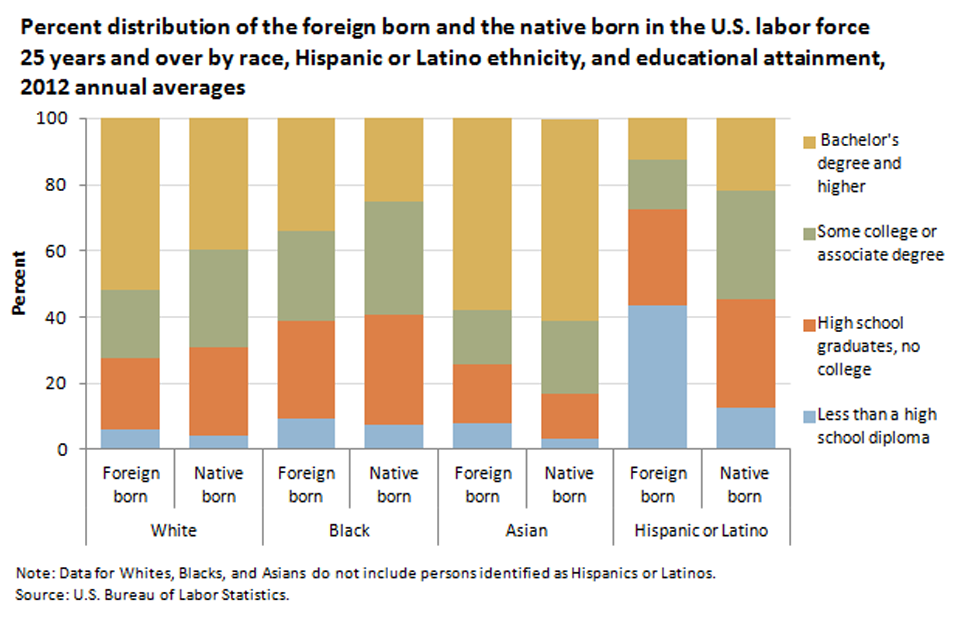
Education level | White | Black | Asian | Hispanic or Latino | ||||
---|---|---|---|---|---|---|---|---|
Foreign born | Native born | Foreign born | Native born | Foreign born | Native born | Foreign born | Native born | |
Less than a high school diploma | 6.0 | 4.0 | 9.1 | 7.3 | 7.8 | 3.2 | 43.6 | 12.5 |
High school graduates, no college | 21.8 | 26.9 | 29.6 | 33.5 | 18.1 | 13.8 | 28.9 | 33.0 |
Some college or associate degree | 20.6 | 29.3 | 27.2 | 34.1 | 16.0 | 21.8 | 14.9 | 32.5 |
Bachelor's degree and higher | 51.6 | 39.8 | 34.1 | 25.2 | 58.1 | 61.1 | 12.6 | 22.0 |
Note: Data for Whites, Blacks, and Asians do not include persons identified as Hispanics or Latinos. |
In 2012, 43.6 percent of foreign-born Hispanics who were in the labor force had less than a high school education and 12.6 percent had college degrees. By comparison, 12.5 percent of native-born Hispanics had not completed high school and 22.0 percent had graduated from college.
The proportions of foreign-born Whites and Blacks who had not completed high school were 6.0 percent and 9.1 percent, respectively. The proportions of those with college degrees were 51.6 percent for Whites and 34.1 percent for Blacks.
Among the native born, 4.0 percent of Whites and 7.3 percent of Blacks in the labor force had less than a high school education. The proportions of native-born Whites and Blacks who had college degrees were 39.8 percent and 25.2 percent, respectively.
Regardless of nativity, Asians have the highest proportion of college graduates of any race or ethnic group. For example, 58.1 percent of foreign-born Asians and 61.1 percent of native-born Asians had a bachelor's degree or higher in 2012.
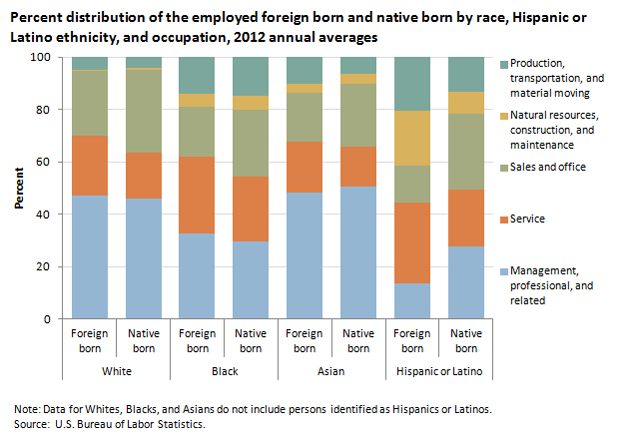
Occupation | White | Black | Asian | Hispanic or Latino | ||||
---|---|---|---|---|---|---|---|---|
Foreign born | Native born | Foreign born | Native born | Foreign born | Native born | Foreign born | Native born | |
Management, professional, and related | 47.2 | 45.8 | 32.5 | 29.6 | 48.3 | 50.7 | 13.7 | 27.7 |
Service | 22.8 | 17.6 | 29.4 | 24.8 | 19.4 | 14.9 | 30.9 | 21.7 |
Sales and office | 24.6 | 31.6 | 19.2 | 25.5 | 18.8 | 24.1 | 13.8 | 28.8 |
Natural resources, construction, and maintenance | 0.4 | 0.7 | 4.9 | 5.3 | 3.2 | 3.9 | 21.2 | 8.7 |
Production, transportation, and material moving | 5.1 | 4.3 | 14.0 | 14.8 | 10.2 | 6.4 | 20.5 | 13.2 |
Note: Data for Whites, Blacks, and Asians do not include persons identified as Hispanics or Latinos. |
Roughly similar proportions of employed foreign- and native-born Whites, Blacks, and Asians were employed in management, professional, and related occupations—the highest paying major job category—in 2012. Foreign-born Hispanics were less likely to be employed in management, professional, and related occupations than were their native-born counterparts: 13.7 percent versus 27.7 percent. In contrast, a larger share of foreign-born Hispanics than native-born Hispanics were working in service occupations; natural resources, construction, and maintenance occupations; and in production, transportation, and material moving occupations.
In all race and ethnicity groups, a larger share of the foreign born than of the native born worked in service occupations in 2012. In contrast, a smaller share of the foreign born than the native born in all race and ethnicity groups worked in sales and office occupations.
In 2012, the median usual weekly earnings of foreign-born full-time wage and salary workers were $625, compared with $797 for their native-born counterparts. The lower earnings of the foreign born partially reflect that foreign-born workers tend to have lower levels of educational attainment. In general, earnings are higher for people with more education.
Foreign-born men earned about 74.1 percent as much as native-born men: $665 per week, compared with $898 per week. Among women, the foreign born earned about 83.0 percent as much as the native born: $589 per week, compared with $710 per week. For both the native born and the foreign born, women’s earnings were lower than those of men.
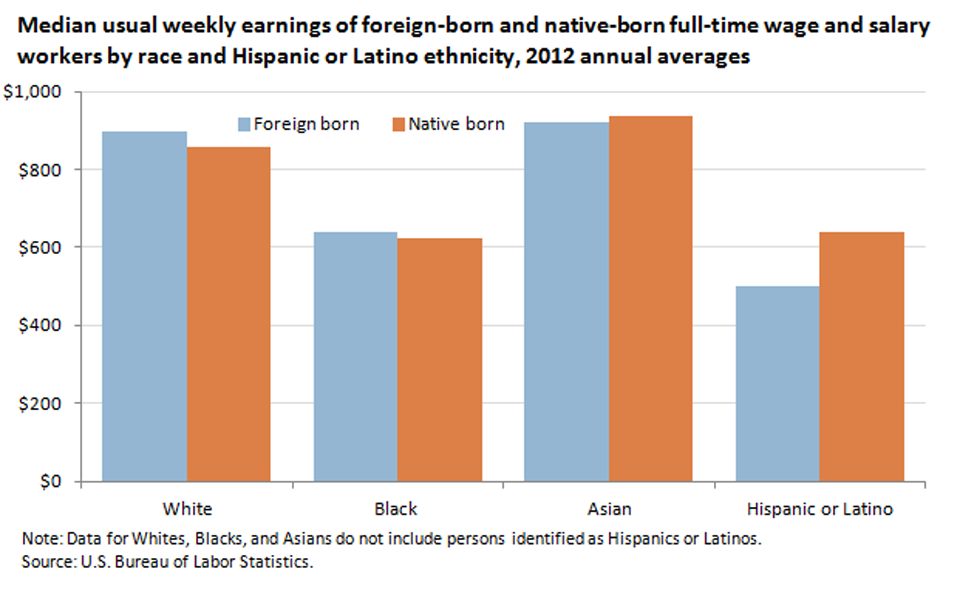
Nativity | White | Black | Asian | Hispanic or Latino |
---|---|---|---|---|
Foreign born | $898 | $640 | $922 | $501 |
Native born | 857 | 623 | 937 | 641 |
Note: Data for Whites, Blacks, and Asians do not include persons identified as Hispanics or Latinos. |
Among both foreign-born and native-born full-time wage and salary workers, median usual weekly earnings of Whites and Asians were considerably higher than for Blacks and Hispanics. Among Hispanics, foreign-born workers earned less than native-born workers. The median weekly earnings of foreign-born and native-born White, Black, and Asian workers were similar.
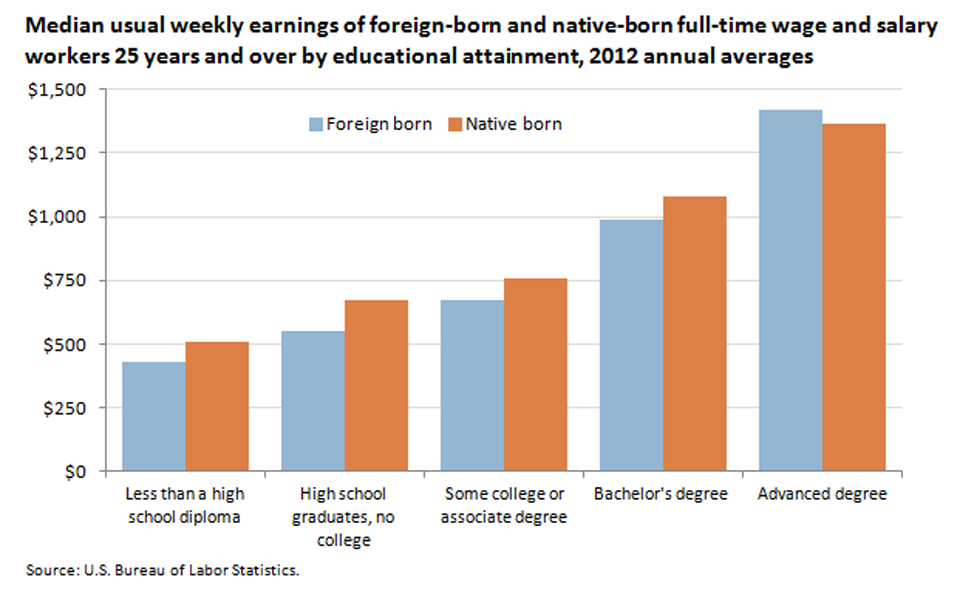
Education level | Foreign born | Native born |
---|---|---|
Less than a high school diploma | $428 | $510 |
High school graduates, no college | 550 | 675 |
Some college or associate degree | 673 | 758 |
Bachelor's degree | 990 | 1,077 |
Advanced degree | 1,420 | 1,365 |
Source: U.S. Bureau of Labor Statistics. |
Among both the native born and the foreign born, earnings increased with education. In 2012, the earnings of foreign-born and native-born workers with less than a high school diploma were about a third of those with an advanced degree. At most levels of educational attainment, foreign-born full-time wage and salary workers earned less than their native-born counterparts. The earnings of foreign-born and native-born workers with advanced degrees were not much different.
Abraham T. Mosisa is an economist in the Division of Labor Force Statistics, U.S. Bureau of Labor Statistics. You can contact him at mosisa.abraham@bls.gov.
The CPS is a monthly survey of about 60,000 households that obtains information on employment and unemployment among the nation’s civilian noninstitutional population age 16 and over. The presentation of the data on race and ethnicity in this Spotlight differs from that which appears in most analyses of CPS labor force data. The data are presented for White non-Hispanic, Black non-Hispanic, Asian non-Hispanic, and for persons of Hispanic or Latino ethnicity. Because persons of Hispanic or Latino ethnicity can be of any race, they are usually included in the race groups as well as shown separately in the Hispanic or Latino ethnicity group. The reason for the difference in the data presentation in this Spotlight is because about half of the foreign born are of Hispanic or Latino ethnicity (a much larger share than for the native born) and they have somewhat different labor force characteristics than the non-Hispanic foreign born. For more information on CPS data about the foreign born, see https://www.bls.gov/cps/demographics.htm#foreignborn.
For additional reading on the foreign born in the U.S. labor force, see the following articles from the Monthly Labor Review:
Archived BLS news releases on foreign-born workers: