
An official website of the United States government
An official website of the United States government
The .gov means it's official.
Federal government websites often end in .gov or .mil. Before sharing sensitive information,
make sure you're on a federal government site.
The site is secure.
The
https:// ensures that you are connecting to the official website and that any
information you provide is encrypted and transmitted securely.
Plan, direct, or coordinate advertising policies and programs or produce collateral materials, such as posters, contests, coupons, or giveaways, to create extra interest in the purchase of a product or service for a department, an entire organization, or on an account basis.
Employment estimate and mean wage estimates for Advertising and Promotions Managers:
| Employment (1) | Employment RSE (3) |
Mean hourly wage |
Mean annual wage (2) |
Wage RSE (3) |
|---|---|---|---|---|
| 20,630 | 2.9 % | $ 73.38 | $ 152,620 | 2.7 % |
Percentile wage estimates for Advertising and Promotions Managers:
| Percentile | 10% | 25% | 50% (Median) |
75% | 90% |
|---|---|---|---|---|---|
| Hourly Wage | $ 30.57 | $ 42.70 | $ 63.40 | $ 90.64 | (5) |
| Annual Wage (2) | $ 63,580 | $ 88,810 | $ 131,870 | $ 188,530 | (5) |
Industries with the highest published employment and wages for Advertising and Promotions Managers are provided. For a list of all industries with employment in Advertising and Promotions Managers, see the Create Customized Tables function.
Industries with the highest levels of employment in Advertising and Promotions Managers:
| Industry | Employment (1) | Percent of industry employment | Hourly mean wage | Annual mean wage (2) |
|---|---|---|---|---|
| Advertising, Public Relations, and Related Services | 7,950 | 1.59 | $ 82.37 | $ 171,320 |
| Management of Companies and Enterprises | 2,260 | 0.08 | $ 79.83 | $ 166,050 |
| Management, Scientific, and Technical Consulting Services | 920 | 0.05 | $ 56.95 | $ 118,450 |
| Newspaper, Periodical, Book, and Directory Publishers | 870 | 0.30 | $ 47.84 | $ 99,500 |
| Media Streaming Distribution Services, Social Networks, and Other Media Networks and Content Providers | 630 | 0.27 | (8) | (8) |
Industries with the highest concentration of employment in Advertising and Promotions Managers:
| Industry | Employment (1) | Percent of industry employment | Hourly mean wage | Annual mean wage (2) |
|---|---|---|---|---|
| Advertising, Public Relations, and Related Services | 7,950 | 1.59 | $ 82.37 | $ 171,320 |
| Sound Recording Industries | 140 | 0.65 | $ 51.66 | $ 107,450 |
| Radio and Television Broadcasting Stations | 480 | 0.39 | $ 72.14 | $ 150,060 |
| Web Search Portals, Libraries, Archives, and Other Information Services | 620 | 0.33 | $ 107.21 | $ 223,000 |
| Newspaper, Periodical, Book, and Directory Publishers | 870 | 0.30 | $ 47.84 | $ 99,500 |
Top paying industries for Advertising and Promotions Managers:
| Industry | Employment (1) | Percent of industry employment | Hourly mean wage | Annual mean wage (2) |
|---|---|---|---|---|
| Wholesale Trade Agents and Brokers | 50 | 0.01 | $ 107.55 | $ 223,700 |
| Web Search Portals, Libraries, Archives, and Other Information Services | 620 | 0.33 | $ 107.21 | $ 223,000 |
| Pharmaceutical and Medicine Manufacturing | 50 | 0.02 | $ 98.70 | $ 205,300 |
| Scientific Research and Development Services | 90 | 0.01 | $ 89.71 | $ 186,600 |
| Merchant Wholesalers, Durable Goods (4232, 4233, 4235, 4236, 4237, and 4239 only) | 200 | 0.01 | $ 89.44 | $ 186,040 |
States and areas with the highest published employment, location quotients, and wages for Advertising and Promotions Managers are provided. For a list of all areas with employment in Advertising and Promotions Managers, see the Create Customized Tables function.
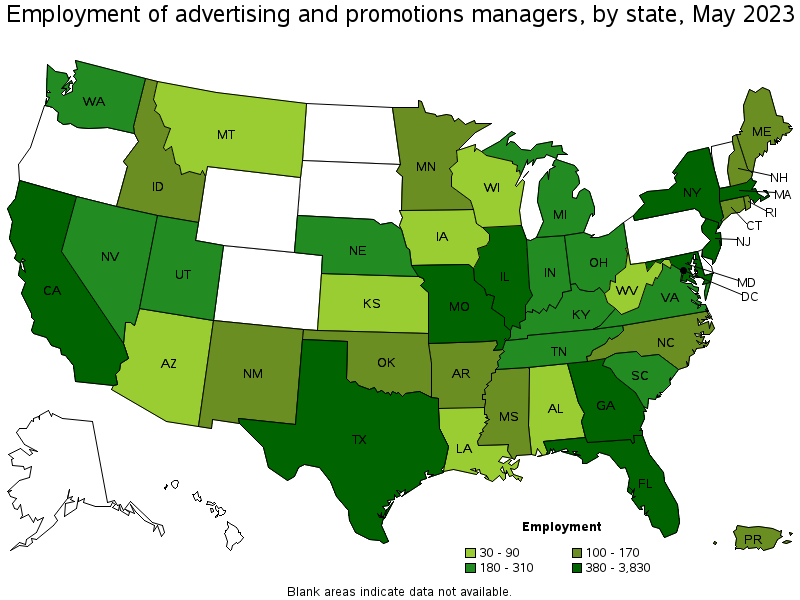
States with the highest employment level in Advertising and Promotions Managers:
| State | Employment (1) | Employment per thousand jobs | Location quotient (9) | Hourly mean wage | Annual mean wage (2) |
|---|---|---|---|---|---|
| New York | 3,830 | 0.41 | 3.00 | $ 103.88 | $ 216,080 |
| California | 2,880 | 0.16 | 1.18 | $ 84.18 | $ 175,080 |
| Texas | 2,250 | 0.17 | 1.22 | $ 55.15 | $ 114,700 |
| Florida | 1,140 | 0.12 | 0.87 | $ 58.84 | $ 122,390 |
| Maryland | 640 | 0.24 | 1.76 | $ 61.94 | $ 128,840 |
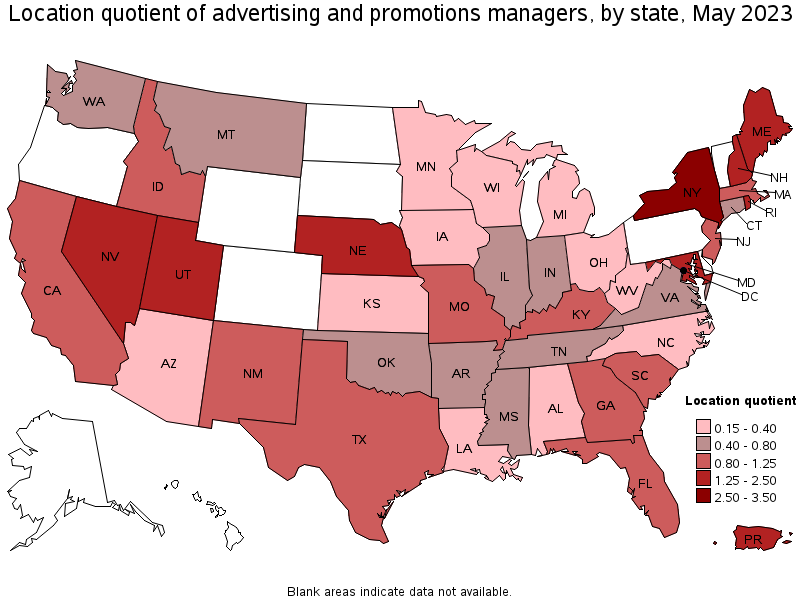
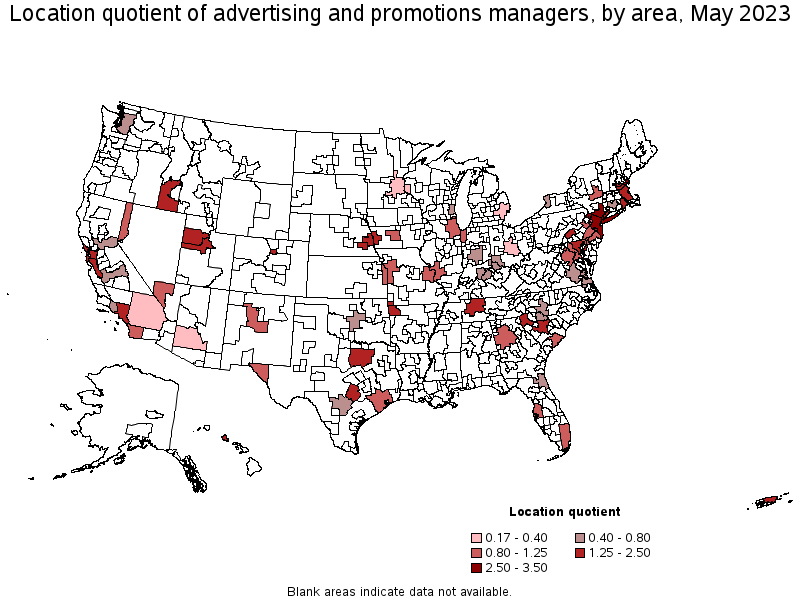
States with the highest concentration of jobs and location quotients in Advertising and Promotions Managers:
| State | Employment (1) | Employment per thousand jobs | Location quotient (9) | Hourly mean wage | Annual mean wage (2) |
|---|---|---|---|---|---|
| New York | 3,830 | 0.41 | 3.00 | $ 103.88 | $ 216,080 |
| Maine | 170 | 0.27 | 1.98 | $ 63.82 | $ 132,740 |
| Maryland | 640 | 0.24 | 1.76 | $ 61.94 | $ 128,840 |
| Rhode Island | 110 | 0.22 | 1.63 | $ 70.27 | $ 146,160 |
| New Hampshire | 140 | 0.20 | 1.48 | $ 64.66 | $ 134,490 |
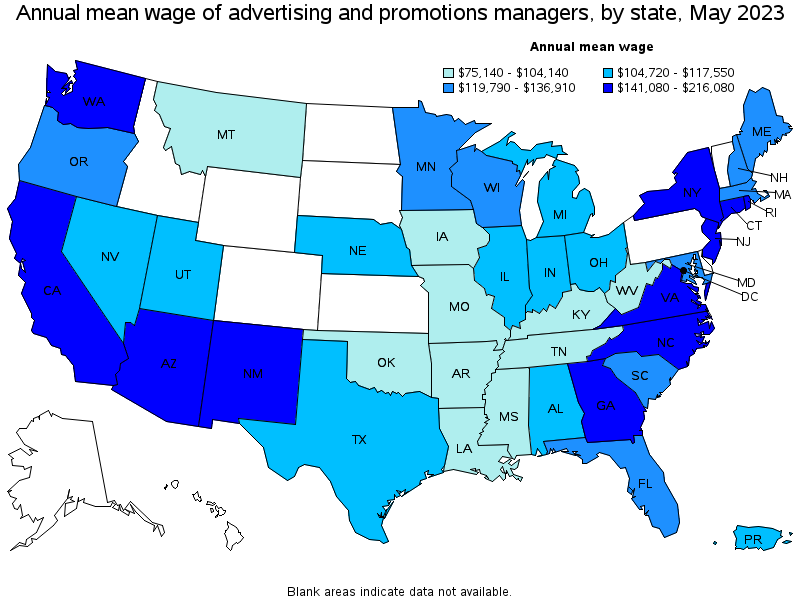
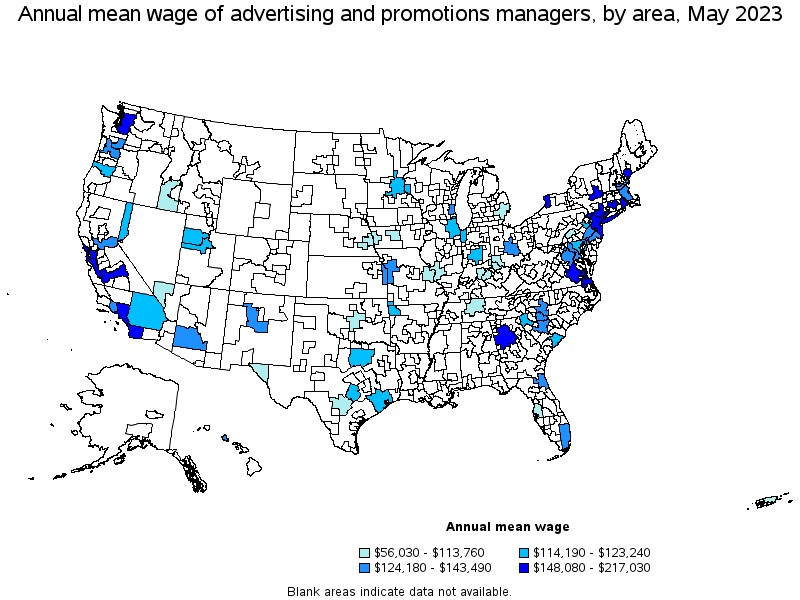
Top paying states for Advertising and Promotions Managers:
| State | Employment (1) | Employment per thousand jobs | Location quotient (9) | Hourly mean wage | Annual mean wage (2) |
|---|---|---|---|---|---|
| New York | 3,830 | 0.41 | 3.00 | $ 103.88 | $ 216,080 |
| New Jersey | 590 | 0.14 | 1.03 | $ 85.81 | $ 178,480 |
| California | 2,880 | 0.16 | 1.18 | $ 84.18 | $ 175,080 |
| Washington | 230 | 0.06 | 0.47 | $ 81.70 | $ 169,940 |
| Connecticut | 160 | 0.10 | 0.72 | $ 79.05 | $ 164,420 |
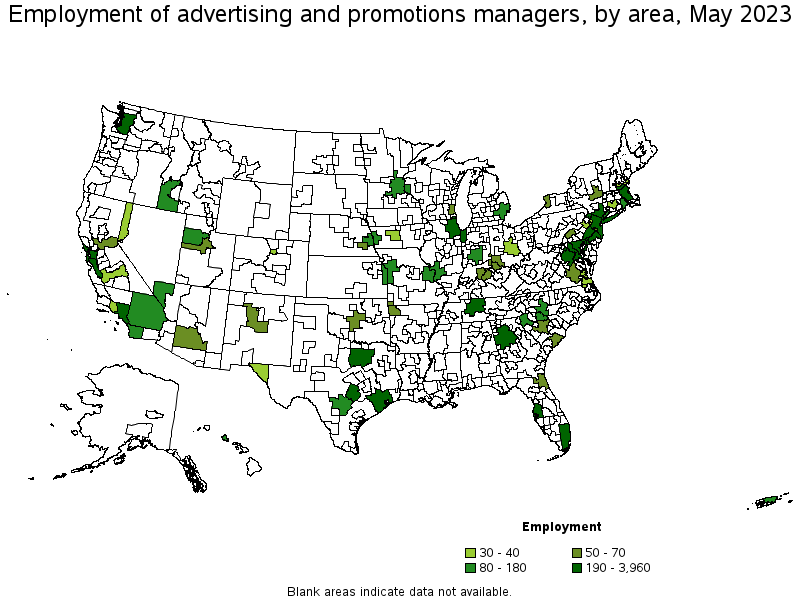
Metropolitan areas with the highest employment level in Advertising and Promotions Managers:
| Metropolitan area | Employment (1) | Employment per thousand jobs | Location quotient (9) | Hourly mean wage | Annual mean wage (2) |
|---|---|---|---|---|---|
| New York-Newark-Jersey City, NY-NJ-PA | 3,960 | 0.42 | 3.07 | $ 104.34 | $ 217,030 |
| Los Angeles-Long Beach-Anaheim, CA | 1,240 | 0.20 | 1.48 | $ 88.30 | $ 183,670 |
| Dallas-Fort Worth-Arlington, TX | 980 | 0.25 | 1.81 | $ 58.14 | $ 120,930 |
| San Francisco-Oakland-Hayward, CA | 710 | 0.29 | 2.16 | $ 90.53 | $ 188,310 |
| Chicago-Naperville-Elgin, IL-IN-WI | 520 | 0.12 | 0.85 | $ 58.87 | $ 122,440 |
| Boston-Cambridge-Nashua, MA-NH | 470 | 0.17 | 1.25 | $ 68.29 | $ 142,040 |
| Philadelphia-Camden-Wilmington, PA-NJ-DE-MD | 460 | 0.16 | 1.20 | $ 61.48 | $ 127,880 |
| Atlanta-Sandy Springs-Roswell, GA | 430 | 0.15 | 1.11 | $ 79.92 | $ 166,240 |
| Washington-Arlington-Alexandria, DC-VA-MD-WV | 410 | 0.13 | 0.99 | $ 66.53 | $ 138,390 |
| Miami-Fort Lauderdale-West Palm Beach, FL | 390 | 0.14 | 1.05 | $ 67.42 | $ 140,230 |
Metropolitan areas with the highest concentration of jobs and location quotients in Advertising and Promotions Managers:
| Metropolitan area | Employment (1) | Employment per thousand jobs | Location quotient (9) | Hourly mean wage | Annual mean wage (2) |
|---|---|---|---|---|---|
| New York-Newark-Jersey City, NY-NJ-PA | 3,960 | 0.42 | 3.07 | $ 104.34 | $ 217,030 |
| Portsmouth, NH-ME | 30 | 0.36 | 2.65 | $ 56.36 | $ 117,230 |
| San Francisco-Oakland-Hayward, CA | 710 | 0.29 | 2.16 | $ 90.53 | $ 188,310 |
| Lincoln, NE | 50 | 0.29 | 2.15 | $ 47.59 | $ 99,000 |
| Manchester, NH | 30 | 0.28 | 2.06 | $ 60.19 | $ 125,190 |
| Austin-Round Rock, TX | 340 | 0.28 | 2.05 | $ 59.08 | $ 122,890 |
| Dallas-Fort Worth-Arlington, TX | 980 | 0.25 | 1.81 | $ 58.14 | $ 120,930 |
| Baltimore-Columbia-Towson, MD | 310 | 0.24 | 1.74 | $ 59.09 | $ 122,910 |
| Boulder, CO | 40 | 0.23 | 1.70 | (8) | (8) |
| Fayetteville-Springdale-Rogers, AR-MO | 60 | 0.23 | 1.68 | $ 57.90 | $ 120,420 |
Top paying metropolitan areas for Advertising and Promotions Managers:
| Metropolitan area | Employment (1) | Employment per thousand jobs | Location quotient (9) | Hourly mean wage | Annual mean wage (2) |
|---|---|---|---|---|---|
| New York-Newark-Jersey City, NY-NJ-PA | 3,960 | 0.42 | 3.07 | $ 104.34 | $ 217,030 |
| Trenton, NJ | 50 | 0.20 | 1.51 | $ 96.65 | $ 201,040 |
| San Jose-Sunnyvale-Santa Clara, CA | 220 | 0.20 | 1.44 | $ 92.02 | $ 191,400 |
| Fresno, CA | 40 | 0.09 | 0.64 | $ 91.62 | $ 190,560 |
| Bridgeport-Stamford-Norwalk, CT | 80 | 0.21 | 1.52 | $ 90.61 | $ 188,460 |
| San Francisco-Oakland-Hayward, CA | 710 | 0.29 | 2.16 | $ 90.53 | $ 188,310 |
| Los Angeles-Long Beach-Anaheim, CA | 1,240 | 0.20 | 1.48 | $ 88.30 | $ 183,670 |
| Seattle-Tacoma-Bellevue, WA | 190 | 0.09 | 0.67 | $ 85.64 | $ 178,120 |
| Atlanta-Sandy Springs-Roswell, GA | 430 | 0.15 | 1.11 | $ 79.92 | $ 166,240 |
| San Diego-Carlsbad, CA | 180 | 0.12 | 0.88 | $ 75.64 | $ 157,330 |
These estimates are calculated with data collected from employers in all industry sectors, all metropolitan and nonmetropolitan areas, and all states and the District of Columbia. The top employment and wage figures are provided above. The complete list is available in the downloadable XLS files.
The percentile wage estimate is the value of a wage below which a certain percent of workers fall. The median wage is the 50th percentile wage estimate—50 percent of workers earn less than the median and 50 percent of workers earn more than the median. More about percentile wages.
(1) Estimates for detailed occupations do not sum to the totals because the totals include occupations not shown separately. Estimates do not include self-employed workers.
(2) Annual wages have been calculated by multiplying the hourly mean wage by a "year-round, full-time" hours figure of 2,080 hours; for those occupations where there is not an hourly wage published, the annual wage has been directly calculated from the reported survey data.
(3) The relative standard error (RSE) is a measure of the reliability of a survey statistic. The smaller the relative standard error, the more precise the estimate.
(5) This wage is equal to or greater than $115.00 per hour or $239,200 per year.
(8) Estimate not released.
(9) The location quotient is the ratio of the area concentration of occupational employment to the national average concentration. A location quotient greater than one indicates the occupation has a higher share of employment than average, and a location quotient less than one indicates the occupation is less prevalent in the area than average.
Other OEWS estimates and related information:
May 2023 National Occupational Employment and Wage Estimates
May 2023 State Occupational Employment and Wage Estimates
May 2023 Metropolitan and Nonmetropolitan Area Occupational Employment and Wage Estimates
May 2023 National Industry-Specific Occupational Employment and Wage Estimates
Last Modified Date: April 3, 2024