
An official website of the United States government
An official website of the United States government
The .gov means it's official.
Federal government websites often end in .gov or .mil. Before sharing sensitive information,
make sure you're on a federal government site.
The site is secure.
The
https:// ensures that you are connecting to the official website and that any
information you provide is encrypted and transmitted securely.
Plan, direct, or coordinate activities designed to create or maintain a favorable public image or raise issue awareness for their organization or client.
Employment estimate and mean wage estimates for Public Relations Managers:
| Employment (1) | Employment RSE (3) |
Mean hourly wage |
Mean annual wage (2) |
Wage RSE (3) |
|---|---|---|---|---|
| 72,760 | 3.2 % | $ 76.65 | $ 159,420 | 1.0 % |
Percentile wage estimates for Public Relations Managers:
| Percentile | 10% | 25% | 50% (Median) |
75% | 90% |
|---|---|---|---|---|---|
| Hourly Wage | $ 36.61 | $ 47.69 | $ 64.79 | $ 92.23 | (5) |
| Annual Wage (2) | $ 76,160 | $ 99,180 | $ 134,760 | $ 191,840 | (5) |
Industries with the highest published employment and wages for Public Relations Managers are provided. For a list of all industries with employment in Public Relations Managers, see the Create Customized Tables function.
Industries with the highest levels of employment in Public Relations Managers:
| Industry | Employment (1) | Percent of industry employment | Hourly mean wage | Annual mean wage (2) |
|---|---|---|---|---|
| Advertising, Public Relations, and Related Services | 8,810 | 1.76 | $ 95.26 | $ 198,140 |
| Management of Companies and Enterprises | 7,230 | 0.26 | $ 88.54 | $ 184,150 |
| Business, Professional, Labor, Political, and Similar Organizations | 5,720 | 1.34 | $ 78.16 | $ 162,580 |
| Colleges, Universities, and Professional Schools | 5,540 | 0.18 | $ 57.09 | $ 118,750 |
| Local Government, excluding Schools and Hospitals (OEWS Designation) | 3,060 | 0.06 | $ 59.03 | $ 122,780 |
Industries with the highest concentration of employment in Public Relations Managers:
| Industry | Employment (1) | Percent of industry employment | Hourly mean wage | Annual mean wage (2) |
|---|---|---|---|---|
| Advertising, Public Relations, and Related Services | 8,810 | 1.76 | $ 95.26 | $ 198,140 |
| Business, Professional, Labor, Political, and Similar Organizations | 5,720 | 1.34 | $ 78.16 | $ 162,580 |
| Grantmaking and Giving Services | 1,890 | 1.19 | $ 81.36 | $ 169,220 |
| Social Advocacy Organizations | 2,650 | 1.05 | $ 58.82 | $ 122,350 |
| Sound Recording Industries | 80 | 0.38 | (8) | (8) |
Top paying industries for Public Relations Managers:
| Industry | Employment (1) | Percent of industry employment | Hourly mean wage | Annual mean wage (2) |
|---|---|---|---|---|
| Oil and Gas Extraction | 50 | 0.05 | $ 119.45 | $ 248,460 |
| Motion Picture and Video Industries | 440 | 0.11 | $ 115.31 | $ 239,840 |
| Computer and Peripheral Equipment Manufacturing | 350 | 0.22 | $ 113.11 | $ 235,270 |
| Merchant Wholesalers, Nondurable Goods (4242 and 4246 only) | 580 | 0.15 | $ 111.30 | $ 231,500 |
| Couriers and Express Delivery Services | (8) | (8) | $ 110.59 | $ 230,030 |
States and areas with the highest published employment, location quotients, and wages for Public Relations Managers are provided. For a list of all areas with employment in Public Relations Managers, see the Create Customized Tables function.
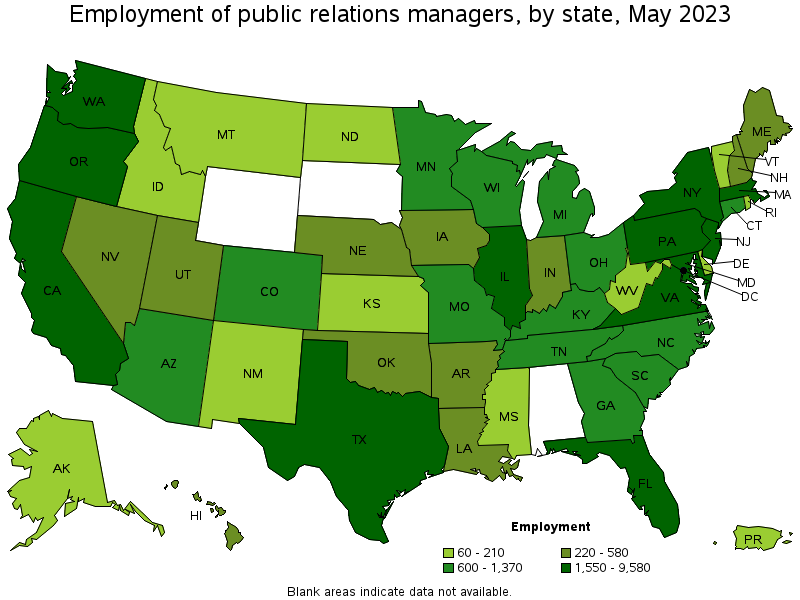
States with the highest employment level in Public Relations Managers:
| State | Employment (1) | Employment per thousand jobs | Location quotient (9) | Hourly mean wage | Annual mean wage (2) |
|---|---|---|---|---|---|
| California | 9,580 | 0.53 | 1.11 | $ 81.96 | $ 170,470 |
| District of Columbia | 8,220 | 11.71 | 24.45 | $ 107.74 | $ 224,110 |
| Texas | 8,040 | 0.59 | 1.24 | $ 60.85 | $ 126,570 |
| New York | 6,960 | 0.74 | 1.55 | $ 102.92 | $ 214,080 |
| Florida | 3,460 | 0.36 | 0.76 | $ 61.09 | $ 127,060 |
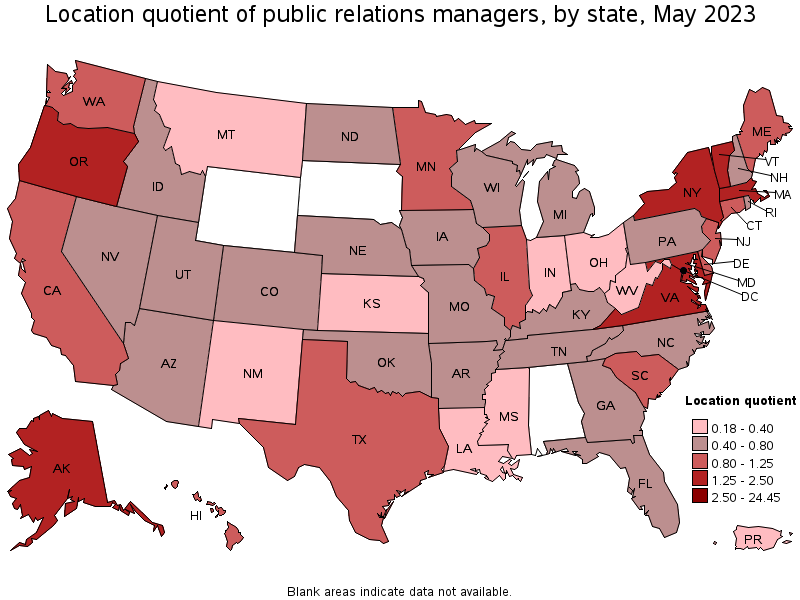
States with the highest concentration of jobs and location quotients in Public Relations Managers:
| State | Employment (1) | Employment per thousand jobs | Location quotient (9) | Hourly mean wage | Annual mean wage (2) |
|---|---|---|---|---|---|
| District of Columbia | 8,220 | 11.71 | 24.45 | $ 107.74 | $ 224,110 |
| Oregon | 2,100 | 1.08 | 2.26 | $ 59.82 | $ 124,420 |
| New York | 6,960 | 0.74 | 1.55 | $ 102.92 | $ 214,080 |
| Alaska | 210 | 0.69 | 1.43 | $ 58.39 | $ 121,450 |
| Massachusetts | 2,440 | 0.67 | 1.40 | $ 82.02 | $ 170,600 |
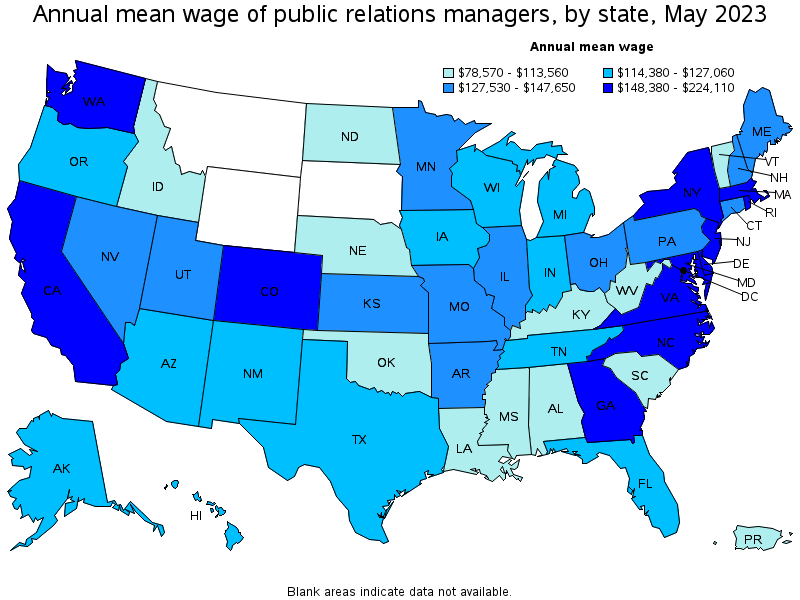
Top paying states for Public Relations Managers:
| State | Employment (1) | Employment per thousand jobs | Location quotient (9) | Hourly mean wage | Annual mean wage (2) |
|---|---|---|---|---|---|
| District of Columbia | 8,220 | 11.71 | 24.45 | $ 107.74 | $ 224,110 |
| New York | 6,960 | 0.74 | 1.55 | $ 102.92 | $ 214,080 |
| Virginia | 2,380 | 0.60 | 1.25 | $ 87.79 | $ 182,610 |
| New Jersey | 2,200 | 0.52 | 1.09 | $ 87.59 | $ 182,190 |
| Massachusetts | 2,440 | 0.67 | 1.40 | $ 82.02 | $ 170,600 |
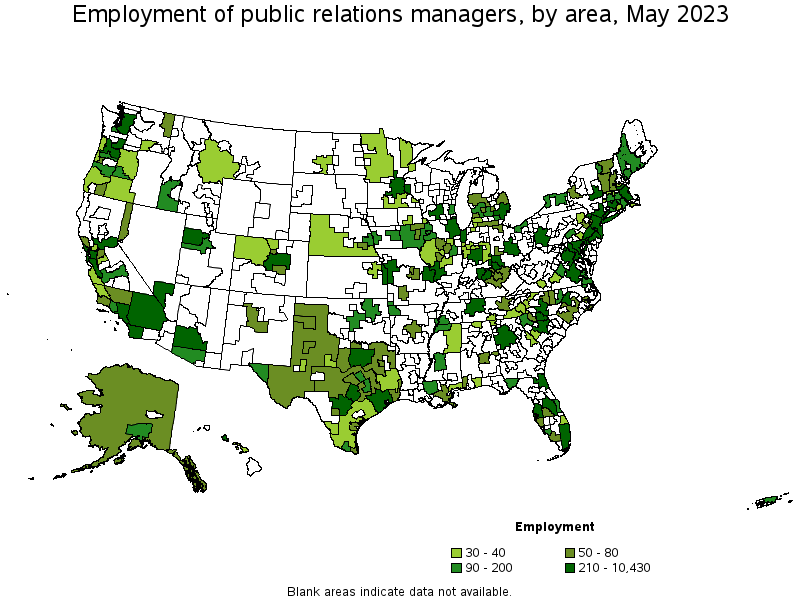
Metropolitan areas with the highest employment level in Public Relations Managers:
| Metropolitan area | Employment (1) | Employment per thousand jobs | Location quotient (9) | Hourly mean wage | Annual mean wage (2) |
|---|---|---|---|---|---|
| Washington-Arlington-Alexandria, DC-VA-MD-WV | 10,430 | 3.37 | 7.04 | $ 104.29 | $ 216,930 |
| New York-Newark-Jersey City, NY-NJ-PA | 7,450 | 0.78 | 1.64 | $ 104.12 | $ 216,570 |
| Los Angeles-Long Beach-Anaheim, CA | 3,500 | 0.57 | 1.18 | $ 74.42 | $ 154,800 |
| Chicago-Naperville-Elgin, IL-IN-WI | 2,730 | 0.61 | 1.27 | $ 66.66 | $ 138,650 |
| Dallas-Fort Worth-Arlington, TX | 2,640 | 0.66 | 1.39 | $ 63.03 | $ 131,100 |
| San Francisco-Oakland-Hayward, CA | 2,240 | 0.92 | 1.93 | $ 93.17 | $ 193,800 |
| Boston-Cambridge-Nashua, MA-NH | 2,070 | 0.75 | 1.57 | $ 84.25 | $ 175,240 |
| Houston-The Woodlands-Sugar Land, TX | 1,710 | 0.54 | 1.12 | $ 64.77 | $ 134,710 |
| Portland-Vancouver-Hillsboro, OR-WA | 1,520 | 1.26 | 2.63 | $ 63.34 | $ 131,760 |
| Miami-Fort Lauderdale-West Palm Beach, FL | 1,360 | 0.50 | 1.04 | $ 65.83 | $ 136,930 |
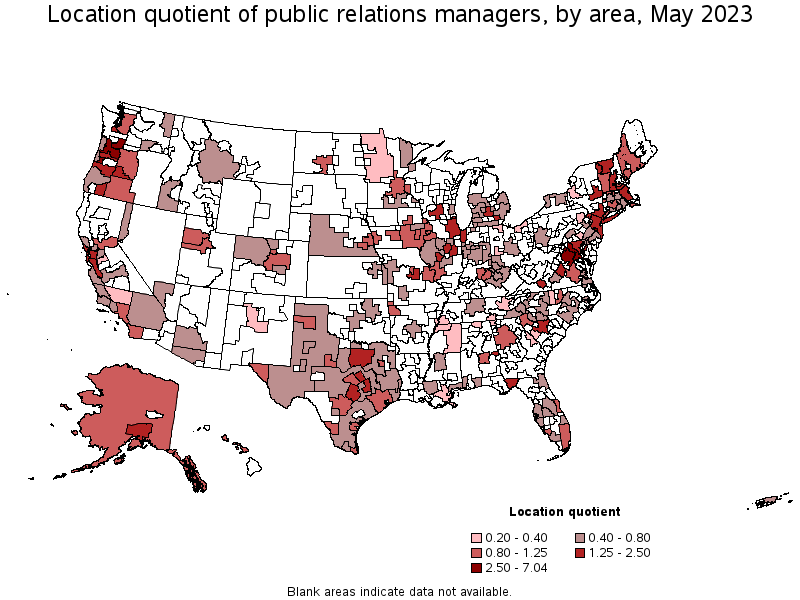
Metropolitan areas with the highest concentration of jobs and location quotients in Public Relations Managers:
| Metropolitan area | Employment (1) | Employment per thousand jobs | Location quotient (9) | Hourly mean wage | Annual mean wage (2) |
|---|---|---|---|---|---|
| Washington-Arlington-Alexandria, DC-VA-MD-WV | 10,430 | 3.37 | 7.04 | $ 104.29 | $ 216,930 |
| Trenton, NJ | 400 | 1.69 | 3.52 | $ 88.88 | $ 184,860 |
| Portland-Vancouver-Hillsboro, OR-WA | 1,520 | 1.26 | 2.63 | $ 63.34 | $ 131,760 |
| Corvallis, OR | 50 | 1.26 | 2.63 | $ 49.67 | $ 103,320 |
| Olympia-Tumwater, WA | 140 | 1.14 | 2.38 | $ 61.17 | $ 127,230 |
| Champaign-Urbana, IL | 110 | 1.07 | 2.23 | $ 51.53 | $ 107,180 |
| Charlottesville, VA | 120 | 1.04 | 2.16 | $ 69.91 | $ 145,410 |
| Bend-Redmond, OR | 90 | 1.00 | 2.08 | $ 51.10 | $ 106,280 |
| Austin-Round Rock, TX | 1,210 | 0.98 | 2.04 | $ 65.71 | $ 136,670 |
| San Francisco-Oakland-Hayward, CA | 2,240 | 0.92 | 1.93 | $ 93.17 | $ 193,800 |
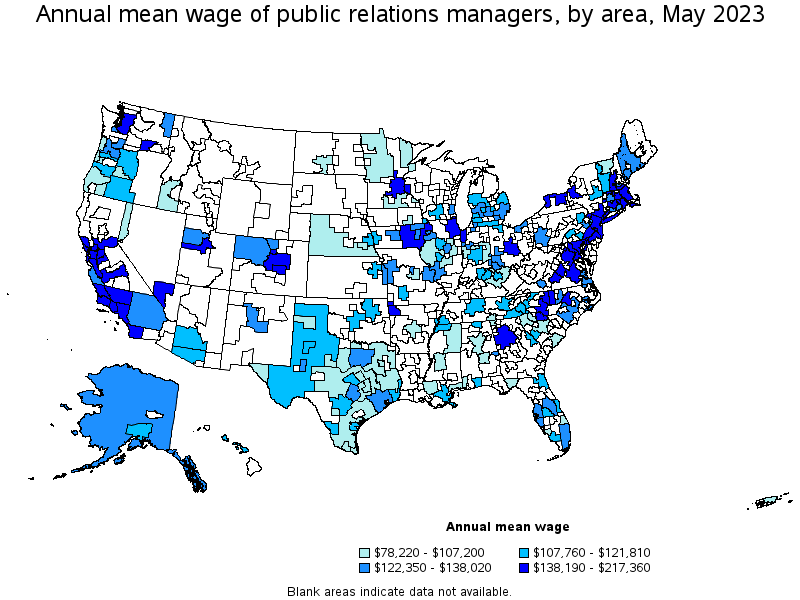
Top paying metropolitan areas for Public Relations Managers:
| Metropolitan area | Employment (1) | Employment per thousand jobs | Location quotient (9) | Hourly mean wage | Annual mean wage (2) |
|---|---|---|---|---|---|
| San Jose-Sunnyvale-Santa Clara, CA | 1,050 | 0.92 | 1.92 | $ 104.50 | $ 217,360 |
| Washington-Arlington-Alexandria, DC-VA-MD-WV | 10,430 | 3.37 | 7.04 | $ 104.29 | $ 216,930 |
| New York-Newark-Jersey City, NY-NJ-PA | 7,450 | 0.78 | 1.64 | $ 104.12 | $ 216,570 |
| San Francisco-Oakland-Hayward, CA | 2,240 | 0.92 | 1.93 | $ 93.17 | $ 193,800 |
| Trenton, NJ | 400 | 1.69 | 3.52 | $ 88.88 | $ 184,860 |
| Fayetteville-Springdale-Rogers, AR-MO | 150 | 0.57 | 1.20 | $ 85.09 | $ 176,990 |
| Seattle-Tacoma-Bellevue, WA | 1,130 | 0.55 | 1.14 | $ 84.37 | $ 175,480 |
| Boston-Cambridge-Nashua, MA-NH | 2,070 | 0.75 | 1.57 | $ 84.25 | $ 175,240 |
| Modesto, CA | 40 | 0.19 | 0.39 | $ 79.66 | $ 165,690 |
| Rochester, NY | 140 | 0.28 | 0.59 | $ 79.08 | $ 164,490 |
Nonmetropolitan areas with the highest employment in Public Relations Managers:
| Nonmetropolitan area | Employment (1) | Employment per thousand jobs | Location quotient (9) | Hourly mean wage | Annual mean wage (2) |
|---|---|---|---|---|---|
| Southwest Maine nonmetropolitan area | 100 | 0.55 | 1.16 | $ 61.58 | $ 128,080 |
| Southeast Iowa nonmetropolitan area | 90 | 0.41 | 0.86 | $ 66.44 | $ 138,190 |
| North Texas Region of Texas nonmetropolitan area | 70 | 0.26 | 0.54 | $ 48.81 | $ 101,520 |
| West Central-Southwest New Hampshire nonmetropolitan area | 60 | 0.64 | 1.33 | $ 74.60 | $ 155,160 |
| Alaska nonmetropolitan area | 60 | 0.58 | 1.21 | $ 60.11 | $ 125,030 |
Nonmetropolitan areas with the highest concentration of jobs and location quotients in Public Relations Managers:
| Nonmetropolitan area | Employment (1) | Employment per thousand jobs | Location quotient (9) | Hourly mean wage | Annual mean wage (2) |
|---|---|---|---|---|---|
| Northern Vermont nonmetropolitan area | 50 | 0.70 | 1.46 | $ 47.84 | $ 99,510 |
| West Central-Southwest New Hampshire nonmetropolitan area | 60 | 0.64 | 1.33 | $ 74.60 | $ 155,160 |
| Alaska nonmetropolitan area | 60 | 0.58 | 1.21 | $ 60.11 | $ 125,030 |
| Southwest Maine nonmetropolitan area | 100 | 0.55 | 1.16 | $ 61.58 | $ 128,080 |
| Central Oregon nonmetropolitan area | 30 | 0.54 | 1.13 | $ 54.97 | $ 114,330 |
Top paying nonmetropolitan areas for Public Relations Managers:
| Nonmetropolitan area | Employment (1) | Employment per thousand jobs | Location quotient (9) | Hourly mean wage | Annual mean wage (2) |
|---|---|---|---|---|---|
| Massachusetts nonmetropolitan area | 30 | 0.50 | 1.05 | $ 74.84 | $ 155,660 |
| West Central-Southwest New Hampshire nonmetropolitan area | 60 | 0.64 | 1.33 | $ 74.60 | $ 155,160 |
| Southeast Iowa nonmetropolitan area | 90 | 0.41 | 0.86 | $ 66.44 | $ 138,190 |
| Northwest Colorado nonmetropolitan area | 30 | 0.27 | 0.57 | $ 64.32 | $ 133,790 |
| Southeast Coastal North Carolina nonmetropolitan area | 50 | 0.21 | 0.45 | $ 62.63 | $ 130,270 |
These estimates are calculated with data collected from employers in all industry sectors, all metropolitan and nonmetropolitan areas, and all states and the District of Columbia. The top employment and wage figures are provided above. The complete list is available in the downloadable XLS files.
The percentile wage estimate is the value of a wage below which a certain percent of workers fall. The median wage is the 50th percentile wage estimate—50 percent of workers earn less than the median and 50 percent of workers earn more than the median. More about percentile wages.
(1) Estimates for detailed occupations do not sum to the totals because the totals include occupations not shown separately. Estimates do not include self-employed workers.
(2) Annual wages have been calculated by multiplying the hourly mean wage by a "year-round, full-time" hours figure of 2,080 hours; for those occupations where there is not an hourly wage published, the annual wage has been directly calculated from the reported survey data.
(3) The relative standard error (RSE) is a measure of the reliability of a survey statistic. The smaller the relative standard error, the more precise the estimate.
(5) This wage is equal to or greater than $115.00 per hour or $239,200 per year.
(8) Estimate not released.
(9) The location quotient is the ratio of the area concentration of occupational employment to the national average concentration. A location quotient greater than one indicates the occupation has a higher share of employment than average, and a location quotient less than one indicates the occupation is less prevalent in the area than average.
Other OEWS estimates and related information:
May 2023 National Occupational Employment and Wage Estimates
May 2023 State Occupational Employment and Wage Estimates
May 2023 Metropolitan and Nonmetropolitan Area Occupational Employment and Wage Estimates
May 2023 National Industry-Specific Occupational Employment and Wage Estimates
Last Modified Date: April 3, 2024