
An official website of the United States government
An official website of the United States government
The .gov means it's official.
Federal government websites often end in .gov or .mil. Before sharing sensitive information,
make sure you're on a federal government site.
The site is secure.
The
https:// ensures that you are connecting to the official website and that any
information you provide is encrypted and transmitted securely.
Conduct programs of compensation and benefits and job analysis for employer. May specialize in specific areas, such as position classification and pension programs.
Employment estimate and mean wage estimates for Compensation, Benefits, and Job Analysis Specialists:
| Employment (1) | Employment RSE (3) |
Mean hourly wage |
Mean annual wage (2) |
Wage RSE (3) |
|---|---|---|---|---|
| 99,850 | 1.3 % | $ 38.76 | $ 80,620 | 0.9 % |
Percentile wage estimates for Compensation, Benefits, and Job Analysis Specialists:
| Percentile | 10% | 25% | 50% (Median) |
75% | 90% |
|---|---|---|---|---|---|
| Hourly Wage | $ 22.14 | $ 27.35 | $ 35.83 | $ 47.10 | $ 61.22 |
| Annual Wage (2) | $ 46,050 | $ 56,890 | $ 74,530 | $ 97,960 | $ 127,340 |
Industries with the highest published employment and wages for Compensation, Benefits, and Job Analysis Specialists are provided. For a list of all industries with employment in Compensation, Benefits, and Job Analysis Specialists, see the Create Customized Tables function.
Industries with the highest levels of employment in Compensation, Benefits, and Job Analysis Specialists:
| Industry | Employment (1) | Percent of industry employment | Hourly mean wage | Annual mean wage (2) |
|---|---|---|---|---|
| Management of Companies and Enterprises | 13,790 | 0.50 | $ 40.33 | $ 83,880 |
| Agencies, Brokerages, and Other Insurance Related Activities | 13,170 | 0.99 | $ 38.06 | $ 79,160 |
| Local Government, excluding Schools and Hospitals (OEWS Designation) | 7,010 | 0.13 | $ 38.26 | $ 79,570 |
| Management, Scientific, and Technical Consulting Services | 6,960 | 0.38 | $ 41.36 | $ 86,020 |
| State Government, excluding Schools and Hospitals (OEWS Designation) | 5,830 | 0.27 | $ 30.26 | $ 62,940 |
Industries with the highest concentration of employment in Compensation, Benefits, and Job Analysis Specialists:
| Industry | Employment (1) | Percent of industry employment | Hourly mean wage | Annual mean wage (2) |
|---|---|---|---|---|
| Insurance and Employee Benefit Funds | 1,530 | 13.35 | $ 39.07 | $ 81,260 |
| Agencies, Brokerages, and Other Insurance Related Activities | 13,170 | 0.99 | $ 38.06 | $ 79,160 |
| Management of Companies and Enterprises | 13,790 | 0.50 | $ 40.33 | $ 83,880 |
| Management, Scientific, and Technical Consulting Services | 6,960 | 0.38 | $ 41.36 | $ 86,020 |
| Insurance Carriers | 4,330 | 0.35 | $ 37.32 | $ 77,630 |
Top paying industries for Compensation, Benefits, and Job Analysis Specialists:
| Industry | Employment (1) | Percent of industry employment | Hourly mean wage | Annual mean wage (2) |
|---|---|---|---|---|
| Web Search Portals, Libraries, Archives, and Other Information Services | 100 | 0.05 | $ 70.29 | $ 146,200 |
| Merchant Wholesalers, Nondurable Goods (4242 and 4246 only) | 220 | 0.06 | $ 66.34 | $ 137,980 |
| Computer and Peripheral Equipment Manufacturing | 200 | 0.12 | $ 61.63 | $ 128,190 |
| Software Publishers | 580 | 0.09 | $ 58.89 | $ 122,490 |
| Aerospace Product and Parts Manufacturing | 320 | 0.06 | $ 56.15 | $ 116,800 |
States and areas with the highest published employment, location quotients, and wages for Compensation, Benefits, and Job Analysis Specialists are provided. For a list of all areas with employment in Compensation, Benefits, and Job Analysis Specialists, see the Create Customized Tables function.
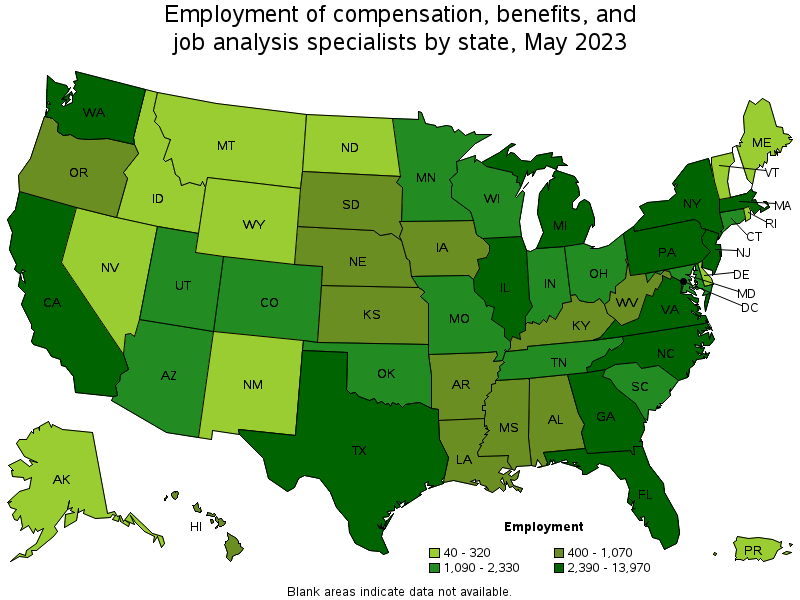
States with the highest employment level in Compensation, Benefits, and Job Analysis Specialists:
| State | Employment (1) | Employment per thousand jobs | Location quotient (9) | Hourly mean wage | Annual mean wage (2) |
|---|---|---|---|---|---|
| California | 13,970 | 0.78 | 1.18 | $ 44.98 | $ 93,550 |
| Texas | 8,940 | 0.66 | 1.00 | $ 39.90 | $ 82,980 |
| New York | 8,370 | 0.89 | 1.35 | $ 45.05 | $ 93,700 |
| Florida | 7,070 | 0.74 | 1.12 | $ 33.58 | $ 69,850 |
| Pennsylvania | 4,330 | 0.73 | 1.11 | $ 34.14 | $ 71,010 |
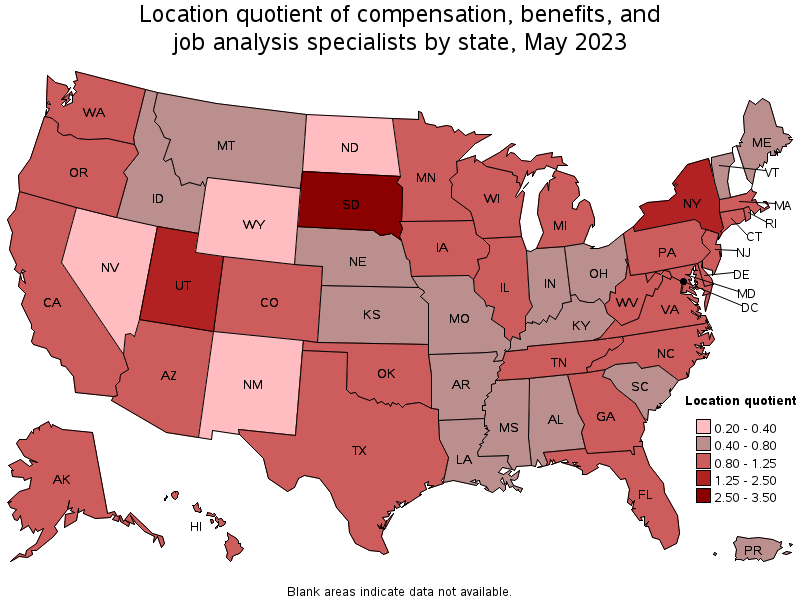
States with the highest concentration of jobs and location quotients in Compensation, Benefits, and Job Analysis Specialists:
| State | Employment (1) | Employment per thousand jobs | Location quotient (9) | Hourly mean wage | Annual mean wage (2) |
|---|---|---|---|---|---|
| South Dakota | 880 | 1.97 | 3.00 | $ 30.18 | $ 62,780 |
| Utah | 1,600 | 0.96 | 1.45 | $ 30.76 | $ 63,980 |
| New York | 8,370 | 0.89 | 1.35 | $ 45.05 | $ 93,700 |
| Oklahoma | 1,340 | 0.81 | 1.22 | $ 28.49 | $ 59,270 |
| Virginia | 3,180 | 0.80 | 1.21 | $ 39.84 | $ 82,860 |
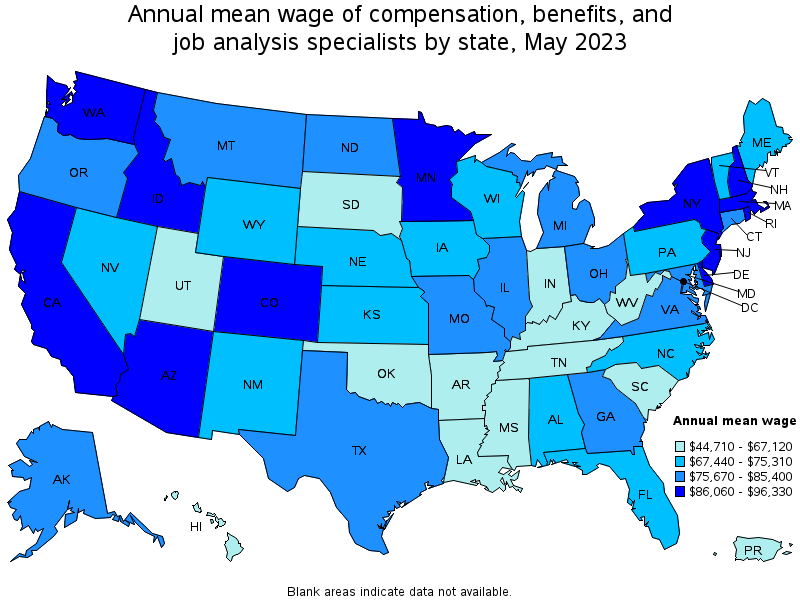
Top paying states for Compensation, Benefits, and Job Analysis Specialists:
| State | Employment (1) | Employment per thousand jobs | Location quotient (9) | Hourly mean wage | Annual mean wage (2) |
|---|---|---|---|---|---|
| District of Columbia | 460 | 0.65 | 1.00 | $ 46.31 | $ 96,330 |
| Delaware | 320 | 0.68 | 1.04 | $ 45.75 | $ 95,160 |
| New York | 8,370 | 0.89 | 1.35 | $ 45.05 | $ 93,700 |
| California | 13,970 | 0.78 | 1.18 | $ 44.98 | $ 93,550 |
| Rhode Island | 310 | 0.62 | 0.95 | $ 44.47 | $ 92,490 |
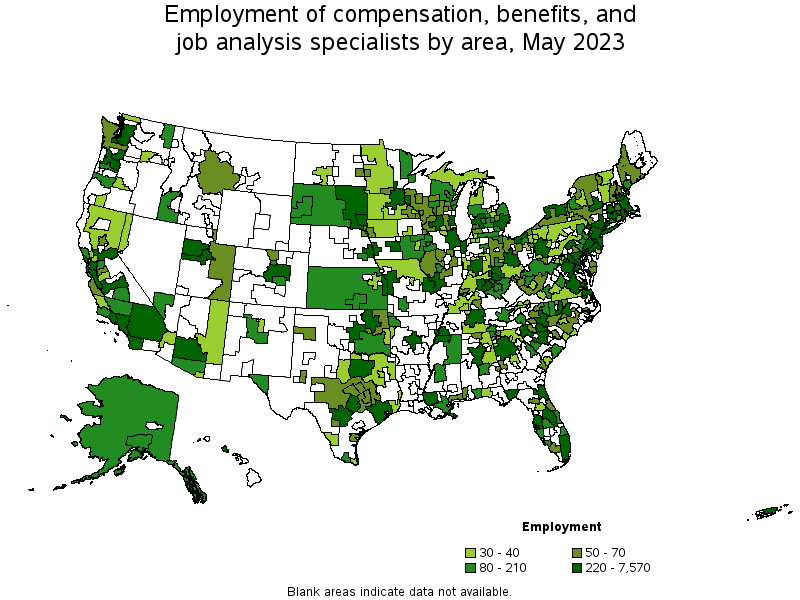
Metropolitan areas with the highest employment level in Compensation, Benefits, and Job Analysis Specialists:
| Metropolitan area | Employment (1) | Employment per thousand jobs | Location quotient (9) | Hourly mean wage | Annual mean wage (2) |
|---|---|---|---|---|---|
| New York-Newark-Jersey City, NY-NJ-PA | 7,570 | 0.80 | 1.21 | $ 48.13 | $ 100,110 |
| Los Angeles-Long Beach-Anaheim, CA | 3,900 | 0.63 | 0.96 | $ 44.67 | $ 92,900 |
| Chicago-Naperville-Elgin, IL-IN-WI | 2,960 | 0.66 | 1.00 | $ 37.85 | $ 78,730 |
| Dallas-Fort Worth-Arlington, TX | 2,800 | 0.71 | 1.07 | $ 37.40 | $ 77,790 |
| San Francisco-Oakland-Hayward, CA | 2,530 | 1.05 | 1.59 | $ 54.09 | $ 112,520 |
| Philadelphia-Camden-Wilmington, PA-NJ-DE-MD | 2,310 | 0.82 | 1.24 | $ 38.72 | $ 80,540 |
| Houston-The Woodlands-Sugar Land, TX | 2,300 | 0.72 | 1.10 | $ 49.62 | $ 103,210 |
| Atlanta-Sandy Springs-Roswell, GA | 2,270 | 0.80 | 1.22 | $ 38.62 | $ 80,330 |
| Washington-Arlington-Alexandria, DC-VA-MD-WV | 2,220 | 0.72 | 1.09 | $ 46.32 | $ 96,340 |
| Boston-Cambridge-Nashua, MA-NH | 2,130 | 0.77 | 1.17 | $ 43.85 | $ 91,210 |
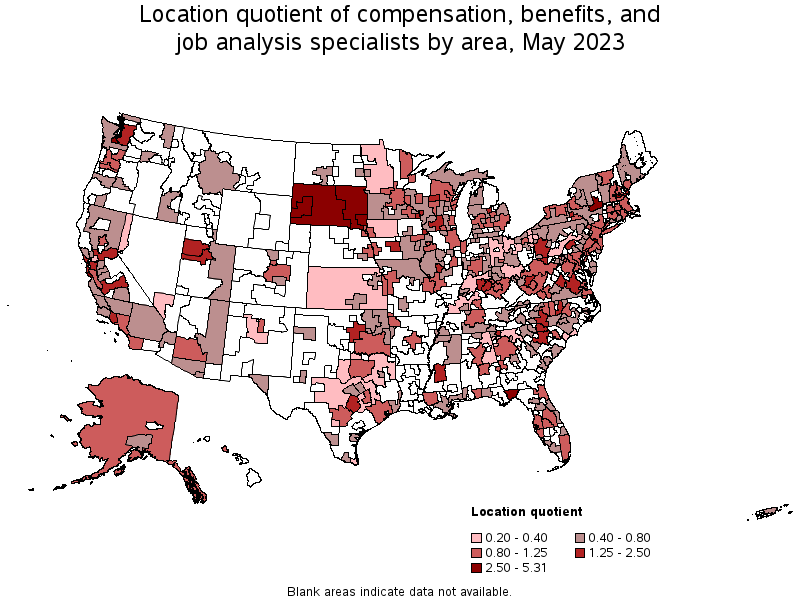
Metropolitan areas with the highest concentration of jobs and location quotients in Compensation, Benefits, and Job Analysis Specialists:
| Metropolitan area | Employment (1) | Employment per thousand jobs | Location quotient (9) | Hourly mean wage | Annual mean wage (2) |
|---|---|---|---|---|---|
| Olympia-Tumwater, WA | 430 | 3.49 | 5.31 | $ 30.50 | $ 63,440 |
| Tallahassee, FL | 420 | 2.33 | 3.54 | $ 20.32 | $ 42,260 |
| Sioux Falls, SD | 380 | 2.30 | 3.49 | $ 30.83 | $ 64,130 |
| Trenton, NJ | 510 | 2.13 | 3.24 | $ 37.29 | $ 77,570 |
| Manchester, NH | 220 | 2.03 | 3.08 | $ 45.00 | $ 93,590 |
| Albany-Schenectady-Troy, NY | 880 | 2.01 | 3.06 | $ 32.53 | $ 67,660 |
| Santa Cruz-Watsonville, CA | 180 | 1.85 | 2.82 | $ 39.00 | $ 81,120 |
| Rapid City, SD | 120 | 1.71 | 2.60 | $ 30.62 | $ 63,690 |
| Provo-Orem, UT | 430 | 1.47 | 2.23 | $ 27.18 | $ 56,530 |
| Sacramento--Roseville--Arden-Arcade, CA | 1,540 | 1.47 | 2.23 | $ 40.86 | $ 84,990 |
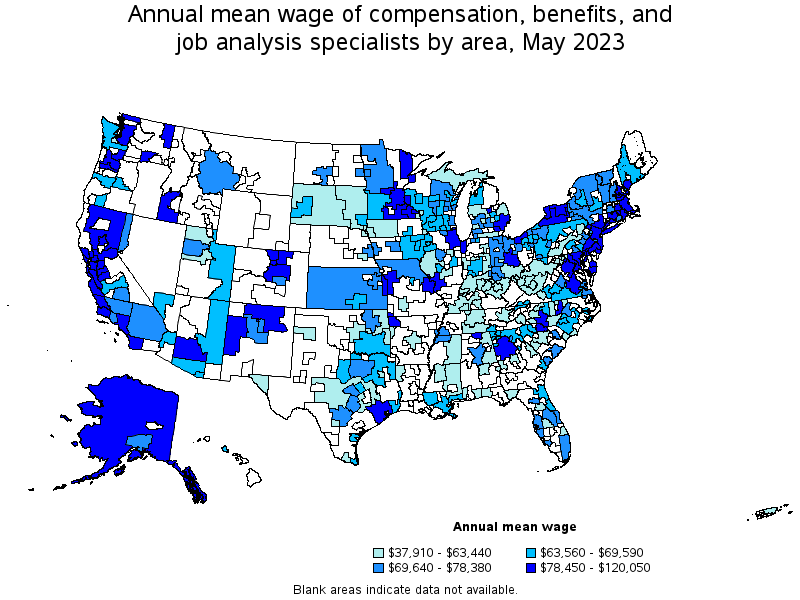
Top paying metropolitan areas for Compensation, Benefits, and Job Analysis Specialists:
| Metropolitan area | Employment (1) | Employment per thousand jobs | Location quotient (9) | Hourly mean wage | Annual mean wage (2) |
|---|---|---|---|---|---|
| San Jose-Sunnyvale-Santa Clara, CA | 860 | 0.75 | 1.14 | $ 57.71 | $ 120,050 |
| Boulder, CO | 110 | 0.57 | 0.86 | $ 57.64 | $ 119,880 |
| San Francisco-Oakland-Hayward, CA | 2,530 | 1.05 | 1.59 | $ 54.09 | $ 112,520 |
| Portsmouth, NH-ME | 110 | 1.16 | 1.76 | $ 52.99 | $ 110,230 |
| Houston-The Woodlands-Sugar Land, TX | 2,300 | 0.72 | 1.10 | $ 49.62 | $ 103,210 |
| New York-Newark-Jersey City, NY-NJ-PA | 7,570 | 0.80 | 1.21 | $ 48.13 | $ 100,110 |
| Seattle-Tacoma-Bellevue, WA | 1,810 | 0.87 | 1.32 | $ 47.88 | $ 99,600 |
| Washington-Arlington-Alexandria, DC-VA-MD-WV | 2,220 | 0.72 | 1.09 | $ 46.32 | $ 96,340 |
| Rochester, MN | 70 | 0.55 | 0.83 | $ 45.47 | $ 94,570 |
| Manchester, NH | 220 | 2.03 | 3.08 | $ 45.00 | $ 93,590 |
Nonmetropolitan areas with the highest employment in Compensation, Benefits, and Job Analysis Specialists:
| Nonmetropolitan area | Employment (1) | Employment per thousand jobs | Location quotient (9) | Hourly mean wage | Annual mean wage (2) |
|---|---|---|---|---|---|
| East South Dakota nonmetropolitan area | 230 | 1.75 | 2.66 | $ 29.75 | $ 61,890 |
| West South Dakota nonmetropolitan area | 110 | 1.81 | 2.75 | $ 28.51 | $ 59,300 |
| Northeastern Wisconsin nonmetropolitan area | 100 | 0.53 | 0.80 | $ 35.83 | $ 74,520 |
| Central Kentucky nonmetropolitan area | 100 | 0.53 | 0.81 | $ 24.31 | $ 50,560 |
| Southeast Oklahoma nonmetropolitan area | 100 | 0.56 | 0.86 | $ 33.34 | $ 69,340 |
Nonmetropolitan areas with the highest concentration of jobs and location quotients in Compensation, Benefits, and Job Analysis Specialists:
| Nonmetropolitan area | Employment (1) | Employment per thousand jobs | Location quotient (9) | Hourly mean wage | Annual mean wage (2) |
|---|---|---|---|---|---|
| West South Dakota nonmetropolitan area | 110 | 1.81 | 2.75 | $ 28.51 | $ 59,300 |
| East South Dakota nonmetropolitan area | 230 | 1.75 | 2.66 | $ 29.75 | $ 61,890 |
| Alaska nonmetropolitan area | 80 | 0.78 | 1.19 | $ 38.76 | $ 80,620 |
| Central New Hampshire nonmetropolitan area | 70 | 0.73 | 1.11 | $ 37.74 | $ 78,490 |
| Southern West Virginia nonmetropolitan area | 50 | 0.72 | 1.09 | $ 18.23 | $ 37,910 |
Top paying nonmetropolitan areas for Compensation, Benefits, and Job Analysis Specialists:
| Nonmetropolitan area | Employment (1) | Employment per thousand jobs | Location quotient (9) | Hourly mean wage | Annual mean wage (2) |
|---|---|---|---|---|---|
| North Valley-Northern Mountains Region of California nonmetropolitan area | 30 | 0.30 | 0.46 | $ 41.73 | $ 86,790 |
| Northern New Mexico nonmetropolitan area | (8) | (8) | (8) | $ 39.58 | $ 82,330 |
| Southwest New York nonmetropolitan area | 60 | 0.37 | 0.56 | $ 39.42 | $ 81,990 |
| Alaska nonmetropolitan area | 80 | 0.78 | 1.19 | $ 38.76 | $ 80,620 |
| Southeast Minnesota nonmetropolitan area | 40 | 0.28 | 0.42 | $ 38.45 | $ 79,980 |
These estimates are calculated with data collected from employers in all industry sectors, all metropolitan and nonmetropolitan areas, and all states and the District of Columbia. The top employment and wage figures are provided above. The complete list is available in the downloadable XLS files.
The percentile wage estimate is the value of a wage below which a certain percent of workers fall. The median wage is the 50th percentile wage estimate—50 percent of workers earn less than the median and 50 percent of workers earn more than the median. More about percentile wages.
(1) Estimates for detailed occupations do not sum to the totals because the totals include occupations not shown separately. Estimates do not include self-employed workers.
(2) Annual wages have been calculated by multiplying the hourly mean wage by a "year-round, full-time" hours figure of 2,080 hours; for those occupations where there is not an hourly wage published, the annual wage has been directly calculated from the reported survey data.
(3) The relative standard error (RSE) is a measure of the reliability of a survey statistic. The smaller the relative standard error, the more precise the estimate.
(8) Estimate not released.
(9) The location quotient is the ratio of the area concentration of occupational employment to the national average concentration. A location quotient greater than one indicates the occupation has a higher share of employment than average, and a location quotient less than one indicates the occupation is less prevalent in the area than average.
Other OEWS estimates and related information:
May 2023 National Occupational Employment and Wage Estimates
May 2023 State Occupational Employment and Wage Estimates
May 2023 Metropolitan and Nonmetropolitan Area Occupational Employment and Wage Estimates
May 2023 National Industry-Specific Occupational Employment and Wage Estimates
Last Modified Date: April 3, 2024