
An official website of the United States government
An official website of the United States government
The .gov means it's official.
Federal government websites often end in .gov or .mil. Before sharing sensitive information,
make sure you're on a federal government site.
The site is secure.
The
https:// ensures that you are connecting to the official website and that any
information you provide is encrypted and transmitted securely.
Analyze statistical data, such as mortality, accident, sickness, disability, and retirement rates and construct probability tables to forecast risk and liability for payment of future benefits. May ascertain insurance rates required and cash reserves necessary to ensure payment of future benefits.
Employment estimate and mean wage estimates for Actuaries:
| Employment (1) | Employment RSE (3) |
Mean hourly wage |
Mean annual wage (2) |
Wage RSE (3) |
|---|---|---|---|---|
| 25,470 | 2.6 % | $ 63.70 | $ 132,500 | 1.4 % |
Percentile wage estimates for Actuaries:
| Percentile | 10% | 25% | 50% (Median) |
75% | 90% |
|---|---|---|---|---|---|
| Hourly Wage | $ 36.24 | $ 42.51 | $ 57.69 | $ 79.00 | $ 100.63 |
| Annual Wage (2) | $ 75,380 | $ 88,420 | $ 120,000 | $ 164,320 | $ 209,310 |
Industries with the highest published employment and wages for Actuaries are provided. For a list of all industries with employment in Actuaries, see the Create Customized Tables function.
Industries with the highest levels of employment in Actuaries:
| Industry | Employment (1) | Percent of industry employment | Hourly mean wage | Annual mean wage (2) |
|---|---|---|---|---|
| Insurance Carriers | 13,560 | 1.11 | $ 63.10 | $ 131,260 |
| Agencies, Brokerages, and Other Insurance Related Activities | 4,820 | 0.36 | $ 64.53 | $ 134,230 |
| Management, Scientific, and Technical Consulting Services | 2,970 | 0.16 | $ 65.07 | $ 135,340 |
| Management of Companies and Enterprises | 1,090 | 0.04 | $ 57.92 | $ 120,470 |
| Accounting, Tax Preparation, Bookkeeping, and Payroll Services | 510 | 0.05 | $ 79.43 | $ 165,220 |
Industries with the highest concentration of employment in Actuaries:
| Industry | Employment (1) | Percent of industry employment | Hourly mean wage | Annual mean wage (2) |
|---|---|---|---|---|
| Insurance Carriers | 13,560 | 1.11 | $ 63.10 | $ 131,260 |
| Insurance and Employee Benefit Funds | 60 | 0.52 | $ 67.01 | $ 139,380 |
| Agencies, Brokerages, and Other Insurance Related Activities | 4,820 | 0.36 | $ 64.53 | $ 134,230 |
| Management, Scientific, and Technical Consulting Services | 2,970 | 0.16 | $ 65.07 | $ 135,340 |
| Securities, Commodity Contracts, and Other Financial Investments and Related Activities | 500 | 0.05 | $ 59.73 | $ 124,240 |
Top paying industries for Actuaries:
| Industry | Employment (1) | Percent of industry employment | Hourly mean wage | Annual mean wage (2) |
|---|---|---|---|---|
| Business, Professional, Labor, Political, and Similar Organizations | 80 | 0.02 | $ 93.01 | $ 193,470 |
| Accounting, Tax Preparation, Bookkeeping, and Payroll Services | 510 | 0.05 | $ 79.43 | $ 165,220 |
| Computer Systems Design and Related Services | 80 | (7) | $ 77.12 | $ 160,410 |
| Credit Intermediation and Related Activities (5221 and 5223 only) | 40 | (7) | $ 73.52 | $ 152,920 |
| Federal, State, and Local Government, excluding State and Local Government Schools and Hospitals and the U.S. Postal Service (OEWS Designation) | 290 | 0.01 | $ 72.21 | $ 150,200 |
States and areas with the highest published employment, location quotients, and wages for Actuaries are provided. For a list of all areas with employment in Actuaries, see the Create Customized Tables function.
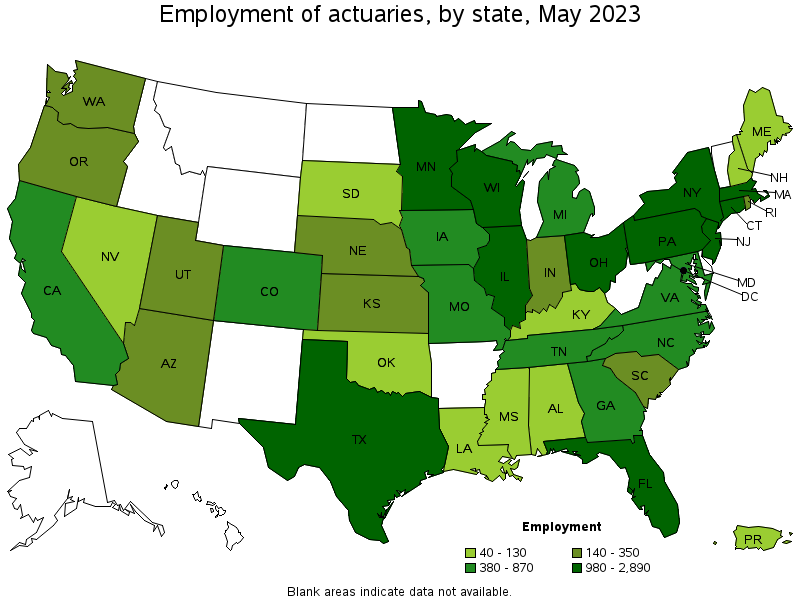
States with the highest employment level in Actuaries:
| State | Employment (1) | Employment per thousand jobs | Location quotient (9) | Hourly mean wage | Annual mean wage (2) |
|---|---|---|---|---|---|
| New York | 2,890 | 0.31 | 1.83 | $ 77.30 | $ 160,770 |
| Pennsylvania | 1,880 | 0.32 | 1.88 | $ 66.76 | $ 138,850 |
| Illinois | 1,860 | 0.31 | 1.85 | $ 65.79 | $ 136,850 |
| New Jersey | 1,610 | 0.38 | 2.29 | $ 68.41 | $ 142,300 |
| Ohio | 1,410 | 0.26 | 1.54 | $ 56.60 | $ 117,730 |
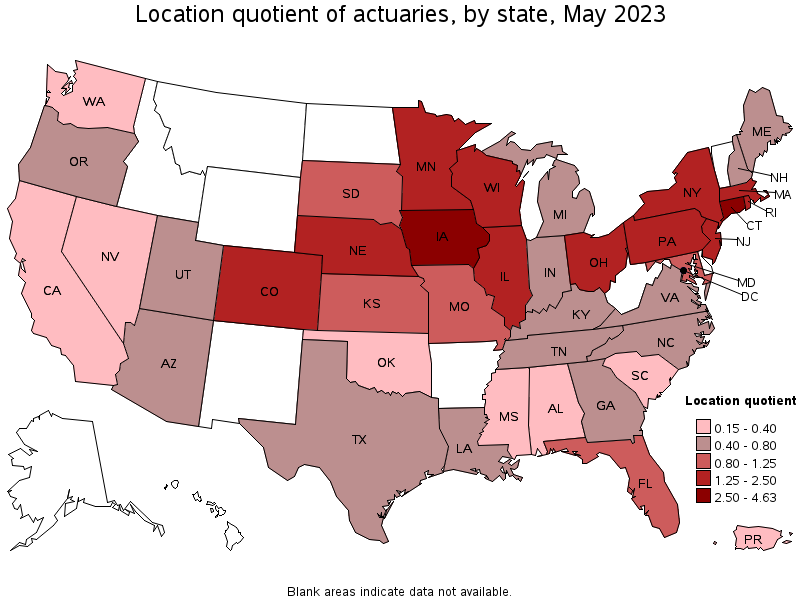
States with the highest concentration of jobs and location quotients in Actuaries:
| State | Employment (1) | Employment per thousand jobs | Location quotient (9) | Hourly mean wage | Annual mean wage (2) |
|---|---|---|---|---|---|
| Connecticut | 1,290 | 0.78 | 4.63 | $ 72.76 | $ 151,350 |
| Iowa | 730 | 0.47 | 2.80 | $ 59.02 | $ 122,760 |
| District of Columbia | 270 | 0.39 | 2.30 | $ 69.97 | $ 145,550 |
| New Jersey | 1,610 | 0.38 | 2.29 | $ 68.41 | $ 142,300 |
| Minnesota | 1,060 | 0.37 | 2.19 | $ 57.29 | $ 119,160 |
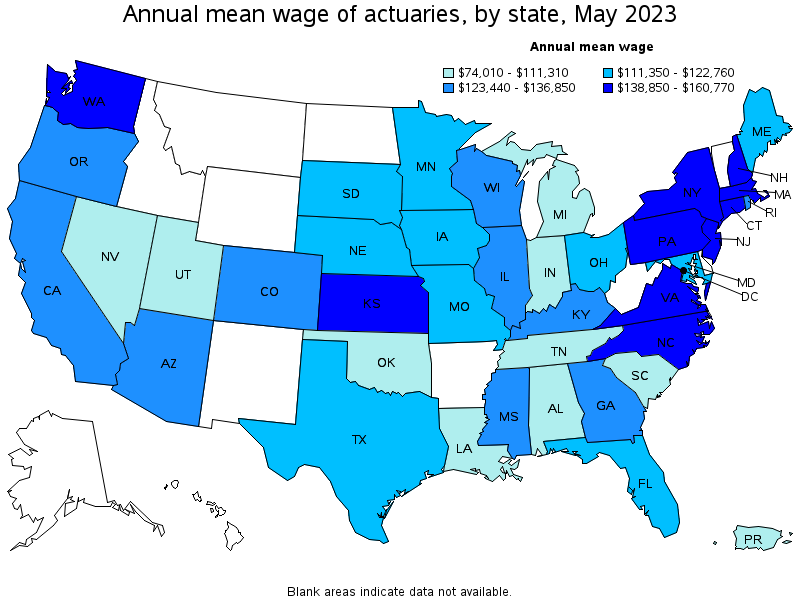
Top paying states for Actuaries:
| State | Employment (1) | Employment per thousand jobs | Location quotient (9) | Hourly mean wage | Annual mean wage (2) |
|---|---|---|---|---|---|
| New York | 2,890 | 0.31 | 1.83 | $ 77.30 | $ 160,770 |
| Connecticut | 1,290 | 0.78 | 4.63 | $ 72.76 | $ 151,350 |
| Kansas | 280 | 0.20 | 1.19 | $ 70.49 | $ 146,610 |
| District of Columbia | 270 | 0.39 | 2.30 | $ 69.97 | $ 145,550 |
| Virginia | 510 | 0.13 | 0.77 | $ 69.73 | $ 145,040 |
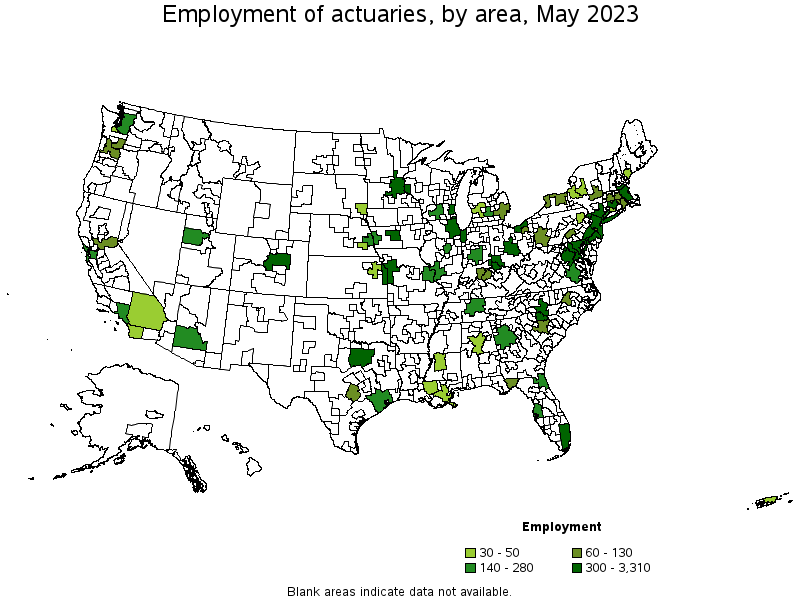
Metropolitan areas with the highest employment level in Actuaries:
| Metropolitan area | Employment (1) | Employment per thousand jobs | Location quotient (9) | Hourly mean wage | Annual mean wage (2) |
|---|---|---|---|---|---|
| New York-Newark-Jersey City, NY-NJ-PA | 3,310 | 0.35 | 2.08 | $ 77.23 | $ 160,640 |
| Chicago-Naperville-Elgin, IL-IN-WI | 1,370 | 0.30 | 1.81 | $ 67.57 | $ 140,540 |
| Minneapolis-St. Paul-Bloomington, MN-WI | 970 | 0.51 | 3.01 | $ 57.00 | $ 118,570 |
| Philadelphia-Camden-Wilmington, PA-NJ-DE-MD | 920 | 0.33 | 1.94 | $ 74.07 | $ 154,060 |
| Hartford-West Hartford-East Hartford, CT | 920 | 1.63 | 9.70 | $ 74.11 | $ 154,140 |
| Boston-Cambridge-Nashua, MA-NH | 800 | 0.29 | 1.73 | $ 68.55 | $ 142,580 |
| Denver-Aurora-Lakewood, CO | 650 | 0.41 | 2.42 | $ 63.33 | $ 131,720 |
| Washington-Arlington-Alexandria, DC-VA-MD-WV | 560 | 0.18 | 1.08 | $ 68.45 | $ 142,370 |
| Des Moines-West Des Moines, IA | 460 | 1.21 | 7.19 | $ 58.24 | $ 121,130 |
| Dallas-Fort Worth-Arlington, TX | 460 | 0.12 | 0.69 | $ 58.08 | $ 120,800 |
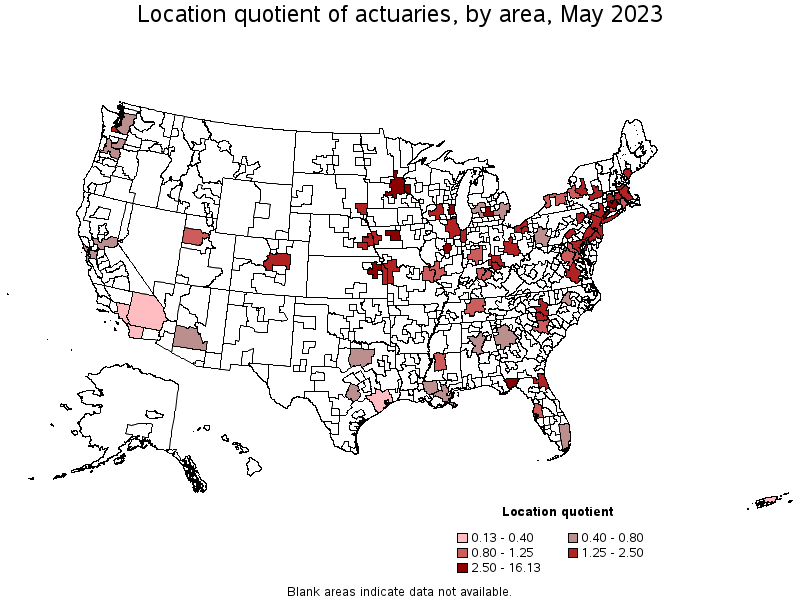
Metropolitan areas with the highest concentration of jobs and location quotients in Actuaries:
| Metropolitan area | Employment (1) | Employment per thousand jobs | Location quotient (9) | Hourly mean wage | Annual mean wage (2) |
|---|---|---|---|---|---|
| Bloomington, IL | 250 | 2.71 | 16.13 | $ 62.58 | $ 130,170 |
| Hartford-West Hartford-East Hartford, CT | 920 | 1.63 | 9.70 | $ 74.11 | $ 154,140 |
| Des Moines-West Des Moines, IA | 460 | 1.21 | 7.19 | $ 58.24 | $ 121,130 |
| Lansing-East Lansing, MI | 140 | 0.68 | 4.08 | $ 44.91 | $ 93,420 |
| Milwaukee-Waukesha-West Allis, WI | 450 | 0.55 | 3.27 | $ 71.10 | $ 147,900 |
| Minneapolis-St. Paul-Bloomington, MN-WI | 970 | 0.51 | 3.01 | $ 57.00 | $ 118,570 |
| Tallahassee, FL | 90 | 0.47 | 2.83 | $ 57.41 | $ 119,420 |
| Topeka, KS | 50 | 0.46 | 2.75 | $ 65.16 | $ 135,540 |
| Bridgeport-Stamford-Norwalk, CT | 180 | 0.44 | 2.64 | (8) | (8) |
| Trenton, NJ | 100 | 0.41 | 2.44 | $ 64.73 | $ 134,640 |
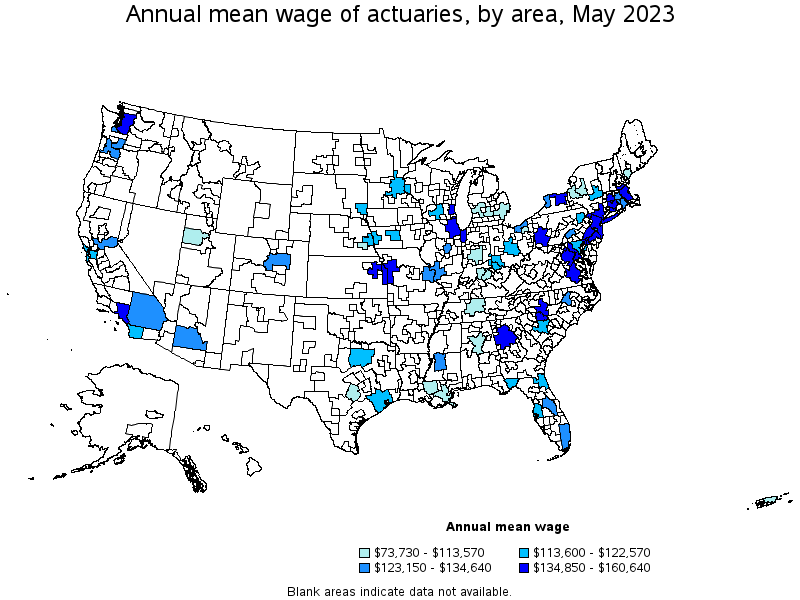
Top paying metropolitan areas for Actuaries:
| Metropolitan area | Employment (1) | Employment per thousand jobs | Location quotient (9) | Hourly mean wage | Annual mean wage (2) |
|---|---|---|---|---|---|
| New York-Newark-Jersey City, NY-NJ-PA | 3,310 | 0.35 | 2.08 | $ 77.23 | $ 160,640 |
| Hartford-West Hartford-East Hartford, CT | 920 | 1.63 | 9.70 | $ 74.11 | $ 154,140 |
| Philadelphia-Camden-Wilmington, PA-NJ-DE-MD | 920 | 0.33 | 1.94 | $ 74.07 | $ 154,060 |
| Charlotte-Concord-Gastonia, NC-SC | 310 | 0.23 | 1.39 | $ 72.82 | $ 151,460 |
| Milwaukee-Waukesha-West Allis, WI | 450 | 0.55 | 3.27 | $ 71.10 | $ 147,900 |
| Pittsburgh, PA | 110 | 0.11 | 0.64 | $ 70.57 | $ 146,780 |
| Seattle-Tacoma-Bellevue, WA | 150 | 0.07 | 0.44 | $ 69.66 | $ 144,890 |
| Atlanta-Sandy Springs-Roswell, GA | 280 | 0.10 | 0.60 | $ 69.21 | $ 143,970 |
| Springfield, MA-CT | 120 | 0.37 | 2.20 | $ 69.20 | $ 143,930 |
| Boston-Cambridge-Nashua, MA-NH | 800 | 0.29 | 1.73 | $ 68.55 | $ 142,580 |
These estimates are calculated with data collected from employers in all industry sectors, all metropolitan and nonmetropolitan areas, and all states and the District of Columbia. The top employment and wage figures are provided above. The complete list is available in the downloadable XLS files.
The percentile wage estimate is the value of a wage below which a certain percent of workers fall. The median wage is the 50th percentile wage estimate—50 percent of workers earn less than the median and 50 percent of workers earn more than the median. More about percentile wages.
(1) Estimates for detailed occupations do not sum to the totals because the totals include occupations not shown separately. Estimates do not include self-employed workers.
(2) Annual wages have been calculated by multiplying the hourly mean wage by a "year-round, full-time" hours figure of 2,080 hours; for those occupations where there is not an hourly wage published, the annual wage has been directly calculated from the reported survey data.
(3) The relative standard error (RSE) is a measure of the reliability of a survey statistic. The smaller the relative standard error, the more precise the estimate.
(7) The value is less than .005 percent of industry employment.
(8) Estimate not released.
(9) The location quotient is the ratio of the area concentration of occupational employment to the national average concentration. A location quotient greater than one indicates the occupation has a higher share of employment than average, and a location quotient less than one indicates the occupation is less prevalent in the area than average.
Other OEWS estimates and related information:
May 2023 National Occupational Employment and Wage Estimates
May 2023 State Occupational Employment and Wage Estimates
May 2023 Metropolitan and Nonmetropolitan Area Occupational Employment and Wage Estimates
May 2023 National Industry-Specific Occupational Employment and Wage Estimates
Last Modified Date: April 3, 2024