
An official website of the United States government
An official website of the United States government
The .gov means it's official.
Federal government websites often end in .gov or .mil. Before sharing sensitive information,
make sure you're on a federal government site.
The site is secure.
The
https:// ensures that you are connecting to the official website and that any
information you provide is encrypted and transmitted securely.
Prepare detailed drawings of architectural and structural features of buildings or drawings and topographical relief maps used in civil engineering projects, such as highways, bridges, and public works. Use knowledge of building materials, engineering practices, and mathematics to complete drawings.
Employment estimate and mean wage estimates for Architectural and Civil Drafters:
| Employment (1) | Employment RSE (3) |
Mean hourly wage |
Mean annual wage (2) |
Wage RSE (3) |
|---|---|---|---|---|
| 111,070 | 2.3 % | $ 31.25 | $ 65,000 | 0.6 % |
Percentile wage estimates for Architectural and Civil Drafters:
| Percentile | 10% | 25% | 50% (Median) |
75% | 90% |
|---|---|---|---|---|---|
| Hourly Wage | $ 19.09 | $ 23.88 | $ 29.72 | $ 37.03 | $ 45.47 |
| Annual Wage (2) | $ 39,720 | $ 49,660 | $ 61,820 | $ 77,020 | $ 94,580 |
Industries with the highest published employment and wages for Architectural and Civil Drafters are provided. For a list of all industries with employment in Architectural and Civil Drafters, see the Create Customized Tables function.
Industries with the highest levels of employment in Architectural and Civil Drafters:
| Industry | Employment (1) | Percent of industry employment | Hourly mean wage | Annual mean wage (2) |
|---|---|---|---|---|
| Architectural, Engineering, and Related Services | 80,680 | 4.90 | $ 31.08 | $ 64,640 |
| Residential Building Construction | 3,520 | 0.38 | $ 31.67 | $ 65,870 |
| Building Equipment Contractors | 2,730 | 0.11 | $ 32.70 | $ 68,020 |
| Nonresidential Building Construction | 2,710 | 0.32 | $ 33.73 | $ 70,150 |
| Fabricated Metal Product Manufacturing (3323 and 3324 only) | 1,880 | 0.38 | $ 29.61 | $ 61,590 |
Industries with the highest concentration of employment in Architectural and Civil Drafters:
| Industry | Employment (1) | Percent of industry employment | Hourly mean wage | Annual mean wage (2) |
|---|---|---|---|---|
| Architectural, Engineering, and Related Services | 80,680 | 4.90 | $ 31.08 | $ 64,640 |
| Veneer, Plywood, and Engineered Wood Product Manufacturing | 1,780 | 2.12 | $ 30.00 | $ 62,390 |
| Specialized Design Services | 1,130 | 0.73 | $ 31.73 | $ 66,010 |
| Furniture and Related Product Manufacturing (3371 and 3372 only) | 1,340 | 0.40 | $ 28.79 | $ 59,880 |
| Residential Building Construction | 3,520 | 0.38 | $ 31.67 | $ 65,870 |
Top paying industries for Architectural and Civil Drafters:
| Industry | Employment (1) | Percent of industry employment | Hourly mean wage | Annual mean wage (2) |
|---|---|---|---|---|
| Support Activities for Mining | (8) | (8) | $ 52.88 | $ 109,990 |
| Chemical Manufacturing (3251, 3252, 3253, and 3259 only) | 40 | 0.01 | $ 45.54 | $ 94,720 |
| Remediation and Other Waste Management Services | 40 | 0.02 | $ 43.78 | $ 91,050 |
| Steel Product Manufacturing from Purchased Steel | 70 | 0.11 | $ 42.68 | $ 88,770 |
| Aerospace Product and Parts Manufacturing | 60 | 0.01 | $ 39.69 | $ 82,550 |
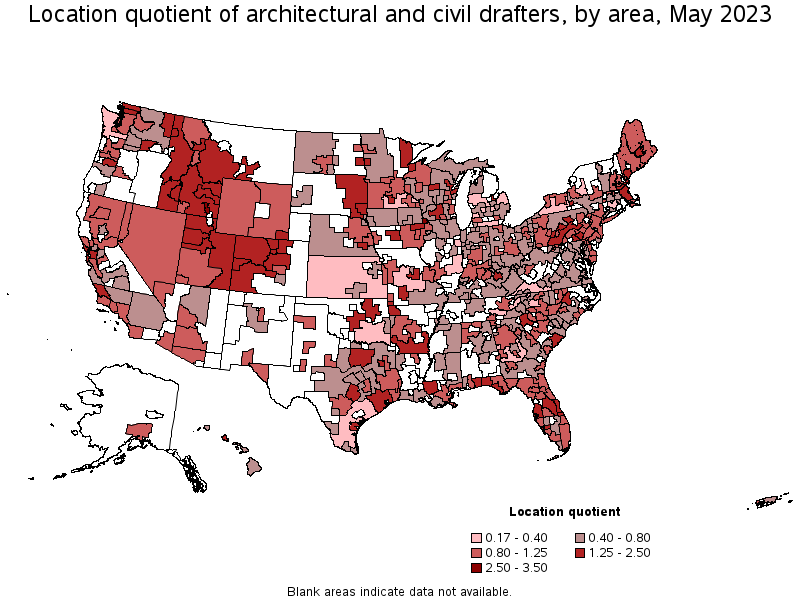
States and areas with the highest published employment, location quotients, and wages for Architectural and Civil Drafters are provided. For a list of all areas with employment in Architectural and Civil Drafters, see the Create Customized Tables function.
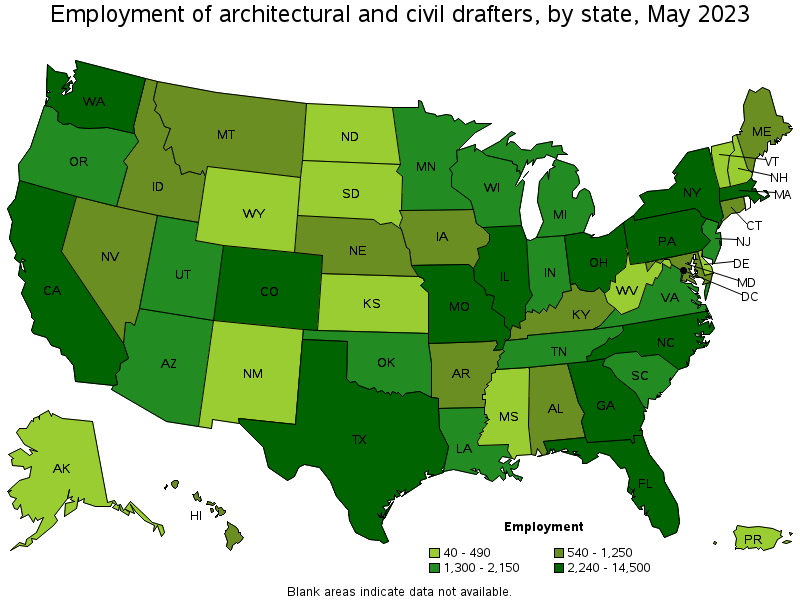
States with the highest employment level in Architectural and Civil Drafters:
| State | Employment (1) | Employment per thousand jobs | Location quotient (9) | Hourly mean wage | Annual mean wage (2) |
|---|---|---|---|---|---|
| Texas | 14,500 | 1.07 | 1.46 | $ 28.33 | $ 58,920 |
| California | 13,350 | 0.74 | 1.02 | $ 35.77 | $ 74,390 |
| Florida | 8,460 | 0.88 | 1.21 | $ 29.01 | $ 60,330 |
| New York | 7,250 | 0.77 | 1.05 | $ 33.90 | $ 70,510 |
| Pennsylvania | 5,160 | 0.87 | 1.19 | $ 31.20 | $ 64,900 |
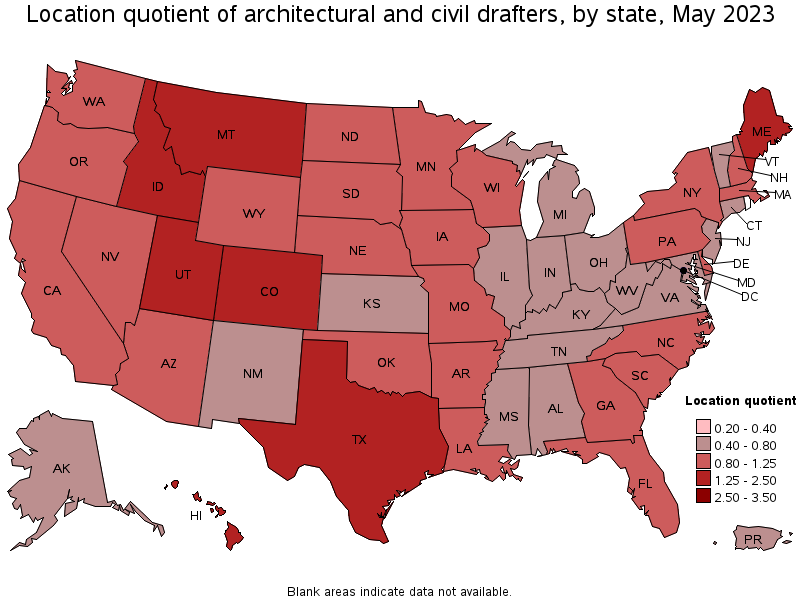
States with the highest concentration of jobs and location quotients in Architectural and Civil Drafters:
| State | Employment (1) | Employment per thousand jobs | Location quotient (9) | Hourly mean wage | Annual mean wage (2) |
|---|---|---|---|---|---|
| Idaho | 1,190 | 1.45 | 1.98 | $ 26.75 | $ 55,640 |
| Colorado | 3,240 | 1.14 | 1.56 | $ 35.15 | $ 73,110 |
| Hawaii | 670 | 1.09 | 1.49 | $ 30.53 | $ 63,500 |
| Montana | 540 | 1.07 | 1.47 | $ 29.00 | $ 60,320 |
| Utah | 1,800 | 1.07 | 1.47 | $ 27.98 | $ 58,190 |
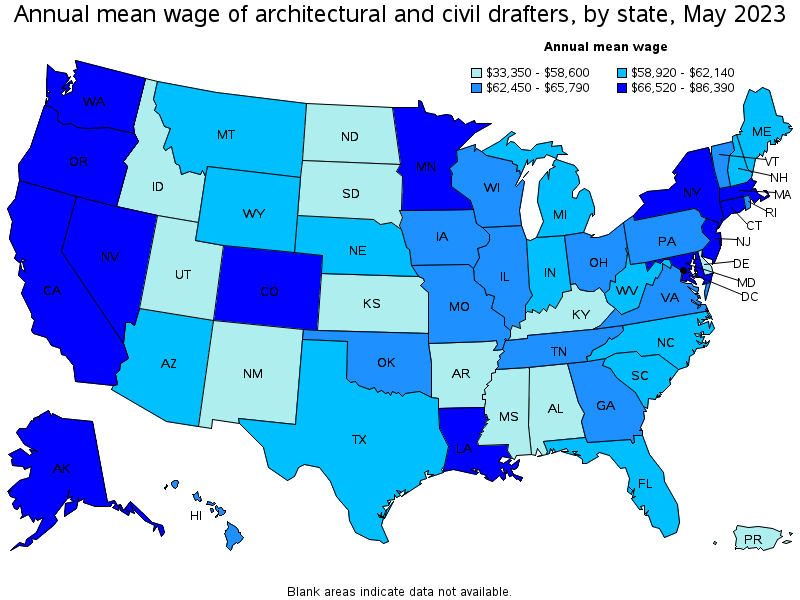
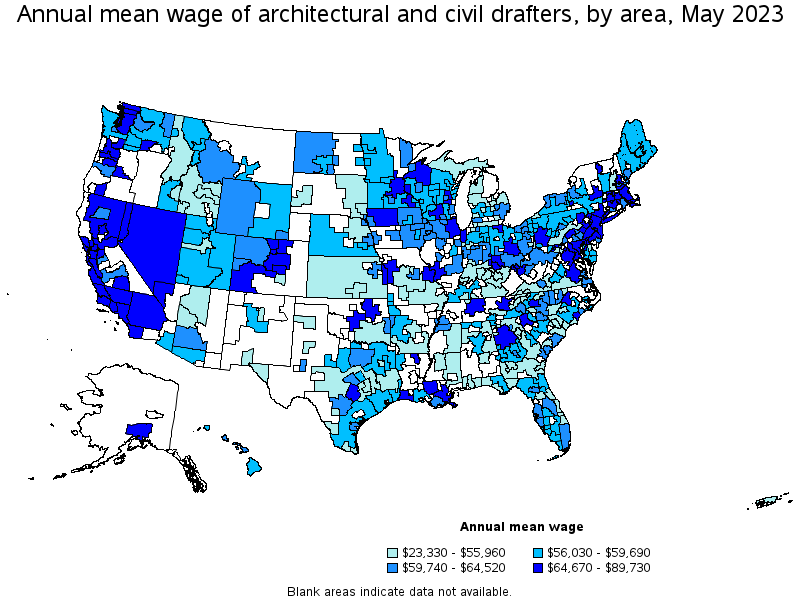
Top paying states for Architectural and Civil Drafters:
| State | Employment (1) | Employment per thousand jobs | Location quotient (9) | Hourly mean wage | Annual mean wage (2) |
|---|---|---|---|---|---|
| Alaska | 140 | 0.46 | 0.63 | $ 41.54 | $ 86,390 |
| District of Columbia | 680 | 0.97 | 1.33 | $ 41.10 | $ 85,490 |
| Louisiana | 1,310 | 0.71 | 0.97 | $ 37.59 | $ 78,190 |
| California | 13,350 | 0.74 | 1.02 | $ 35.77 | $ 74,390 |
| Nevada | 1,250 | 0.84 | 1.15 | $ 35.31 | $ 73,450 |
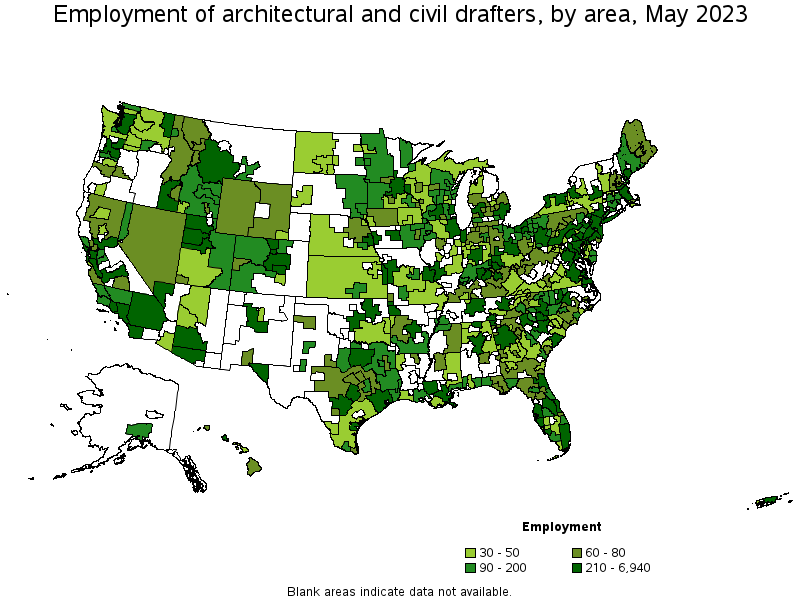
Metropolitan areas with the highest employment level in Architectural and Civil Drafters:
| Metropolitan area | Employment (1) | Employment per thousand jobs | Location quotient (9) | Hourly mean wage | Annual mean wage (2) |
|---|---|---|---|---|---|
| New York-Newark-Jersey City, NY-NJ-PA | 6,940 | 0.73 | 1.00 | $ 34.67 | $ 72,120 |
| Los Angeles-Long Beach-Anaheim, CA | 5,120 | 0.83 | 1.13 | $ 33.43 | $ 69,530 |
| Houston-The Woodlands-Sugar Land, TX | 4,800 | 1.51 | 2.06 | $ 28.11 | $ 58,460 |
| Dallas-Fort Worth-Arlington, TX | 4,460 | 1.12 | 1.54 | $ 28.73 | $ 59,750 |
| Boston-Cambridge-Nashua, MA-NH | 2,600 | 0.94 | 1.29 | $ 33.80 | $ 70,310 |
| San Francisco-Oakland-Hayward, CA | 2,410 | 0.99 | 1.36 | $ 40.16 | $ 83,530 |
| Miami-Fort Lauderdale-West Palm Beach, FL | 2,380 | 0.87 | 1.19 | $ 29.95 | $ 62,300 |
| Philadelphia-Camden-Wilmington, PA-NJ-DE-MD | 2,240 | 0.79 | 1.08 | $ 32.45 | $ 67,500 |
| Atlanta-Sandy Springs-Roswell, GA | 2,180 | 0.77 | 1.06 | $ 31.78 | $ 66,100 |
| Denver-Aurora-Lakewood, CO | 2,040 | 1.28 | 1.75 | $ 36.91 | $ 76,760 |
Metropolitan areas with the highest concentration of jobs and location quotients in Architectural and Civil Drafters:
| Metropolitan area | Employment (1) | Employment per thousand jobs | Location quotient (9) | Hourly mean wage | Annual mean wage (2) |
|---|---|---|---|---|---|
| Dubuque, IA | 120 | 2.03 | 2.77 | $ 28.88 | $ 60,070 |
| Pocatello, ID | 70 | 1.87 | 2.55 | (8) | (8) |
| Palm Bay-Melbourne-Titusville, FL | 390 | 1.64 | 2.25 | $ 25.88 | $ 53,830 |
| Boise City, ID | 610 | 1.64 | 2.24 | $ 28.33 | $ 58,930 |
| Charleston-North Charleston, SC | 590 | 1.58 | 2.15 | $ 29.90 | $ 62,200 |
| Coeur d'Alene, ID | 110 | 1.57 | 2.14 | $ 27.19 | $ 56,550 |
| Mankato-North Mankato, MN | 80 | 1.53 | 2.09 | $ 29.56 | $ 61,480 |
| Houston-The Woodlands-Sugar Land, TX | 4,800 | 1.51 | 2.06 | $ 28.11 | $ 58,460 |
| Johnstown, PA | 70 | 1.44 | 1.96 | $ 27.67 | $ 57,560 |
| Idaho Falls, ID | 110 | 1.41 | 1.92 | $ 24.95 | $ 51,900 |
Top paying metropolitan areas for Architectural and Civil Drafters:
| Metropolitan area | Employment (1) | Employment per thousand jobs | Location quotient (9) | Hourly mean wage | Annual mean wage (2) |
|---|---|---|---|---|---|
| Anchorage, AK | 110 | 0.65 | 0.88 | $ 43.14 | $ 89,730 |
| San Jose-Sunnyvale-Santa Clara, CA | 730 | 0.64 | 0.87 | $ 42.71 | $ 88,840 |
| Baton Rouge, LA | 460 | 1.20 | 1.64 | $ 42.53 | $ 88,460 |
| Napa, CA | 60 | 0.72 | 0.99 | $ 40.58 | $ 84,400 |
| Vallejo-Fairfield, CA | 80 | 0.55 | 0.76 | $ 40.32 | $ 83,870 |
| New Bedford, MA | 30 | 0.51 | 0.70 | $ 40.22 | $ 83,650 |
| San Francisco-Oakland-Hayward, CA | 2,410 | 0.99 | 1.36 | $ 40.16 | $ 83,530 |
| Oxnard-Thousand Oaks-Ventura, CA | 250 | 0.78 | 1.07 | $ 39.65 | $ 82,470 |
| Salem, OR | 160 | 0.88 | 1.21 | $ 39.61 | $ 82,390 |
| New Orleans-Metairie, LA | 430 | 0.84 | 1.15 | $ 39.17 | $ 81,480 |
Nonmetropolitan areas with the highest employment in Architectural and Civil Drafters:
| Nonmetropolitan area | Employment (1) | Employment per thousand jobs | Location quotient (9) | Hourly mean wage | Annual mean wage (2) |
|---|---|---|---|---|---|
| Southwest Montana nonmetropolitan area | 250 | 1.64 | 2.25 | $ 29.32 | $ 60,990 |
| Southern Pennsylvania nonmetropolitan area | 220 | 1.17 | 1.60 | $ 26.82 | $ 55,780 |
| Northwest Colorado nonmetropolitan area | 190 | 1.50 | 2.05 | $ 29.57 | $ 61,500 |
| Piedmont North Carolina nonmetropolitan area | 170 | 0.66 | 0.91 | $ 24.82 | $ 51,630 |
| Southeast Iowa nonmetropolitan area | 160 | 0.74 | 1.01 | $ 30.01 | $ 62,410 |
Nonmetropolitan areas with the highest concentration of jobs and location quotients in Architectural and Civil Drafters:
| Nonmetropolitan area | Employment (1) | Employment per thousand jobs | Location quotient (9) | Hourly mean wage | Annual mean wage (2) |
|---|---|---|---|---|---|
| Southwest Montana nonmetropolitan area | 250 | 1.64 | 2.25 | $ 29.32 | $ 60,990 |
| Northwest Colorado nonmetropolitan area | 190 | 1.50 | 2.05 | $ 29.57 | $ 61,500 |
| Southern Pennsylvania nonmetropolitan area | 220 | 1.17 | 1.60 | $ 26.82 | $ 55,780 |
| Northwestern Idaho nonmetropolitan area | 80 | 1.15 | 1.57 | $ 24.38 | $ 50,710 |
| Southwest Colorado nonmetropolitan area | 120 | 1.13 | 1.54 | $ 32.93 | $ 68,500 |
Top paying nonmetropolitan areas for Architectural and Civil Drafters:
| Nonmetropolitan area | Employment (1) | Employment per thousand jobs | Location quotient (9) | Hourly mean wage | Annual mean wage (2) |
|---|---|---|---|---|---|
| Massachusetts nonmetropolitan area | 40 | 0.59 | 0.81 | $ 33.33 | $ 69,320 |
| Northwest Iowa nonmetropolitan area | 70 | 0.54 | 0.73 | $ 33.06 | $ 68,760 |
| Southwest Colorado nonmetropolitan area | 120 | 1.13 | 1.54 | $ 32.93 | $ 68,500 |
| Nevada nonmetropolitan area | 80 | 0.77 | 1.06 | $ 32.37 | $ 67,320 |
| North Valley-Northern Mountains Region of California nonmetropolitan area | 70 | 0.71 | 0.97 | $ 31.87 | $ 66,280 |
These estimates are calculated with data collected from employers in all industry sectors, all metropolitan and nonmetropolitan areas, and all states and the District of Columbia. The top employment and wage figures are provided above. The complete list is available in the downloadable XLS files.
The percentile wage estimate is the value of a wage below which a certain percent of workers fall. The median wage is the 50th percentile wage estimate—50 percent of workers earn less than the median and 50 percent of workers earn more than the median. More about percentile wages.
(1) Estimates for detailed occupations do not sum to the totals because the totals include occupations not shown separately. Estimates do not include self-employed workers.
(2) Annual wages have been calculated by multiplying the hourly mean wage by a "year-round, full-time" hours figure of 2,080 hours; for those occupations where there is not an hourly wage published, the annual wage has been directly calculated from the reported survey data.
(3) The relative standard error (RSE) is a measure of the reliability of a survey statistic. The smaller the relative standard error, the more precise the estimate.
(8) Estimate not released.
(9) The location quotient is the ratio of the area concentration of occupational employment to the national average concentration. A location quotient greater than one indicates the occupation has a higher share of employment than average, and a location quotient less than one indicates the occupation is less prevalent in the area than average.
Other OEWS estimates and related information:
May 2023 National Occupational Employment and Wage Estimates
May 2023 State Occupational Employment and Wage Estimates
May 2023 Metropolitan and Nonmetropolitan Area Occupational Employment and Wage Estimates
May 2023 National Industry-Specific Occupational Employment and Wage Estimates
Last Modified Date: April 3, 2024