
An official website of the United States government
An official website of the United States government
The .gov means it's official.
Federal government websites often end in .gov or .mil. Before sharing sensitive information,
make sure you're on a federal government site.
The site is secure.
The
https:// ensures that you are connecting to the official website and that any
information you provide is encrypted and transmitted securely.
Assist biological and medical scientists. Set up, operate, and maintain laboratory instruments and equipment, monitor experiments, collect data and samples, make observations, and calculate and record results. May analyze organic substances, such as blood, food, and drugs.
Employment estimate and mean wage estimates for Biological Technicians:
| Employment (1) | Employment RSE (3) |
Mean hourly wage |
Mean annual wage (2) |
Wage RSE (3) |
|---|---|---|---|---|
| 76,990 | 1.2 % | $ 27.18 | $ 56,540 | 0.5 % |
Percentile wage estimates for Biological Technicians:
| Percentile | 10% | 25% | 50% (Median) |
75% | 90% |
|---|---|---|---|---|---|
| Hourly Wage | $ 17.78 | $ 20.38 | $ 24.73 | $ 31.50 | $ 38.62 |
| Annual Wage (2) | $ 36,970 | $ 42,390 | $ 51,430 | $ 65,510 | $ 80,330 |
Industries with the highest published employment and wages for Biological Technicians are provided. For a list of all industries with employment in Biological Technicians, see the Create Customized Tables function.
Industries with the highest levels of employment in Biological Technicians:
| Industry | Employment (1) | Percent of industry employment | Hourly mean wage | Annual mean wage (2) |
|---|---|---|---|---|
| Scientific Research and Development Services | 25,160 | 2.73 | $ 29.32 | $ 60,990 |
| Colleges, Universities, and Professional Schools | 15,470 | 0.50 | $ 25.00 | $ 52,000 |
| Federal, State, and Local Government, excluding State and Local Government Schools and Hospitals and the U.S. Postal Service (OEWS Designation) | 8,030 | 0.38 | $ 23.42 | $ 48,720 |
| Pharmaceutical and Medicine Manufacturing | 7,400 | 2.17 | $ 33.21 | $ 69,070 |
| General Medical and Surgical Hospitals | 4,940 | 0.09 | $ 28.37 | $ 59,000 |
Industries with the highest concentration of employment in Biological Technicians:
| Industry | Employment (1) | Percent of industry employment | Hourly mean wage | Annual mean wage (2) |
|---|---|---|---|---|
| Scientific Research and Development Services | 25,160 | 2.73 | $ 29.32 | $ 60,990 |
| Pharmaceutical and Medicine Manufacturing | 7,400 | 2.17 | $ 33.21 | $ 69,070 |
| Colleges, Universities, and Professional Schools | 15,470 | 0.50 | $ 25.00 | $ 52,000 |
| Federal, State, and Local Government, excluding State and Local Government Schools and Hospitals and the U.S. Postal Service (OEWS Designation) | 8,030 | 0.38 | $ 23.42 | $ 48,720 |
| Medical and Diagnostic Laboratories | 1,160 | 0.36 | $ 27.73 | $ 57,690 |
Top paying industries for Biological Technicians:
| Industry | Employment (1) | Percent of industry employment | Hourly mean wage | Annual mean wage (2) |
|---|---|---|---|---|
| Merchant Wholesalers, Nondurable Goods (4242 and 4246 only) | 50 | 0.01 | $ 45.79 | $ 95,240 |
| Computer Systems Design and Related Services | 490 | 0.02 | $ 38.82 | $ 80,740 |
| Pharmaceutical and Medicine Manufacturing | 7,400 | 2.17 | $ 33.21 | $ 69,070 |
| Management of Companies and Enterprises | 470 | 0.02 | $ 31.02 | $ 64,520 |
| Business, Professional, Labor, Political, and Similar Organizations | 100 | 0.02 | $ 29.48 | $ 61,310 |
States and areas with the highest published employment, location quotients, and wages for Biological Technicians are provided. For a list of all areas with employment in Biological Technicians, see the Create Customized Tables function.
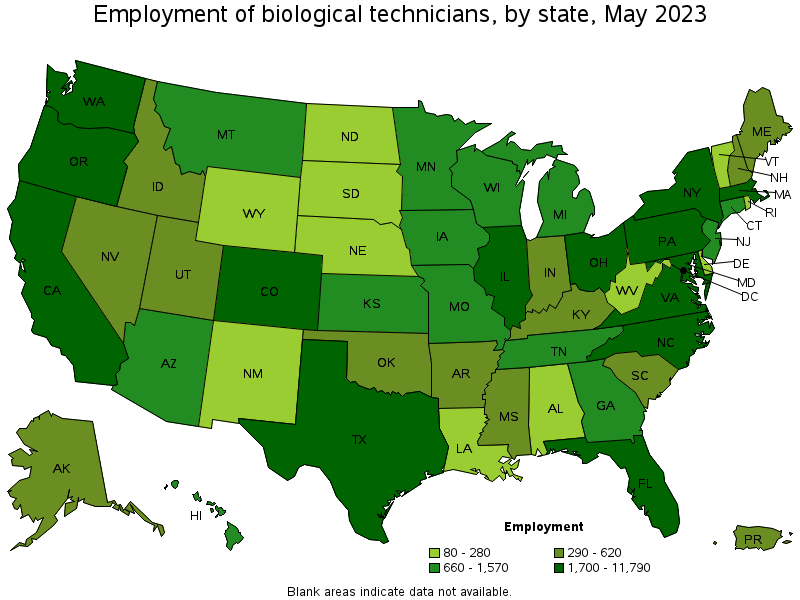
States with the highest employment level in Biological Technicians:
| State | Employment (1) | Employment per thousand jobs | Location quotient (9) | Hourly mean wage | Annual mean wage (2) |
|---|---|---|---|---|---|
| California | 11,790 | 0.66 | 1.30 | $ 32.34 | $ 67,270 |
| Massachusetts | 6,920 | 1.90 | 3.75 | $ 31.61 | $ 65,740 |
| New York | 4,080 | 0.43 | 0.86 | $ 27.40 | $ 57,000 |
| Texas | 3,690 | 0.27 | 0.54 | $ 24.00 | $ 49,920 |
| Maryland | 3,630 | 1.35 | 2.67 | $ 25.85 | $ 53,760 |
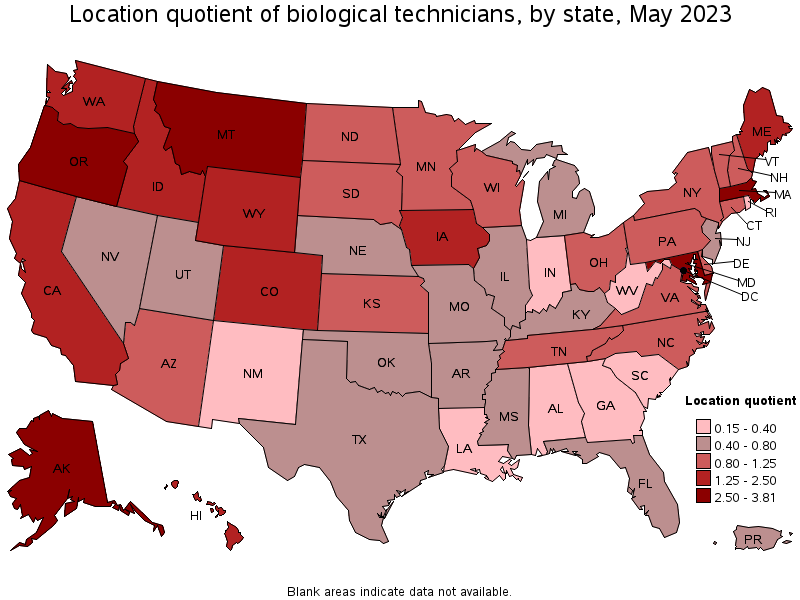
States with the highest concentration of jobs and location quotients in Biological Technicians:
| State | Employment (1) | Employment per thousand jobs | Location quotient (9) | Hourly mean wage | Annual mean wage (2) |
|---|---|---|---|---|---|
| Alaska | 600 | 1.93 | 3.81 | $ 26.14 | $ 54,370 |
| Massachusetts | 6,920 | 1.90 | 3.75 | $ 31.61 | $ 65,740 |
| Oregon | 2,800 | 1.44 | 2.85 | $ 24.74 | $ 51,460 |
| Maryland | 3,630 | 1.35 | 2.67 | $ 25.85 | $ 53,760 |
| Montana | 660 | 1.32 | 2.60 | $ 21.14 | $ 43,970 |
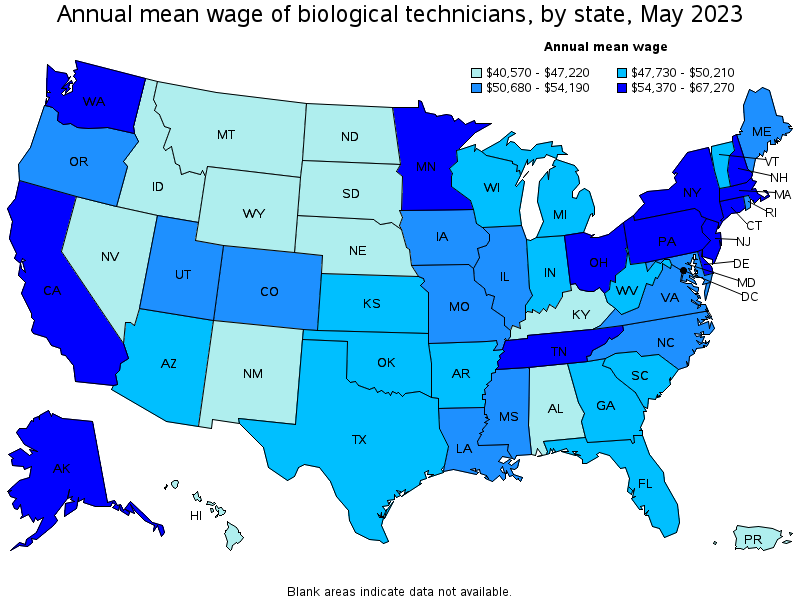
Top paying states for Biological Technicians:
| State | Employment (1) | Employment per thousand jobs | Location quotient (9) | Hourly mean wage | Annual mean wage (2) |
|---|---|---|---|---|---|
| California | 11,790 | 0.66 | 1.30 | $ 32.34 | $ 67,270 |
| Connecticut | 770 | 0.46 | 0.92 | $ 32.00 | $ 66,560 |
| Massachusetts | 6,920 | 1.90 | 3.75 | $ 31.61 | $ 65,740 |
| Tennessee | 1,390 | 0.43 | 0.85 | $ 29.49 | $ 61,340 |
| Ohio | 3,100 | 0.57 | 1.12 | $ 29.20 | $ 60,740 |
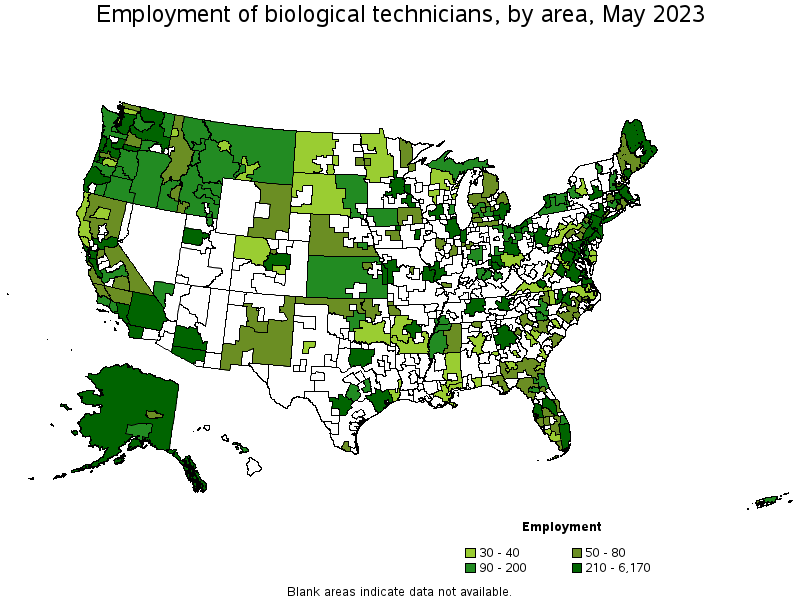
Metropolitan areas with the highest employment level in Biological Technicians:
| Metropolitan area | Employment (1) | Employment per thousand jobs | Location quotient (9) | Hourly mean wage | Annual mean wage (2) |
|---|---|---|---|---|---|
| Boston-Cambridge-Nashua, MA-NH | 6,170 | 2.24 | 4.41 | $ 31.71 | $ 65,950 |
| San Francisco-Oakland-Hayward, CA | 4,000 | 1.65 | 3.26 | $ 36.49 | $ 75,910 |
| New York-Newark-Jersey City, NY-NJ-PA | 3,150 | 0.33 | 0.65 | $ 27.87 | $ 57,960 |
| San Diego-Carlsbad, CA | 2,700 | 1.77 | 3.50 | $ 29.28 | $ 60,910 |
| Baltimore-Columbia-Towson, MD | 2,350 | 1.80 | 3.56 | $ 24.25 | $ 50,440 |
| Seattle-Tacoma-Bellevue, WA | 2,180 | 1.05 | 2.07 | $ 28.08 | $ 58,400 |
| Philadelphia-Camden-Wilmington, PA-NJ-DE-MD | 2,180 | 0.77 | 1.52 | $ 33.35 | $ 69,370 |
| Denver-Aurora-Lakewood, CO | 2,170 | 1.36 | 2.69 | $ 25.79 | $ 53,650 |
| Houston-The Woodlands-Sugar Land, TX | 1,880 | 0.59 | 1.17 | $ 25.33 | $ 52,690 |
| Washington-Arlington-Alexandria, DC-VA-MD-WV | 1,670 | 0.54 | 1.06 | $ 29.48 | $ 61,310 |
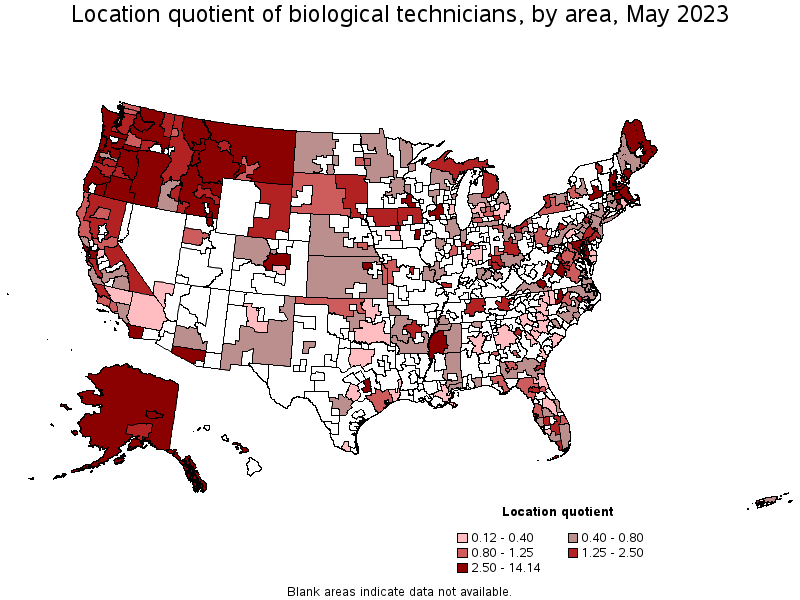
Metropolitan areas with the highest concentration of jobs and location quotients in Biological Technicians:
| Metropolitan area | Employment (1) | Employment per thousand jobs | Location quotient (9) | Hourly mean wage | Annual mean wage (2) |
|---|---|---|---|---|---|
| Corvallis, OR | 270 | 7.17 | 14.14 | $ 23.70 | $ 49,300 |
| Iowa City, IA | 600 | 6.64 | 13.11 | $ 25.65 | $ 53,350 |
| Durham-Chapel Hill, NC | 1,550 | 4.63 | 9.12 | $ 23.90 | $ 49,720 |
| Ames, IA | 210 | 4.46 | 8.80 | $ 26.03 | $ 54,140 |
| Blacksburg-Christiansburg-Radford, VA | 260 | 3.55 | 7.00 | $ 23.36 | $ 48,580 |
| Madison, WI | 1,110 | 2.80 | 5.53 | $ 24.68 | $ 51,320 |
| Fairbanks, AK | 80 | 2.39 | 4.72 | $ 24.63 | $ 51,220 |
| Charlottesville, VA | 260 | 2.33 | 4.60 | $ 27.03 | $ 56,230 |
| Boston-Cambridge-Nashua, MA-NH | 6,170 | 2.24 | 4.41 | $ 31.71 | $ 65,950 |
| Baltimore-Columbia-Towson, MD | 2,350 | 1.80 | 3.56 | $ 24.25 | $ 50,440 |
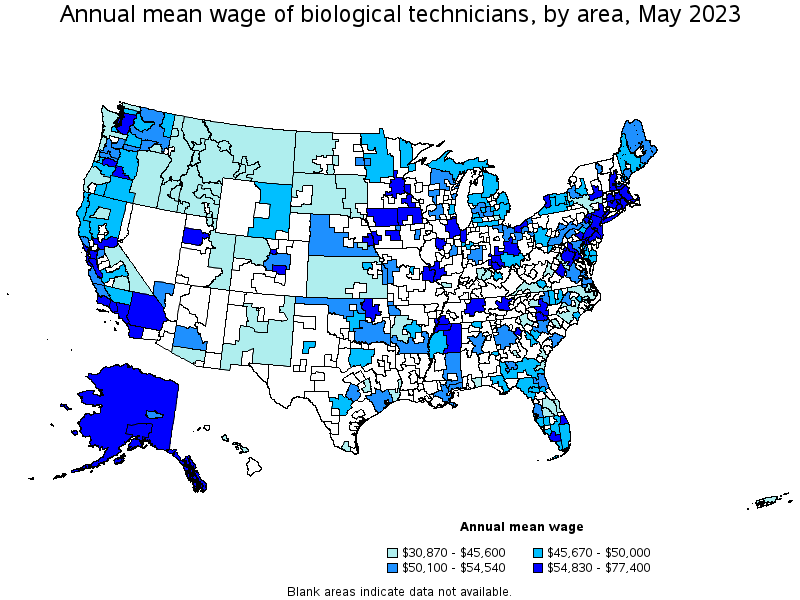
Top paying metropolitan areas for Biological Technicians:
| Metropolitan area | Employment (1) | Employment per thousand jobs | Location quotient (9) | Hourly mean wage | Annual mean wage (2) |
|---|---|---|---|---|---|
| Bridgeport-Stamford-Norwalk, CT | 70 | 0.16 | 0.32 | $ 37.21 | $ 77,400 |
| San Francisco-Oakland-Hayward, CA | 4,000 | 1.65 | 3.26 | $ 36.49 | $ 75,910 |
| San Jose-Sunnyvale-Santa Clara, CA | 800 | 0.70 | 1.38 | $ 35.84 | $ 74,540 |
| Cleveland-Elyria, OH | 740 | 0.74 | 1.46 | $ 33.82 | $ 70,340 |
| Philadelphia-Camden-Wilmington, PA-NJ-DE-MD | 2,180 | 0.77 | 1.52 | $ 33.35 | $ 69,370 |
| Rochester, MN | 210 | 1.73 | 3.41 | $ 33.31 | $ 69,290 |
| Los Angeles-Long Beach-Anaheim, CA | 1,660 | 0.27 | 0.53 | $ 32.54 | $ 67,670 |
| East Stroudsburg, PA | 70 | 1.22 | 2.40 | $ 32.12 | $ 66,800 |
| Norwich-New London-Westerly, CT-RI | 60 | 0.47 | 0.92 | $ 32.09 | $ 66,750 |
| Boston-Cambridge-Nashua, MA-NH | 6,170 | 2.24 | 4.41 | $ 31.71 | $ 65,950 |
Nonmetropolitan areas with the highest employment in Biological Technicians:
| Nonmetropolitan area | Employment (1) | Employment per thousand jobs | Location quotient (9) | Hourly mean wage | Annual mean wage (2) |
|---|---|---|---|---|---|
| Eastern Washington nonmetropolitan area | 310 | 2.97 | 5.85 | $ 24.60 | $ 51,170 |
| Alaska nonmetropolitan area | 290 | 2.79 | 5.50 | $ 26.70 | $ 55,540 |
| Coast Oregon nonmetropolitan area | 260 | 2.25 | 4.44 | $ 21.22 | $ 44,140 |
| Northeast Maine nonmetropolitan area | 250 | 3.59 | 7.08 | $ 25.05 | $ 52,110 |
| Southwest Montana nonmetropolitan area | 200 | 1.30 | 2.57 | $ 21.39 | $ 44,500 |
Nonmetropolitan areas with the highest concentration of jobs and location quotients in Biological Technicians:
| Nonmetropolitan area | Employment (1) | Employment per thousand jobs | Location quotient (9) | Hourly mean wage | Annual mean wage (2) |
|---|---|---|---|---|---|
| Northeast Maine nonmetropolitan area | 250 | 3.59 | 7.08 | $ 25.05 | $ 52,110 |
| Eastern Washington nonmetropolitan area | 310 | 2.97 | 5.85 | $ 24.60 | $ 51,170 |
| Alaska nonmetropolitan area | 290 | 2.79 | 5.50 | $ 26.70 | $ 55,540 |
| Coast Oregon nonmetropolitan area | 260 | 2.25 | 4.44 | $ 21.22 | $ 44,140 |
| Eastern Oregon nonmetropolitan area | 160 | 2.17 | 4.29 | $ 21.32 | $ 44,340 |
Top paying nonmetropolitan areas for Biological Technicians:
| Nonmetropolitan area | Employment (1) | Employment per thousand jobs | Location quotient (9) | Hourly mean wage | Annual mean wage (2) |
|---|---|---|---|---|---|
| West Central-Southwest New Hampshire nonmetropolitan area | 180 | 1.76 | 3.47 | $ 29.07 | $ 60,460 |
| Northwest Iowa nonmetropolitan area | 90 | 0.70 | 1.37 | $ 27.54 | $ 57,290 |
| Northeast Mississippi nonmetropolitan area | 50 | 0.23 | 0.45 | $ 27.50 | $ 57,190 |
| Northeast Iowa nonmetropolitan area | 70 | 0.67 | 1.33 | $ 27.06 | $ 56,280 |
| Alaska nonmetropolitan area | 290 | 2.79 | 5.50 | $ 26.70 | $ 55,540 |
These estimates are calculated with data collected from employers in all industry sectors, all metropolitan and nonmetropolitan areas, and all states and the District of Columbia. The top employment and wage figures are provided above. The complete list is available in the downloadable XLS files.
The percentile wage estimate is the value of a wage below which a certain percent of workers fall. The median wage is the 50th percentile wage estimate—50 percent of workers earn less than the median and 50 percent of workers earn more than the median. More about percentile wages.
(1) Estimates for detailed occupations do not sum to the totals because the totals include occupations not shown separately. Estimates do not include self-employed workers.
(2) Annual wages have been calculated by multiplying the hourly mean wage by a "year-round, full-time" hours figure of 2,080 hours; for those occupations where there is not an hourly wage published, the annual wage has been directly calculated from the reported survey data.
(3) The relative standard error (RSE) is a measure of the reliability of a survey statistic. The smaller the relative standard error, the more precise the estimate.
(9) The location quotient is the ratio of the area concentration of occupational employment to the national average concentration. A location quotient greater than one indicates the occupation has a higher share of employment than average, and a location quotient less than one indicates the occupation is less prevalent in the area than average.
Other OEWS estimates and related information:
May 2023 National Occupational Employment and Wage Estimates
May 2023 State Occupational Employment and Wage Estimates
May 2023 Metropolitan and Nonmetropolitan Area Occupational Employment and Wage Estimates
May 2023 National Industry-Specific Occupational Employment and Wage Estimates
Last Modified Date: April 3, 2024