
An official website of the United States government
An official website of the United States government
The .gov means it's official.
Federal government websites often end in .gov or .mil. Before sharing sensitive information,
make sure you're on a federal government site.
The site is secure.
The
https:// ensures that you are connecting to the official website and that any
information you provide is encrypted and transmitted securely.
Promote health within a community by assisting individuals to adopt healthy behaviors. Serve as an advocate for the health needs of individuals by assisting community residents in effectively communicating with healthcare providers or social service agencies. Act as liaison or advocate and implement programs that promote, maintain, and improve individual and overall community health. May deliver health-related preventive services such as blood pressure, glaucoma, and hearing screenings. May collect data to help identify community health needs. Excludes �Health Education Specialists� (21-1091).
Employment estimate and mean wage estimates for Community Health Workers:
| Employment (1) | Employment RSE (3) |
Mean hourly wage |
Mean annual wage (2) |
Wage RSE (3) |
|---|---|---|---|---|
| 58,550 | 1.8 % | $ 25.30 | $ 52,610 | 0.6 % |
Percentile wage estimates for Community Health Workers:
| Percentile | 10% | 25% | 50% (Median) |
75% | 90% |
|---|---|---|---|---|---|
| Hourly Wage | $ 17.10 | $ 19.47 | $ 23.17 | $ 29.20 | $ 36.53 |
| Annual Wage (2) | $ 35,560 | $ 40,490 | $ 48,200 | $ 60,740 | $ 75,980 |
Industries with the highest published employment and wages for Community Health Workers are provided. For a list of all industries with employment in Community Health Workers, see the Create Customized Tables function.
Industries with the highest levels of employment in Community Health Workers:
| Industry | Employment (1) | Percent of industry employment | Hourly mean wage | Annual mean wage (2) |
|---|---|---|---|---|
| Local Government, excluding Schools and Hospitals (OEWS Designation) | 10,320 | 0.19 | $ 26.23 | $ 54,550 |
| Individual and Family Services | 10,140 | 0.34 | $ 22.69 | $ 47,200 |
| General Medical and Surgical Hospitals | 5,660 | 0.10 | $ 28.43 | $ 59,130 |
| Outpatient Care Centers | 5,230 | 0.49 | $ 23.10 | $ 48,040 |
| Offices of Physicians | 4,510 | 0.16 | $ 23.11 | $ 48,080 |
Industries with the highest concentration of employment in Community Health Workers:
| Industry | Employment (1) | Percent of industry employment | Hourly mean wage | Annual mean wage (2) |
|---|---|---|---|---|
| Grantmaking and Giving Services | 1,350 | 0.85 | $ 31.27 | $ 65,040 |
| Social Advocacy Organizations | 1,930 | 0.76 | $ 24.28 | $ 50,500 |
| Community Food and Housing, and Emergency and Other Relief Services | 1,570 | 0.73 | $ 22.70 | $ 47,220 |
| Outpatient Care Centers | 5,230 | 0.49 | $ 23.10 | $ 48,040 |
| Individual and Family Services | 10,140 | 0.34 | $ 22.69 | $ 47,200 |
Top paying industries for Community Health Workers:
| Industry | Employment (1) | Percent of industry employment | Hourly mean wage | Annual mean wage (2) |
|---|---|---|---|---|
| Scientific Research and Development Services | 400 | 0.04 | $ 36.61 | $ 76,140 |
| Home Health Care Services | 810 | 0.05 | $ 31.78 | $ 66,100 |
| Grantmaking and Giving Services | 1,350 | 0.85 | $ 31.27 | $ 65,040 |
| Insurance Carriers | 2,140 | 0.17 | $ 31.15 | $ 64,790 |
| Specialty (except Psychiatric and Substance Abuse) Hospitals | 170 | 0.06 | $ 30.65 | $ 63,760 |
States and areas with the highest published employment, location quotients, and wages for Community Health Workers are provided. For a list of all areas with employment in Community Health Workers, see the Create Customized Tables function.
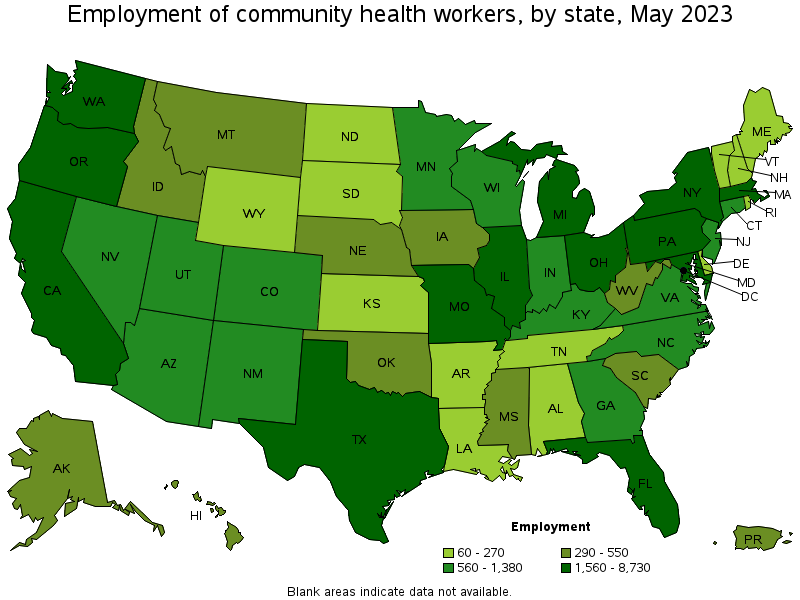
States with the highest employment level in Community Health Workers:
| State | Employment (1) | Employment per thousand jobs | Location quotient (9) | Hourly mean wage | Annual mean wage (2) |
|---|---|---|---|---|---|
| California | 8,730 | 0.49 | 1.26 | $ 27.82 | $ 57,860 |
| New York | 6,380 | 0.68 | 1.76 | $ 27.89 | $ 58,020 |
| Texas | 4,760 | 0.35 | 0.91 | $ 21.63 | $ 44,990 |
| Maryland | 2,440 | 0.91 | 2.36 | $ 25.51 | $ 53,060 |
| Massachusetts | 2,170 | 0.60 | 1.55 | $ 26.49 | $ 55,090 |
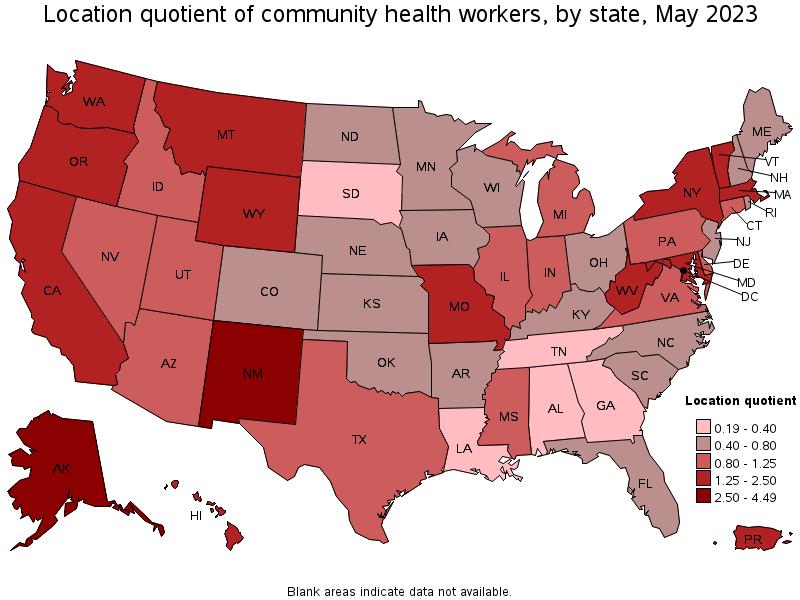
States with the highest concentration of jobs and location quotients in Community Health Workers:
| State | Employment (1) | Employment per thousand jobs | Location quotient (9) | Hourly mean wage | Annual mean wage (2) |
|---|---|---|---|---|---|
| Alaska | 540 | 1.73 | 4.49 | $ 28.48 | $ 59,230 |
| New Mexico | 1,070 | 1.26 | 3.28 | $ 30.72 | $ 63,900 |
| Maryland | 2,440 | 0.91 | 2.36 | $ 25.51 | $ 53,060 |
| Oregon | 1,560 | 0.80 | 2.08 | $ 28.08 | $ 58,410 |
| Hawaii | 470 | 0.76 | 1.98 | $ 21.72 | $ 45,190 |
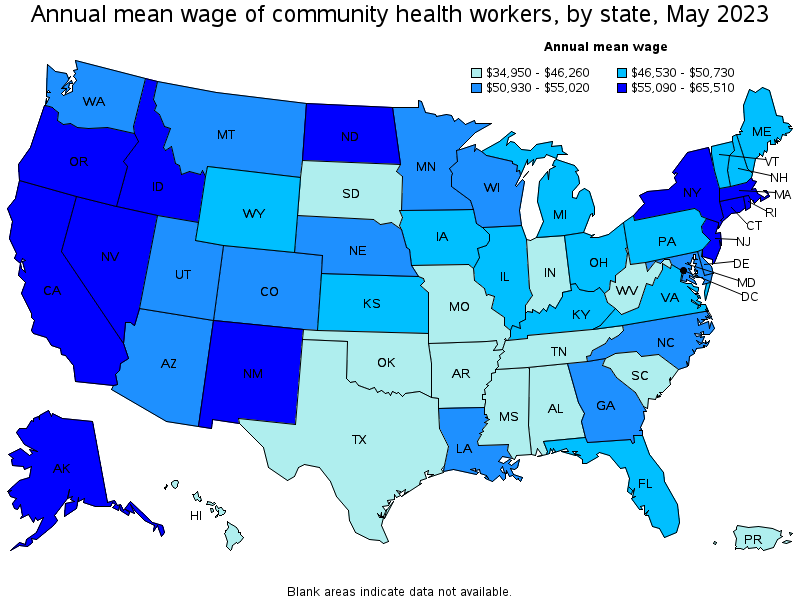
Top paying states for Community Health Workers:
| State | Employment (1) | Employment per thousand jobs | Location quotient (9) | Hourly mean wage | Annual mean wage (2) |
|---|---|---|---|---|---|
| District of Columbia | 400 | 0.57 | 1.48 | $ 31.49 | $ 65,510 |
| New Mexico | 1,070 | 1.26 | 3.28 | $ 30.72 | $ 63,900 |
| Rhode Island | 130 | 0.26 | 0.67 | $ 30.61 | $ 63,660 |
| Nevada | 670 | 0.46 | 1.18 | $ 30.44 | $ 63,320 |
| Connecticut | 560 | 0.34 | 0.87 | $ 29.32 | $ 60,990 |
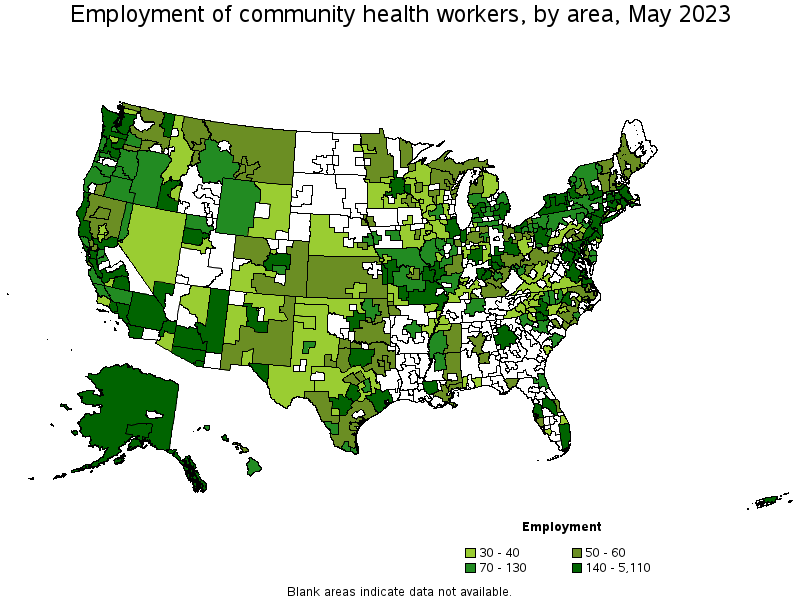
Metropolitan areas with the highest employment level in Community Health Workers:
| Metropolitan area | Employment (1) | Employment per thousand jobs | Location quotient (9) | Hourly mean wage | Annual mean wage (2) |
|---|---|---|---|---|---|
| New York-Newark-Jersey City, NY-NJ-PA | 5,110 | 0.54 | 1.40 | $ 28.76 | $ 59,810 |
| Los Angeles-Long Beach-Anaheim, CA | 2,980 | 0.48 | 1.25 | $ 25.83 | $ 53,720 |
| San Francisco-Oakland-Hayward, CA | 1,710 | 0.70 | 1.83 | $ 33.19 | $ 69,030 |
| Boston-Cambridge-Nashua, MA-NH | 1,580 | 0.57 | 1.49 | $ 27.21 | $ 56,610 |
| Washington-Arlington-Alexandria, DC-VA-MD-WV | 1,460 | 0.47 | 1.22 | $ 27.65 | $ 57,520 |
| Baltimore-Columbia-Towson, MD | 1,250 | 0.96 | 2.48 | $ 24.30 | $ 50,540 |
| Chicago-Naperville-Elgin, IL-IN-WI | 1,200 | 0.27 | 0.69 | $ 23.24 | $ 48,340 |
| Dallas-Fort Worth-Arlington, TX | 1,090 | 0.28 | 0.71 | $ 23.70 | $ 49,300 |
| Seattle-Tacoma-Bellevue, WA | 1,070 | 0.52 | 1.34 | $ 27.97 | $ 58,180 |
| Portland-Vancouver-Hillsboro, OR-WA | 1,020 | 0.84 | 2.19 | $ 28.49 | $ 59,260 |
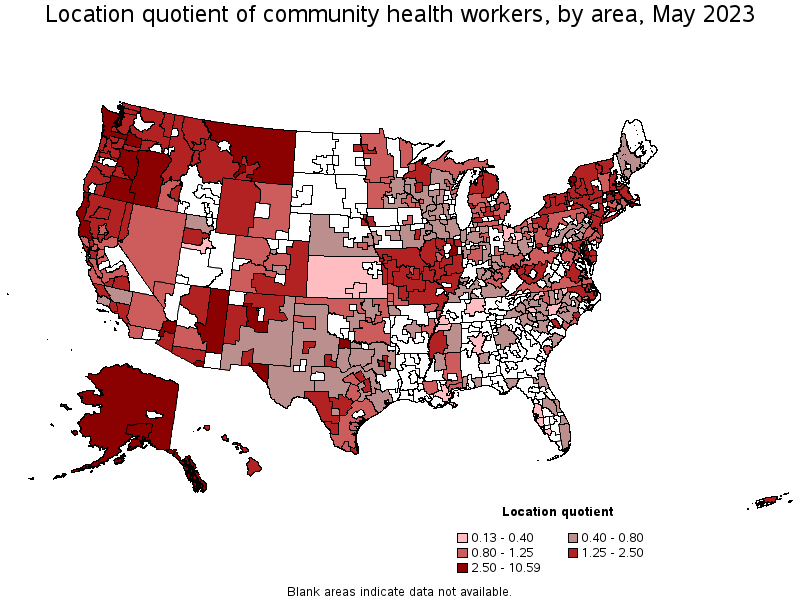
Metropolitan areas with the highest concentration of jobs and location quotients in Community Health Workers:
| Metropolitan area | Employment (1) | Employment per thousand jobs | Location quotient (9) | Hourly mean wage | Annual mean wage (2) |
|---|---|---|---|---|---|
| Carson City, NV | 130 | 4.08 | 10.59 | $ 33.93 | $ 70,570 |
| Albuquerque, NM | 790 | 1.99 | 5.17 | $ 32.26 | $ 67,110 |
| Watertown-Fort Drum, NY | 70 | 1.82 | 4.72 | $ 22.25 | $ 46,280 |
| Anchorage, AK | 250 | 1.45 | 3.76 | $ 30.60 | $ 63,640 |
| Champaign-Urbana, IL | 130 | 1.26 | 3.28 | $ 19.57 | $ 40,710 |
| Bremerton-Silverdale, WA | 100 | 1.09 | 2.83 | $ 27.71 | $ 57,630 |
| El Paso, TX | 330 | 1.03 | 2.67 | $ 17.86 | $ 37,160 |
| Yakima, WA | 100 | 1.02 | 2.65 | $ 24.49 | $ 50,950 |
| Wichita Falls, TX | 60 | 1.00 | 2.59 | $ 18.28 | $ 38,020 |
| Baltimore-Columbia-Towson, MD | 1,250 | 0.96 | 2.48 | $ 24.30 | $ 50,540 |
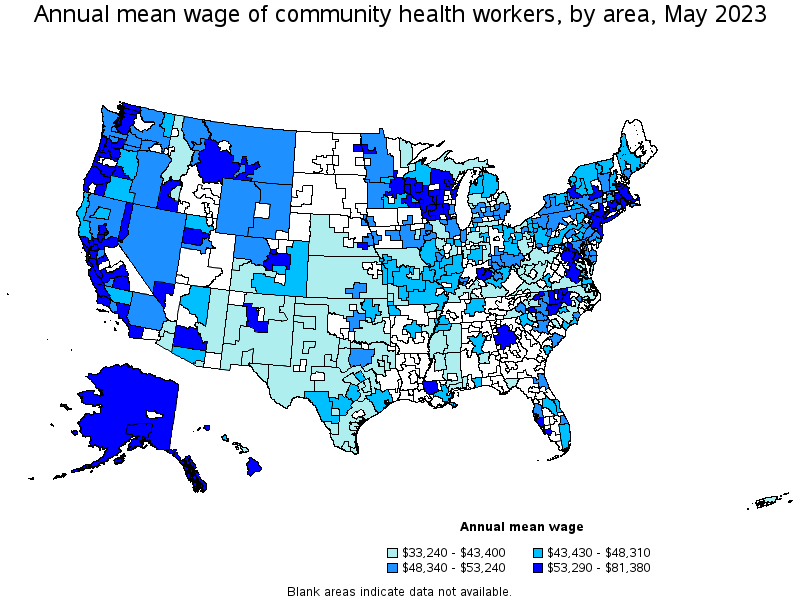
Top paying metropolitan areas for Community Health Workers:
| Metropolitan area | Employment (1) | Employment per thousand jobs | Location quotient (9) | Hourly mean wage | Annual mean wage (2) |
|---|---|---|---|---|---|
| Napa, CA | 50 | 0.67 | 1.74 | $ 39.13 | $ 81,380 |
| Carson City, NV | 130 | 4.08 | 10.59 | $ 33.93 | $ 70,570 |
| San Francisco-Oakland-Hayward, CA | 1,710 | 0.70 | 1.83 | $ 33.19 | $ 69,030 |
| San Jose-Sunnyvale-Santa Clara, CA | 460 | 0.40 | 1.04 | $ 33.00 | $ 68,650 |
| New Haven, CT | 190 | 0.64 | 1.67 | $ 32.38 | $ 67,360 |
| Albuquerque, NM | 790 | 1.99 | 5.17 | $ 32.26 | $ 67,110 |
| Albany-Schenectady-Troy, NY | 360 | 0.83 | 2.15 | $ 32.10 | $ 66,770 |
| Reno, NV | 130 | 0.50 | 1.29 | $ 31.87 | $ 66,290 |
| Bend-Redmond, OR | 80 | 0.86 | 2.24 | $ 31.56 | $ 65,650 |
| Boise City, ID | 160 | 0.43 | 1.11 | $ 30.96 | $ 64,400 |
Nonmetropolitan areas with the highest employment in Community Health Workers:
| Nonmetropolitan area | Employment (1) | Employment per thousand jobs | Location quotient (9) | Hourly mean wage | Annual mean wage (2) |
|---|---|---|---|---|---|
| Alaska nonmetropolitan area | 260 | 2.57 | 6.67 | $ 27.11 | $ 56,400 |
| North Coast Region of California nonmetropolitan area | 160 | 1.50 | 3.88 | $ 22.98 | $ 47,800 |
| Southwest New York nonmetropolitan area | 150 | 0.91 | 2.36 | $ 25.51 | $ 53,070 |
| Arizona nonmetropolitan area | 150 | 1.62 | 4.20 | $ 20.65 | $ 42,950 |
| Southeast Missouri nonmetropolitan area | 140 | 0.86 | 2.22 | $ 21.24 | $ 44,170 |
Nonmetropolitan areas with the highest concentration of jobs and location quotients in Community Health Workers:
| Nonmetropolitan area | Employment (1) | Employment per thousand jobs | Location quotient (9) | Hourly mean wage | Annual mean wage (2) |
|---|---|---|---|---|---|
| Alaska nonmetropolitan area | 260 | 2.57 | 6.67 | $ 27.11 | $ 56,400 |
| Arizona nonmetropolitan area | 150 | 1.62 | 4.20 | $ 20.65 | $ 42,950 |
| North Coast Region of California nonmetropolitan area | 160 | 1.50 | 3.88 | $ 22.98 | $ 47,800 |
| Central Oregon nonmetropolitan area | 90 | 1.43 | 3.70 | $ 22.50 | $ 46,810 |
| Massachusetts nonmetropolitan area | 70 | 1.14 | 2.95 | $ 25.09 | $ 52,180 |
Top paying nonmetropolitan areas for Community Health Workers:
| Nonmetropolitan area | Employment (1) | Employment per thousand jobs | Location quotient (9) | Hourly mean wage | Annual mean wage (2) |
|---|---|---|---|---|---|
| Coast Oregon nonmetropolitan area | 80 | 0.68 | 1.76 | $ 28.69 | $ 59,670 |
| Alaska nonmetropolitan area | 260 | 2.57 | 6.67 | $ 27.11 | $ 56,400 |
| South Central Wisconsin nonmetropolitan area | 40 | 0.19 | 0.48 | $ 26.95 | $ 56,060 |
| Southwest Montana nonmetropolitan area | 90 | 0.60 | 1.56 | $ 26.67 | $ 55,480 |
| Northeastern Wisconsin nonmetropolitan area | 50 | 0.27 | 0.69 | $ 26.64 | $ 55,400 |
These estimates are calculated with data collected from employers in all industry sectors, all metropolitan and nonmetropolitan areas, and all states and the District of Columbia. The top employment and wage figures are provided above. The complete list is available in the downloadable XLS files.
The percentile wage estimate is the value of a wage below which a certain percent of workers fall. The median wage is the 50th percentile wage estimate—50 percent of workers earn less than the median and 50 percent of workers earn more than the median. More about percentile wages.
(1) Estimates for detailed occupations do not sum to the totals because the totals include occupations not shown separately. Estimates do not include self-employed workers.
(2) Annual wages have been calculated by multiplying the hourly mean wage by a "year-round, full-time" hours figure of 2,080 hours; for those occupations where there is not an hourly wage published, the annual wage has been directly calculated from the reported survey data.
(3) The relative standard error (RSE) is a measure of the reliability of a survey statistic. The smaller the relative standard error, the more precise the estimate.
(9) The location quotient is the ratio of the area concentration of occupational employment to the national average concentration. A location quotient greater than one indicates the occupation has a higher share of employment than average, and a location quotient less than one indicates the occupation is less prevalent in the area than average.
Other OEWS estimates and related information:
May 2023 National Occupational Employment and Wage Estimates
May 2023 State Occupational Employment and Wage Estimates
May 2023 Metropolitan and Nonmetropolitan Area Occupational Employment and Wage Estimates
May 2023 National Industry-Specific Occupational Employment and Wage Estimates
Last Modified Date: April 3, 2024