
An official website of the United States government
An official website of the United States government
The .gov means it's official.
Federal government websites often end in .gov or .mil. Before sharing sensitive information,
make sure you're on a federal government site.
The site is secure.
The
https:// ensures that you are connecting to the official website and that any
information you provide is encrypted and transmitted securely.
Instruct individual students or small groups of students in academic subjects to support formal class instruction or to prepare students for standardized or admissions tests. Excludes �Postsecondary Teachers� (25-1000), �Elementary, Middle, Secondary, and Special Education Teachers� (25-2000), �Adult Basic Education, Adult Secondary Education, and English as a Second Language Instructors� (25-3011), and �Self-Enrichment Teachers� (25-3021).
Employment estimate and mean wage estimates for Tutors:
| Employment (1) | Employment RSE (3) |
Mean hourly wage |
Mean annual wage (2) |
Wage RSE (3) |
|---|---|---|---|---|
| 162,300 | 1.6 % | $ 23.36 | $ 48,580 | 1.0 % |
Percentile wage estimates for Tutors:
| Percentile | 10% | 25% | 50% (Median) |
75% | 90% |
|---|---|---|---|---|---|
| Hourly Wage | $ 13.32 | $ 15.77 | $ 19.03 | $ 26.74 | $ 38.67 |
| Annual Wage (2) | $ 27,710 | $ 32,800 | $ 39,580 | $ 55,620 | $ 80,440 |
Industries with the highest published employment and wages for Tutors are provided. For a list of all industries with employment in Tutors, see the Create Customized Tables function.
Industries with the highest levels of employment in Tutors:
| Industry | Employment (1) | Percent of industry employment | Hourly mean wage | Annual mean wage (2) |
|---|---|---|---|---|
| Other Schools and Instruction | 63,360 | 12.43 | $ 23.55 | $ 48,980 |
| Elementary and Secondary Schools | 36,540 | 0.42 | $ 25.16 | $ 52,320 |
| Colleges, Universities, and Professional Schools | 16,610 | 0.54 | $ 21.11 | $ 43,910 |
| Educational Support Services | 14,020 | 5.52 | $ 25.37 | $ 52,760 |
| Junior Colleges | 13,760 | 2.19 | $ 18.82 | $ 39,150 |
Industries with the highest concentration of employment in Tutors:
| Industry | Employment (1) | Percent of industry employment | Hourly mean wage | Annual mean wage (2) |
|---|---|---|---|---|
| Other Schools and Instruction | 63,360 | 12.43 | $ 23.55 | $ 48,980 |
| Educational Support Services | 14,020 | 5.52 | $ 25.37 | $ 52,760 |
| Junior Colleges | 13,760 | 2.19 | $ 18.82 | $ 39,150 |
| Business Schools and Computer and Management Training | 940 | 1.12 | $ 17.59 | $ 36,590 |
| Colleges, Universities, and Professional Schools | 16,610 | 0.54 | $ 21.11 | $ 43,910 |
Top paying industries for Tutors:
| Industry | Employment (1) | Percent of industry employment | Hourly mean wage | Annual mean wage (2) |
|---|---|---|---|---|
| Religious Organizations | (8) | (8) | $ 50.22 | $ 104,450 |
| Civic and Social Organizations | 1,740 | 0.52 | $ 30.23 | $ 62,880 |
| Offices of Other Health Practitioners | 260 | 0.02 | $ 29.61 | $ 61,580 |
| Outpatient Care Centers | 40 | (7) | $ 28.84 | $ 59,990 |
| Management, Scientific, and Technical Consulting Services | (8) | (8) | $ 28.25 | $ 58,760 |
States and areas with the highest published employment, location quotients, and wages for Tutors are provided. For a list of all areas with employment in Tutors, see the Create Customized Tables function.
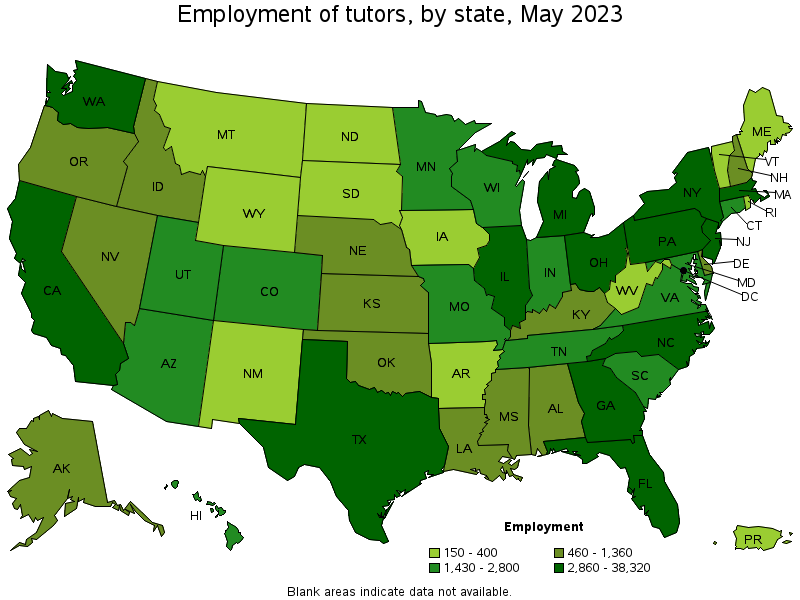
States with the highest employment level in Tutors:
| State | Employment (1) | Employment per thousand jobs | Location quotient (9) | Hourly mean wage | Annual mean wage (2) |
|---|---|---|---|---|---|
| California | 38,320 | 2.14 | 2.00 | $ 23.74 | $ 49,390 |
| New York | 13,260 | 1.41 | 1.32 | $ 33.00 | $ 68,630 |
| Florida | 11,400 | 1.19 | 1.12 | $ 22.86 | $ 47,540 |
| Texas | 10,340 | 0.76 | 0.71 | $ 18.16 | $ 37,770 |
| Ohio | 6,750 | 1.23 | 1.16 | $ 24.00 | $ 49,910 |
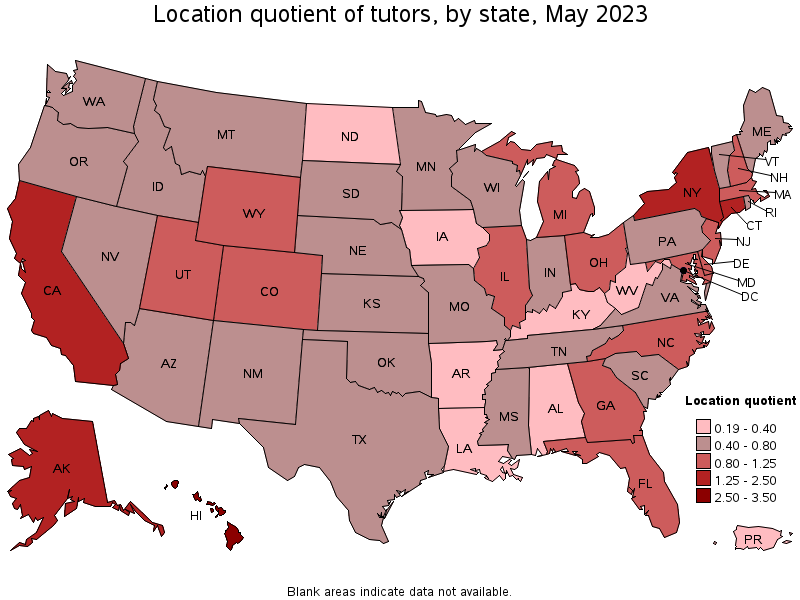
States with the highest concentration of jobs and location quotients in Tutors:
| State | Employment (1) | Employment per thousand jobs | Location quotient (9) | Hourly mean wage | Annual mean wage (2) |
|---|---|---|---|---|---|
| Hawaii | 1,970 | 3.19 | 2.98 | $ 18.08 | $ 37,610 |
| California | 38,320 | 2.14 | 2.00 | $ 23.74 | $ 49,390 |
| Connecticut | 2,680 | 1.61 | 1.51 | $ 29.02 | $ 60,370 |
| Alaska | 490 | 1.56 | 1.46 | $ 25.12 | $ 52,250 |
| New York | 13,260 | 1.41 | 1.32 | $ 33.00 | $ 68,630 |
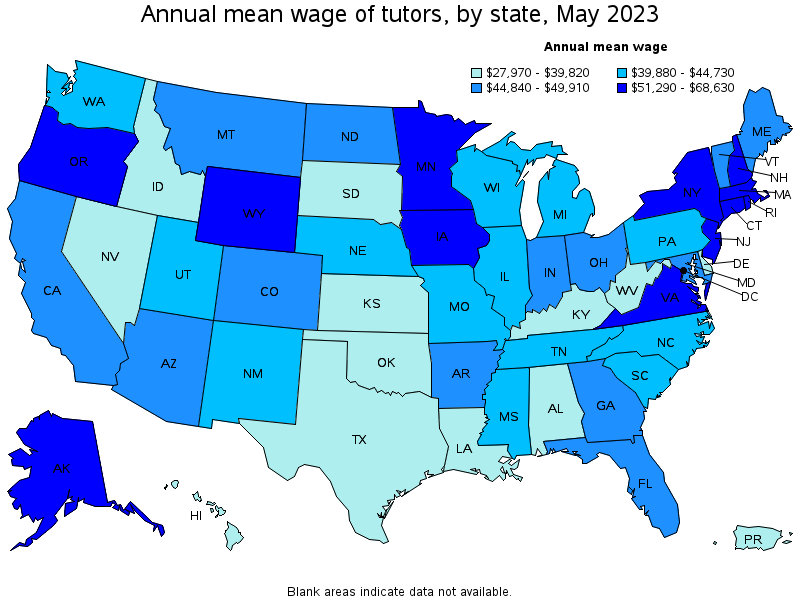
Top paying states for Tutors:
| State | Employment (1) | Employment per thousand jobs | Location quotient (9) | Hourly mean wage | Annual mean wage (2) |
|---|---|---|---|---|---|
| New York | 13,260 | 1.41 | 1.32 | $ 33.00 | $ 68,630 |
| Wyoming | 360 | 1.33 | 1.24 | $ 32.44 | $ 67,470 |
| Massachusetts | 4,790 | 1.32 | 1.23 | $ 31.54 | $ 65,610 |
| Connecticut | 2,680 | 1.61 | 1.51 | $ 29.02 | $ 60,370 |
| District of Columbia | 150 | 0.21 | 0.19 | $ 28.47 | $ 59,210 |
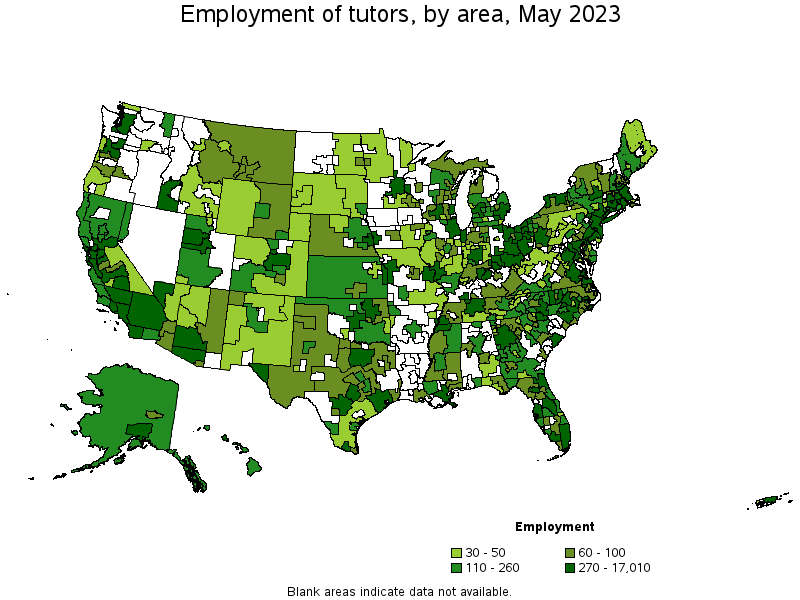
Metropolitan areas with the highest employment level in Tutors:
| Metropolitan area | Employment (1) | Employment per thousand jobs | Location quotient (9) | Hourly mean wage | Annual mean wage (2) |
|---|---|---|---|---|---|
| Los Angeles-Long Beach-Anaheim, CA | 17,010 | 2.75 | 2.57 | $ 22.50 | $ 46,800 |
| New York-Newark-Jersey City, NY-NJ-PA | 14,580 | 1.54 | 1.44 | $ 32.87 | $ 68,360 |
| San Francisco-Oakland-Hayward, CA | 5,380 | 2.22 | 2.08 | $ 28.32 | $ 58,910 |
| Chicago-Naperville-Elgin, IL-IN-WI | 5,270 | 1.17 | 1.09 | $ 20.17 | $ 41,940 |
| Miami-Fort Lauderdale-West Palm Beach, FL | 4,720 | 1.73 | 1.62 | $ 24.55 | $ 51,060 |
| Atlanta-Sandy Springs-Roswell, GA | 4,170 | 1.48 | 1.38 | $ 22.25 | $ 46,280 |
| Boston-Cambridge-Nashua, MA-NH | 3,790 | 1.37 | 1.28 | $ 32.68 | $ 67,980 |
| Houston-The Woodlands-Sugar Land, TX | 2,970 | 0.93 | 0.87 | $ 18.31 | $ 38,080 |
| San Diego-Carlsbad, CA | 2,960 | 1.94 | 1.82 | $ 25.49 | $ 53,020 |
| Dallas-Fort Worth-Arlington, TX | 2,900 | 0.73 | 0.68 | $ 18.31 | $ 38,090 |
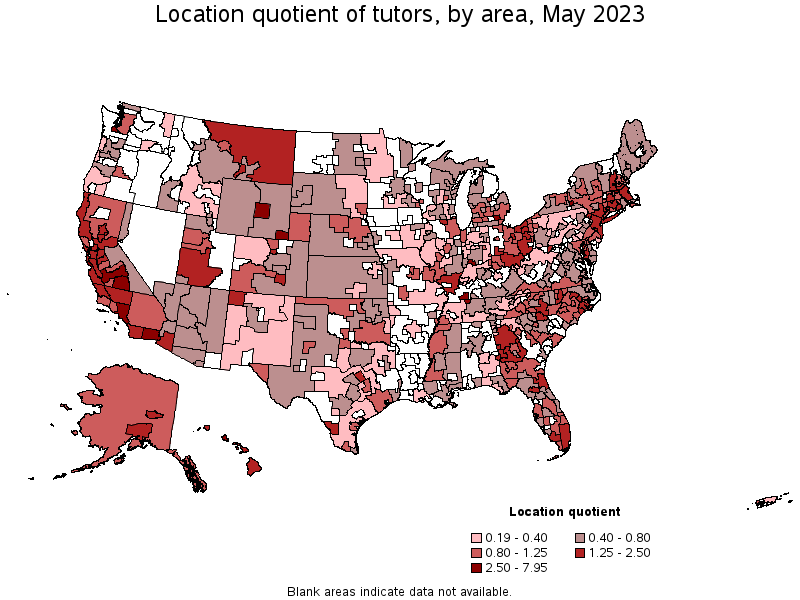
Metropolitan areas with the highest concentration of jobs and location quotients in Tutors:
| Metropolitan area | Employment (1) | Employment per thousand jobs | Location quotient (9) | Hourly mean wage | Annual mean wage (2) |
|---|---|---|---|---|---|
| Ann Arbor, MI | 1,830 | 8.50 | 7.95 | $ 18.12 | $ 37,700 |
| Visalia-Porterville, CA | 720 | 4.28 | 4.00 | $ 18.95 | $ 39,410 |
| Urban Honolulu, HI | 1,650 | 3.76 | 3.52 | $ 17.81 | $ 37,050 |
| Clarksville, TN-KY | 340 | 3.58 | 3.35 | $ 14.25 | $ 29,640 |
| Olympia-Tumwater, WA | 440 | 3.55 | 3.33 | $ 18.94 | $ 39,390 |
| Leominster-Gardner, MA | 170 | 3.23 | 3.02 | $ 20.75 | $ 43,160 |
| El Centro, CA | 200 | 3.21 | 3.00 | $ 23.16 | $ 48,170 |
| Cheyenne, WY | 140 | 2.96 | 2.77 | $ 30.40 | $ 63,220 |
| Santa Cruz-Watsonville, CA | 280 | 2.89 | 2.71 | $ 19.96 | $ 41,520 |
| Bloomington, IN | 210 | 2.88 | 2.70 | $ 19.83 | $ 41,240 |
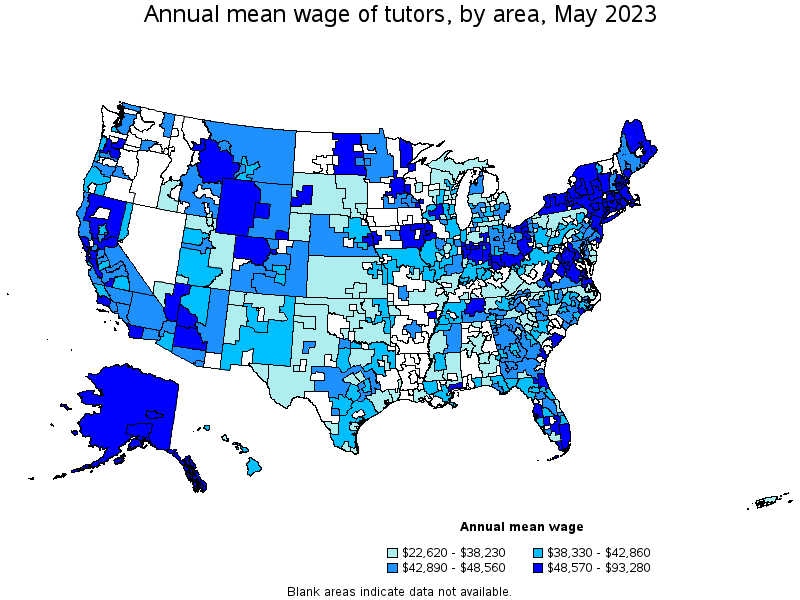
Top paying metropolitan areas for Tutors:
| Metropolitan area | Employment (1) | Employment per thousand jobs | Location quotient (9) | Hourly mean wage | Annual mean wage (2) |
|---|---|---|---|---|---|
| Casper, WY | 110 | 2.86 | 2.67 | $ 44.85 | $ 93,280 |
| Jonesboro, AR | 40 | 0.65 | 0.61 | $ 37.36 | $ 77,720 |
| New York-Newark-Jersey City, NY-NJ-PA | 14,580 | 1.54 | 1.44 | $ 32.87 | $ 68,360 |
| Boston-Cambridge-Nashua, MA-NH | 3,790 | 1.37 | 1.28 | $ 32.68 | $ 67,980 |
| Waterbury, CT | 160 | 2.35 | 2.20 | $ 31.80 | $ 66,140 |
| Bridgeport-Stamford-Norwalk, CT | 510 | 1.27 | 1.19 | $ 30.76 | $ 63,980 |
| Albany-Schenectady-Troy, NY | 390 | 0.88 | 0.82 | $ 30.50 | $ 63,440 |
| Cheyenne, WY | 140 | 2.96 | 2.77 | $ 30.40 | $ 63,220 |
| Binghamton, NY | 60 | 0.60 | 0.56 | $ 30.19 | $ 62,780 |
| Barnstable Town, MA | 50 | 0.52 | 0.49 | $ 30.00 | $ 62,400 |
Nonmetropolitan areas with the highest employment in Tutors:
| Nonmetropolitan area | Employment (1) | Employment per thousand jobs | Location quotient (9) | Hourly mean wage | Annual mean wage (2) |
|---|---|---|---|---|---|
| North Northeastern Ohio nonmetropolitan area (noncontiguous) | 380 | 1.16 | 1.09 | $ 21.80 | $ 45,330 |
| Southern Ohio nonmetropolitan area | 370 | 2.34 | 2.19 | $ 29.00 | $ 60,320 |
| Eastern Ohio nonmetropolitan area | 330 | 2.42 | 2.26 | $ 32.10 | $ 66,770 |
| Southeast Coastal North Carolina nonmetropolitan area | 280 | 1.13 | 1.05 | $ 21.21 | $ 44,110 |
| Piedmont North Carolina nonmetropolitan area | 240 | 0.93 | 0.87 | $ 18.08 | $ 37,600 |
Nonmetropolitan areas with the highest concentration of jobs and location quotients in Tutors:
| Nonmetropolitan area | Employment (1) | Employment per thousand jobs | Location quotient (9) | Hourly mean wage | Annual mean wage (2) |
|---|---|---|---|---|---|
| Eastern Ohio nonmetropolitan area | 330 | 2.42 | 2.26 | $ 32.10 | $ 66,770 |
| Southern Ohio nonmetropolitan area | 370 | 2.34 | 2.19 | $ 29.00 | $ 60,320 |
| North Coast Region of California nonmetropolitan area | 220 | 2.08 | 1.95 | $ 20.82 | $ 43,300 |
| Central Utah nonmetropolitan area | 110 | 1.83 | 1.71 | $ 19.44 | $ 40,440 |
| Hawaii / Kauai nonmetropolitan area | 170 | 1.69 | 1.58 | $ 18.91 | $ 39,330 |
Top paying nonmetropolitan areas for Tutors:
| Nonmetropolitan area | Employment (1) | Employment per thousand jobs | Location quotient (9) | Hourly mean wage | Annual mean wage (2) |
|---|---|---|---|---|---|
| Massachusetts nonmetropolitan area | 80 | 1.24 | 1.16 | $ 34.29 | $ 71,330 |
| South Florida nonmetropolitan area | 100 | 1.25 | 1.17 | $ 33.21 | $ 69,070 |
| Eastern Ohio nonmetropolitan area | 330 | 2.42 | 2.26 | $ 32.10 | $ 66,770 |
| Connecticut nonmetropolitan area | 40 | 1.26 | 1.18 | $ 31.56 | $ 65,640 |
| Southeast Iowa nonmetropolitan area | 50 | 0.22 | 0.21 | $ 30.43 | $ 63,290 |
These estimates are calculated with data collected from employers in all industry sectors, all metropolitan and nonmetropolitan areas, and all states and the District of Columbia. The top employment and wage figures are provided above. The complete list is available in the downloadable XLS files.
The percentile wage estimate is the value of a wage below which a certain percent of workers fall. The median wage is the 50th percentile wage estimate—50 percent of workers earn less than the median and 50 percent of workers earn more than the median. More about percentile wages.
(1) Estimates for detailed occupations do not sum to the totals because the totals include occupations not shown separately. Estimates do not include self-employed workers.
(2) Annual wages have been calculated by multiplying the hourly mean wage by a "year-round, full-time" hours figure of 2,080 hours; for those occupations where there is not an hourly wage published, the annual wage has been directly calculated from the reported survey data.
(3) The relative standard error (RSE) is a measure of the reliability of a survey statistic. The smaller the relative standard error, the more precise the estimate.
(7) The value is less than .005 percent of industry employment.
(8) Estimate not released.
(9) The location quotient is the ratio of the area concentration of occupational employment to the national average concentration. A location quotient greater than one indicates the occupation has a higher share of employment than average, and a location quotient less than one indicates the occupation is less prevalent in the area than average.
Other OEWS estimates and related information:
May 2023 National Occupational Employment and Wage Estimates
May 2023 State Occupational Employment and Wage Estimates
May 2023 Metropolitan and Nonmetropolitan Area Occupational Employment and Wage Estimates
May 2023 National Industry-Specific Occupational Employment and Wage Estimates
Last Modified Date: April 3, 2024