
An official website of the United States government
An official website of the United States government
The .gov means it's official.
Federal government websites often end in .gov or .mil. Before sharing sensitive information,
make sure you're on a federal government site.
The site is secure.
The
https:// ensures that you are connecting to the official website and that any
information you provide is encrypted and transmitted securely.
Produce or direct stage, television, radio, video, or film productions for entertainment, information, or instruction. Responsible for creative decisions, such as interpretation of script, choice of actors or guests, set design, sound, special effects, and choreography.
Employment estimate and mean wage estimates for Producers and Directors:
| Employment (1) | Employment RSE (3) |
Mean hourly wage |
Mean annual wage (2) |
Wage RSE (3) |
|---|---|---|---|---|
| 154,470 | 1.3 % | $ 51.52 | $ 107,170 | 3.9 % |
Percentile wage estimates for Producers and Directors:
| Percentile | 10% | 25% | 50% (Median) |
75% | 90% |
|---|---|---|---|---|---|
| Hourly Wage | $ 20.21 | $ 28.15 | $ 39.67 | $ 61.56 | $ 83.91 |
| Annual Wage (2) | $ 42,040 | $ 58,540 | $ 82,510 | $ 128,040 | $ 174,540 |
Industries with the highest published employment and wages for Producers and Directors are provided. For a list of all industries with employment in Producers and Directors, see the Create Customized Tables function.
Industries with the highest levels of employment in Producers and Directors:
| Industry | Employment (1) | Percent of industry employment | Hourly mean wage | Annual mean wage (2) |
|---|---|---|---|---|
| Motion Picture and Video Industries | 51,050 | 12.64 | $ 62.80 | $ 130,620 |
| Media Streaming Distribution Services, Social Networks, and Other Media Networks and Content Providers | 22,100 | 9.48 | $ 52.41 | $ 109,010 |
| Radio and Television Broadcasting Stations | 19,670 | 16.15 | $ 34.48 | $ 71,710 |
| Advertising, Public Relations, and Related Services | 9,670 | 1.93 | $ 53.75 | $ 111,790 |
| Performing Arts Companies | 8,410 | 6.23 | $ 37.18 | $ 77,330 |
Industries with the highest concentration of employment in Producers and Directors:
| Industry | Employment (1) | Percent of industry employment | Hourly mean wage | Annual mean wage (2) |
|---|---|---|---|---|
| Radio and Television Broadcasting Stations | 19,670 | 16.15 | $ 34.48 | $ 71,710 |
| Motion Picture and Video Industries | 51,050 | 12.64 | $ 62.80 | $ 130,620 |
| Media Streaming Distribution Services, Social Networks, and Other Media Networks and Content Providers | 22,100 | 9.48 | $ 52.41 | $ 109,010 |
| Sound Recording Industries | 1,990 | 9.38 | $ 46.58 | $ 96,890 |
| Performing Arts Companies | 8,410 | 6.23 | $ 37.18 | $ 77,330 |
Top paying industries for Producers and Directors:
| Industry | Employment (1) | Percent of industry employment | Hourly mean wage | Annual mean wage (2) |
|---|---|---|---|---|
| Computer and Peripheral Equipment Manufacturing | 60 | 0.04 | $ 80.70 | $ 167,850 |
| Architectural, Engineering, and Related Services | 70 | (7) | $ 75.69 | $ 157,440 |
| Web Search Portals, Libraries, Archives, and Other Information Services | 320 | 0.17 | $ 72.50 | $ 150,800 |
| Software Publishers | 1,720 | 0.26 | $ 71.84 | $ 149,430 |
| Motion Picture and Video Industries | 51,050 | 12.64 | $ 62.80 | $ 130,620 |
States and areas with the highest published employment, location quotients, and wages for Producers and Directors are provided. For a list of all areas with employment in Producers and Directors, see the Create Customized Tables function.
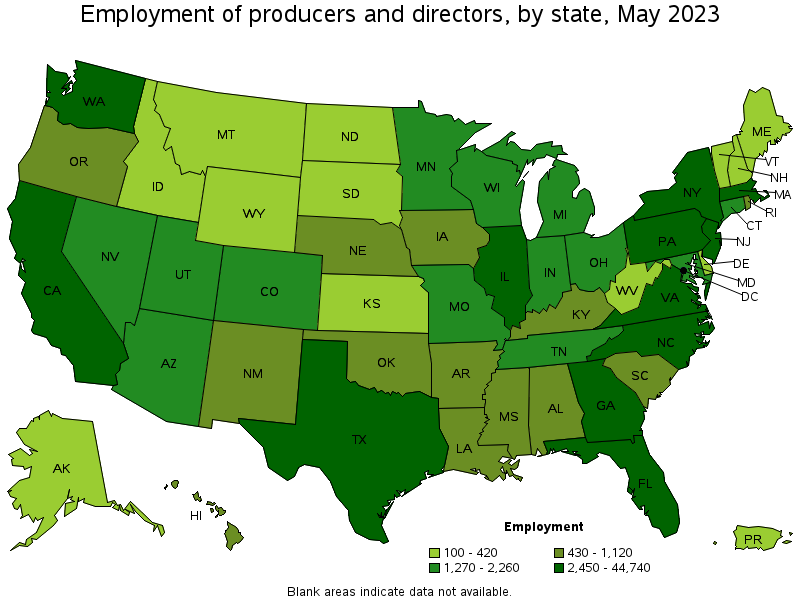
States with the highest employment level in Producers and Directors:
| State | Employment (1) | Employment per thousand jobs | Location quotient (9) | Hourly mean wage | Annual mean wage (2) |
|---|---|---|---|---|---|
| California | 44,740 | 2.49 | 2.45 | $ 63.94 | $ 132,990 |
| New York | 29,180 | 3.11 | 3.05 | $ 66.86 | $ 139,060 |
| Florida | 7,790 | 0.81 | 0.80 | $ 40.36 | $ 83,950 |
| Texas | 7,290 | 0.54 | 0.53 | $ 36.57 | $ 76,060 |
| Pennsylvania | 4,630 | 0.78 | 0.77 | $ 39.31 | $ 81,770 |
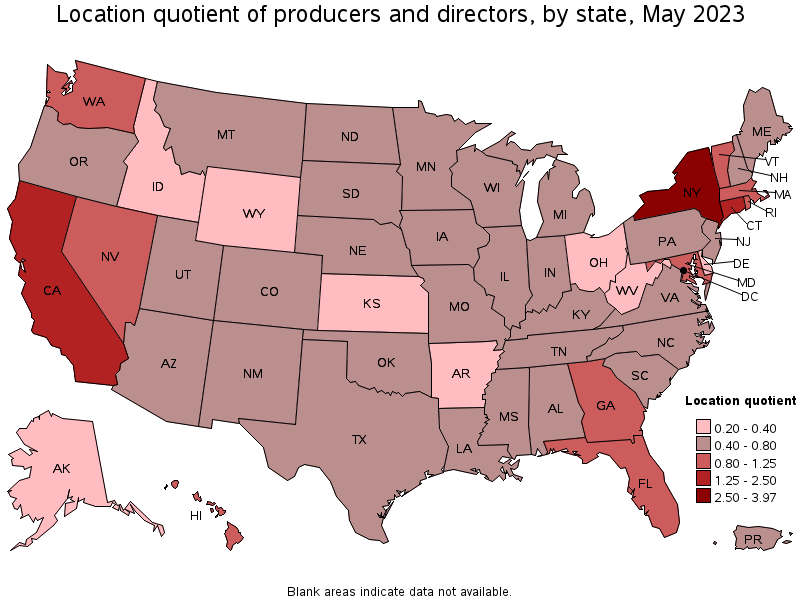
States with the highest concentration of jobs and location quotients in Producers and Directors:
| State | Employment (1) | Employment per thousand jobs | Location quotient (9) | Hourly mean wage | Annual mean wage (2) |
|---|---|---|---|---|---|
| District of Columbia | 2,830 | 4.04 | 3.97 | $ 49.22 | $ 102,380 |
| New York | 29,180 | 3.11 | 3.05 | $ 66.86 | $ 139,060 |
| California | 44,740 | 2.49 | 2.45 | $ 63.94 | $ 132,990 |
| Connecticut | 2,260 | 1.36 | 1.34 | $ 49.76 | $ 103,500 |
| Massachusetts | 4,490 | 1.23 | 1.21 | $ 41.85 | $ 87,050 |
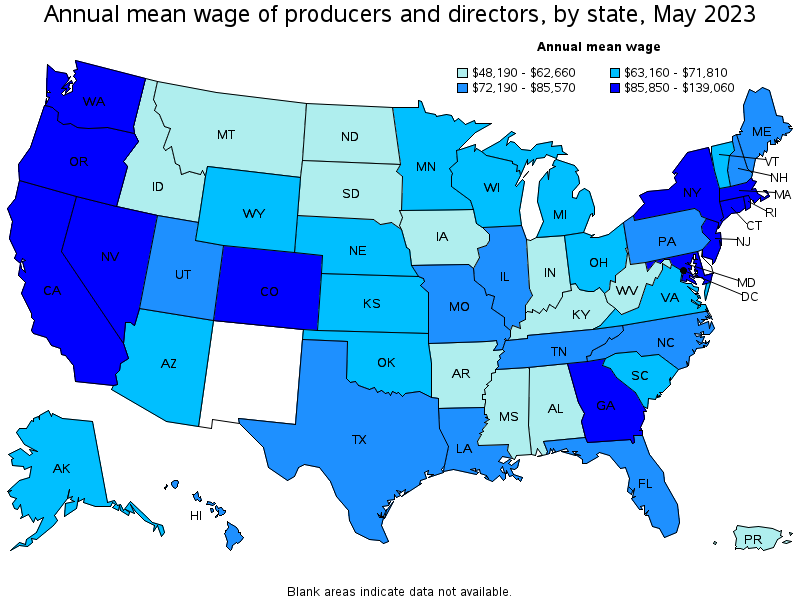
Top paying states for Producers and Directors:
| State | Employment (1) | Employment per thousand jobs | Location quotient (9) | Hourly mean wage | Annual mean wage (2) |
|---|---|---|---|---|---|
| New York | 29,180 | 3.11 | 3.05 | $ 66.86 | $ 139,060 |
| California | 44,740 | 2.49 | 2.45 | $ 63.94 | $ 132,990 |
| New Jersey | 3,110 | 0.74 | 0.73 | $ 57.85 | $ 120,330 |
| Connecticut | 2,260 | 1.36 | 1.34 | $ 49.76 | $ 103,500 |
| District of Columbia | 2,830 | 4.04 | 3.97 | $ 49.22 | $ 102,380 |
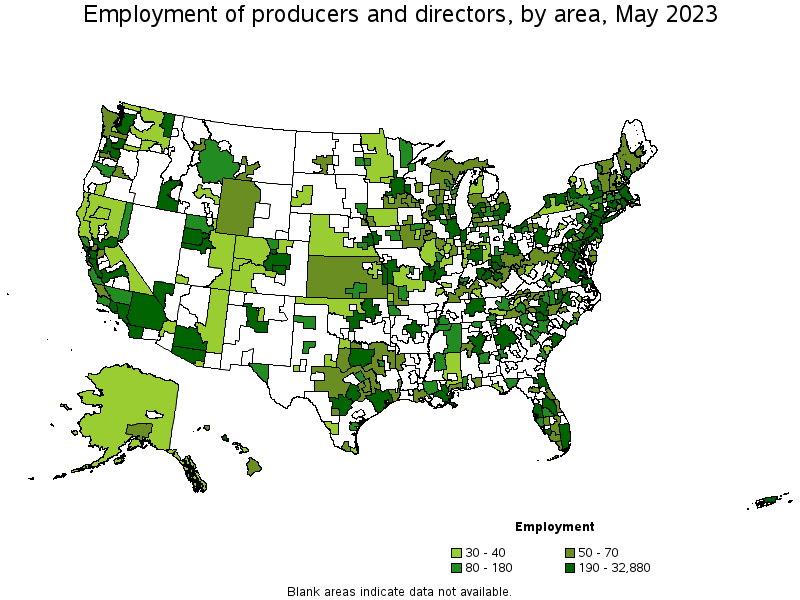
Metropolitan areas with the highest employment level in Producers and Directors:
| Metropolitan area | Employment (1) | Employment per thousand jobs | Location quotient (9) | Hourly mean wage | Annual mean wage (2) |
|---|---|---|---|---|---|
| Los Angeles-Long Beach-Anaheim, CA | 32,880 | 5.32 | 5.23 | $ 64.30 | $ 133,750 |
| New York-Newark-Jersey City, NY-NJ-PA | 28,530 | 3.00 | 2.95 | $ 67.66 | $ 140,730 |
| San Francisco-Oakland-Hayward, CA | 5,150 | 2.12 | 2.09 | (8) | (8) |
| Washington-Arlington-Alexandria, DC-VA-MD-WV | 4,380 | 1.41 | 1.39 | $ 47.82 | $ 99,470 |
| Boston-Cambridge-Nashua, MA-NH | 3,750 | 1.36 | 1.34 | $ 42.58 | $ 88,570 |
| Atlanta-Sandy Springs-Roswell, GA | 2,910 | 1.03 | 1.02 | $ 45.29 | $ 94,210 |
| Miami-Fort Lauderdale-West Palm Beach, FL | 2,760 | 1.01 | 1.00 | $ 40.99 | $ 85,270 |
| Seattle-Tacoma-Bellevue, WA | 2,680 | 1.29 | 1.27 | $ 45.06 | $ 93,720 |
| Dallas-Fort Worth-Arlington, TX | 2,560 | 0.65 | 0.63 | $ 38.02 | $ 79,090 |
| Philadelphia-Camden-Wilmington, PA-NJ-DE-MD | 2,440 | 0.86 | 0.85 | $ 44.86 | $ 93,300 |
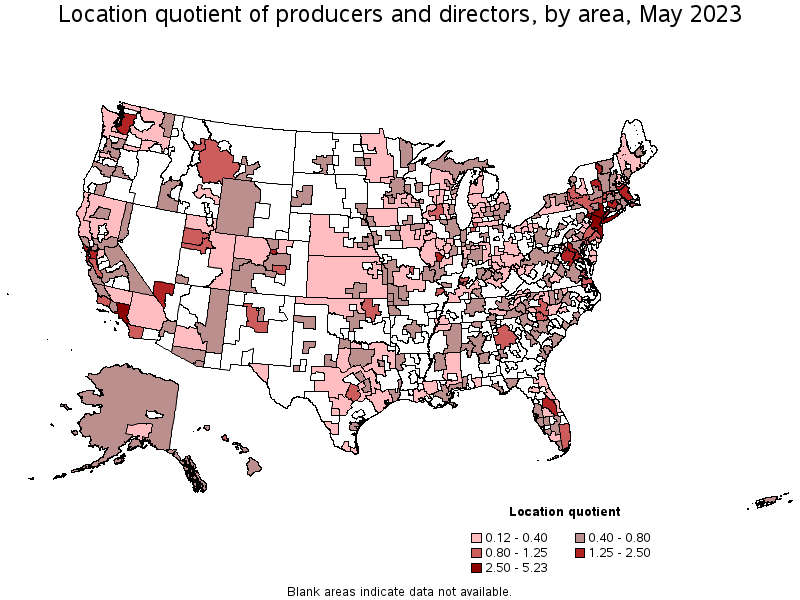
Metropolitan areas with the highest concentration of jobs and location quotients in Producers and Directors:
| Metropolitan area | Employment (1) | Employment per thousand jobs | Location quotient (9) | Hourly mean wage | Annual mean wage (2) |
|---|---|---|---|---|---|
| Los Angeles-Long Beach-Anaheim, CA | 32,880 | 5.32 | 5.23 | $ 64.30 | $ 133,750 |
| New York-Newark-Jersey City, NY-NJ-PA | 28,530 | 3.00 | 2.95 | $ 67.66 | $ 140,730 |
| San Francisco-Oakland-Hayward, CA | 5,150 | 2.12 | 2.09 | (8) | (8) |
| Glens Falls, NY | 100 | 2.07 | 2.04 | $ 39.74 | $ 82,660 |
| Hartford-West Hartford-East Hartford, CT | 1,120 | 1.98 | 1.94 | $ 49.96 | $ 103,910 |
| Bridgeport-Stamford-Norwalk, CT | 690 | 1.73 | 1.70 | $ 51.56 | $ 107,230 |
| Orlando-Kissimmee-Sanford, FL | 2,300 | 1.68 | 1.66 | $ 44.61 | $ 92,780 |
| Springfield, IL | 150 | 1.48 | 1.46 | $ 36.83 | $ 76,600 |
| Burlington-South Burlington, VT | 170 | 1.42 | 1.40 | $ 31.00 | $ 64,470 |
| Washington-Arlington-Alexandria, DC-VA-MD-WV | 4,380 | 1.41 | 1.39 | $ 47.82 | $ 99,470 |
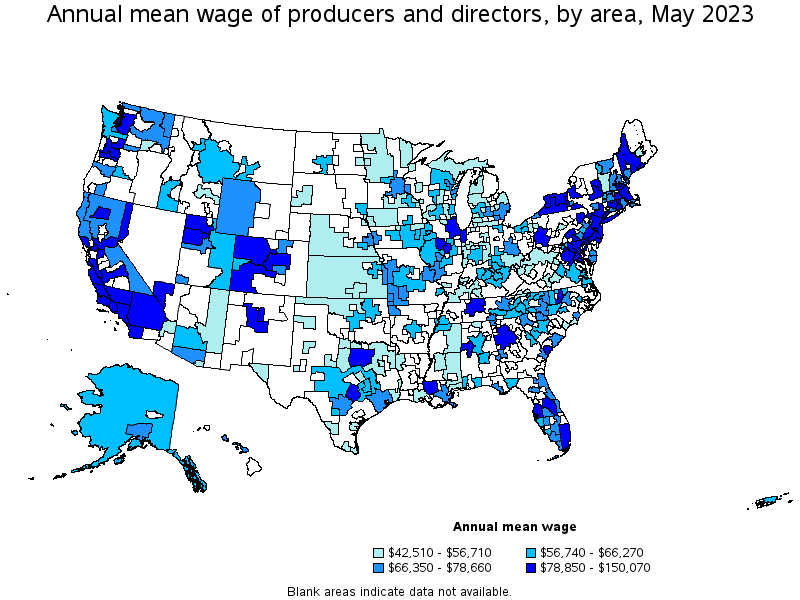
Top paying metropolitan areas for Producers and Directors:
| Metropolitan area | Employment (1) | Employment per thousand jobs | Location quotient (9) | Hourly mean wage | Annual mean wage (2) |
|---|---|---|---|---|---|
| San Jose-Sunnyvale-Santa Clara, CA | 1,060 | 0.93 | 0.92 | $ 72.15 | $ 150,070 |
| New York-Newark-Jersey City, NY-NJ-PA | 28,530 | 3.00 | 2.95 | $ 67.66 | $ 140,730 |
| Los Angeles-Long Beach-Anaheim, CA | 32,880 | 5.32 | 5.23 | $ 64.30 | $ 133,750 |
| California-Lexington Park, MD | 30 | 0.72 | 0.71 | $ 63.39 | $ 131,850 |
| Trenton, NJ | 280 | 1.18 | 1.16 | $ 61.96 | $ 128,880 |
| Vallejo-Fairfield, CA | 60 | 0.42 | 0.41 | $ 57.45 | $ 119,490 |
| Oxnard-Thousand Oaks-Ventura, CA | 220 | 0.71 | 0.70 | $ 53.41 | $ 111,090 |
| San Luis Obispo-Paso Robles-Arroyo Grande, CA | 70 | 0.62 | 0.61 | $ 51.63 | $ 107,390 |
| Bridgeport-Stamford-Norwalk, CT | 690 | 1.73 | 1.70 | $ 51.56 | $ 107,230 |
| Santa Cruz-Watsonville, CA | 50 | 0.48 | 0.48 | $ 51.29 | $ 106,680 |
Nonmetropolitan areas with the highest employment in Producers and Directors:
| Nonmetropolitan area | Employment (1) | Employment per thousand jobs | Location quotient (9) | Hourly mean wage | Annual mean wage (2) |
|---|---|---|---|---|---|
| Central East New York nonmetropolitan area | 160 | 1.03 | 1.02 | (8) | (8) |
| Southwest Montana nonmetropolitan area | 130 | 0.85 | 0.84 | $ 28.71 | $ 59,710 |
| Northeast Mississippi nonmetropolitan area | 110 | 0.49 | 0.48 | $ 23.61 | $ 49,110 |
| Southern Vermont nonmetropolitan area | 70 | 0.73 | 0.71 | $ 27.10 | $ 56,370 |
| Balance of Lower Peninsula of Michigan nonmetropolitan area | 70 | 0.25 | 0.25 | $ 27.12 | $ 56,410 |
Nonmetropolitan areas with the highest concentration of jobs and location quotients in Producers and Directors:
| Nonmetropolitan area | Employment (1) | Employment per thousand jobs | Location quotient (9) | Hourly mean wage | Annual mean wage (2) |
|---|---|---|---|---|---|
| Massachusetts nonmetropolitan area | 70 | 1.05 | 1.03 | $ 32.66 | $ 67,930 |
| Central East New York nonmetropolitan area | 160 | 1.03 | 1.02 | (8) | (8) |
| Southwest Montana nonmetropolitan area | 130 | 0.85 | 0.84 | $ 28.71 | $ 59,710 |
| Northern Vermont nonmetropolitan area | 60 | 0.80 | 0.79 | $ 33.04 | $ 68,710 |
| Southern Vermont nonmetropolitan area | 70 | 0.73 | 0.71 | $ 27.10 | $ 56,370 |
Top paying nonmetropolitan areas for Producers and Directors:
| Nonmetropolitan area | Employment (1) | Employment per thousand jobs | Location quotient (9) | Hourly mean wage | Annual mean wage (2) |
|---|---|---|---|---|---|
| Southwest Maine nonmetropolitan area | 50 | 0.28 | 0.28 | $ 48.39 | $ 100,640 |
| Southwest New York nonmetropolitan area | 40 | 0.22 | 0.22 | $ 42.10 | $ 87,570 |
| Northwest Colorado nonmetropolitan area | 40 | 0.35 | 0.35 | $ 39.84 | $ 82,870 |
| Southwest Colorado nonmetropolitan area | 40 | 0.43 | 0.42 | $ 39.64 | $ 82,460 |
| North Coast Region of California nonmetropolitan area | 40 | 0.39 | 0.39 | $ 37.31 | $ 77,610 |
These estimates are calculated with data collected from employers in all industry sectors, all metropolitan and nonmetropolitan areas, and all states and the District of Columbia. The top employment and wage figures are provided above. The complete list is available in the downloadable XLS files.
The percentile wage estimate is the value of a wage below which a certain percent of workers fall. The median wage is the 50th percentile wage estimate—50 percent of workers earn less than the median and 50 percent of workers earn more than the median. More about percentile wages.
(1) Estimates for detailed occupations do not sum to the totals because the totals include occupations not shown separately. Estimates do not include self-employed workers.
(2) Annual wages have been calculated by multiplying the hourly mean wage by a "year-round, full-time" hours figure of 2,080 hours; for those occupations where there is not an hourly wage published, the annual wage has been directly calculated from the reported survey data.
(3) The relative standard error (RSE) is a measure of the reliability of a survey statistic. The smaller the relative standard error, the more precise the estimate.
(7) The value is less than .005 percent of industry employment.
(8) Estimate not released.
(9) The location quotient is the ratio of the area concentration of occupational employment to the national average concentration. A location quotient greater than one indicates the occupation has a higher share of employment than average, and a location quotient less than one indicates the occupation is less prevalent in the area than average.
Other OEWS estimates and related information:
May 2023 National Occupational Employment and Wage Estimates
May 2023 State Occupational Employment and Wage Estimates
May 2023 Metropolitan and Nonmetropolitan Area Occupational Employment and Wage Estimates
May 2023 National Industry-Specific Occupational Employment and Wage Estimates
Last Modified Date: April 3, 2024