
An official website of the United States government
An official website of the United States government
The .gov means it's official.
Federal government websites often end in .gov or .mil. Before sharing sensitive information,
make sure you're on a federal government site.
The site is secure.
The
https:// ensures that you are connecting to the official website and that any
information you provide is encrypted and transmitted securely.
Write technical materials, such as equipment manuals, appendices, or operating and maintenance instructions. May assist in layout work.
Employment estimate and mean wage estimates for Technical Writers:
| Employment (1) | Employment RSE (3) |
Mean hourly wage |
Mean annual wage (2) |
Wage RSE (3) |
|---|---|---|---|---|
| 47,970 | 2.5 % | $ 41.64 | $ 86,620 | 1.3 % |
Percentile wage estimates for Technical Writers:
| Percentile | 10% | 25% | 50% (Median) |
75% | 90% |
|---|---|---|---|---|---|
| Hourly Wage | $ 23.38 | $ 29.84 | $ 38.49 | $ 49.17 | $ 62.23 |
| Annual Wage (2) | $ 48,630 | $ 62,060 | $ 80,050 | $ 102,260 | $ 129,440 |
Industries with the highest published employment and wages for Technical Writers are provided. For a list of all industries with employment in Technical Writers, see the Create Customized Tables function.
Industries with the highest levels of employment in Technical Writers:
| Industry | Employment (1) | Percent of industry employment | Hourly mean wage | Annual mean wage (2) |
|---|---|---|---|---|
| Computer Systems Design and Related Services | 9,210 | 0.36 | $ 40.68 | $ 84,620 |
| Management, Scientific, and Technical Consulting Services | 3,930 | 0.21 | $ 39.47 | $ 82,100 |
| Employment Services | 3,090 | 0.08 | $ 48.21 | $ 100,270 |
| Scientific Research and Development Services | 2,680 | 0.29 | $ 48.65 | $ 101,190 |
| Architectural, Engineering, and Related Services | 2,640 | 0.16 | $ 40.28 | $ 83,780 |
Industries with the highest concentration of employment in Technical Writers:
| Industry | Employment (1) | Percent of industry employment | Hourly mean wage | Annual mean wage (2) |
|---|---|---|---|---|
| Independent Artists, Writers, and Performers | 270 | 0.42 | $ 48.32 | $ 100,500 |
| Software Publishers | 2,320 | 0.36 | $ 47.07 | $ 97,910 |
| Computer Systems Design and Related Services | 9,210 | 0.36 | $ 40.68 | $ 84,620 |
| Navigational, Measuring, Electromedical, and Control Instruments Manufacturing | 1,390 | 0.33 | $ 44.51 | $ 92,580 |
| Communications Equipment Manufacturing | 250 | 0.30 | $ 41.41 | $ 86,140 |
Top paying industries for Technical Writers:
| Industry | Employment (1) | Percent of industry employment | Hourly mean wage | Annual mean wage (2) |
|---|---|---|---|---|
| Merchant Wholesalers, Nondurable Goods (4242 and 4246 only) | 230 | 0.06 | $ 72.23 | $ 150,240 |
| Electric Power Generation, Transmission and Distribution | 240 | 0.06 | $ 55.39 | $ 115,220 |
| Computer and Peripheral Equipment Manufacturing | 350 | 0.22 | $ 54.75 | $ 113,880 |
| Merchant Wholesalers, Nondurable Goods (4241, 4247, and 4249 only) | 30 | 0.01 | $ 53.20 | $ 110,660 |
| Securities, Commodity Contracts, and Other Financial Investments and Related Activities | 200 | 0.02 | $ 52.25 | $ 108,680 |
States and areas with the highest published employment, location quotients, and wages for Technical Writers are provided. For a list of all areas with employment in Technical Writers, see the Create Customized Tables function.
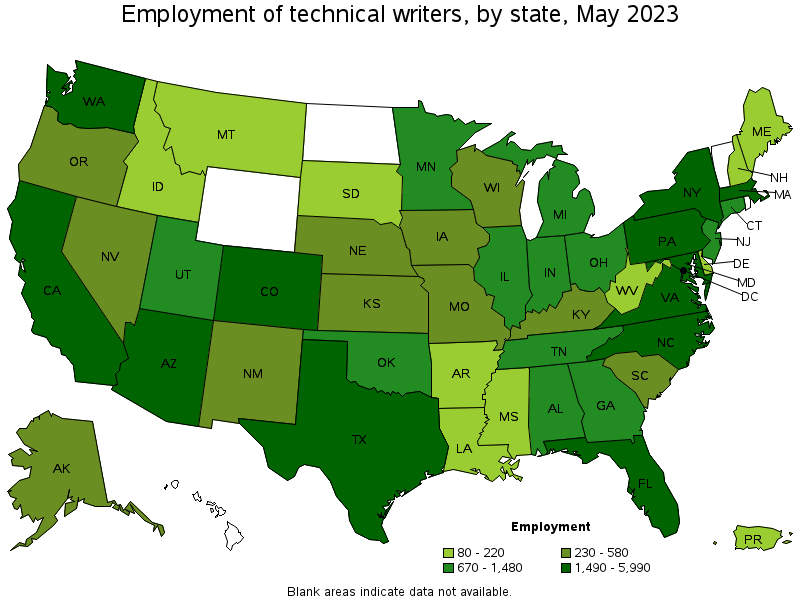
States with the highest employment level in Technical Writers:
| State | Employment (1) | Employment per thousand jobs | Location quotient (9) | Hourly mean wage | Annual mean wage (2) |
|---|---|---|---|---|---|
| California | 5,990 | 0.33 | 1.06 | $ 52.59 | $ 109,380 |
| Texas | 3,510 | 0.26 | 0.82 | $ 36.51 | $ 75,950 |
| Florida | 2,860 | 0.30 | 0.94 | $ 37.56 | $ 78,130 |
| Virginia | 2,500 | 0.63 | 1.99 | $ 44.00 | $ 91,510 |
| New York | 2,420 | 0.26 | 0.82 | $ 45.20 | $ 94,020 |
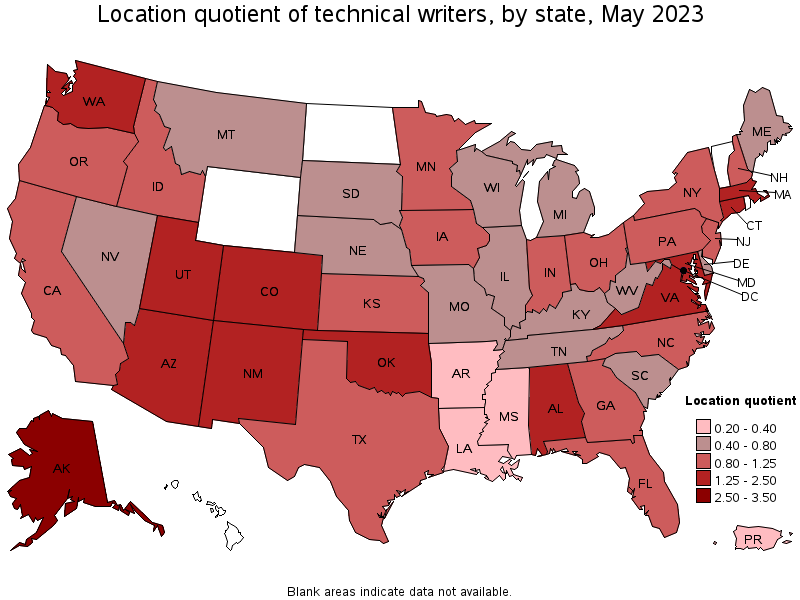
States with the highest concentration of jobs and location quotients in Technical Writers:
| State | Employment (1) | Employment per thousand jobs | Location quotient (9) | Hourly mean wage | Annual mean wage (2) |
|---|---|---|---|---|---|
| Alaska | 310 | 0.99 | 3.13 | $ 37.09 | $ 77,150 |
| Maryland | 1,770 | 0.66 | 2.09 | $ 46.83 | $ 97,400 |
| Virginia | 2,500 | 0.63 | 1.99 | $ 44.00 | $ 91,510 |
| District of Columbia | 410 | 0.58 | 1.85 | $ 49.07 | $ 102,070 |
| Arizona | 1,770 | 0.57 | 1.79 | $ 27.90 | $ 58,030 |
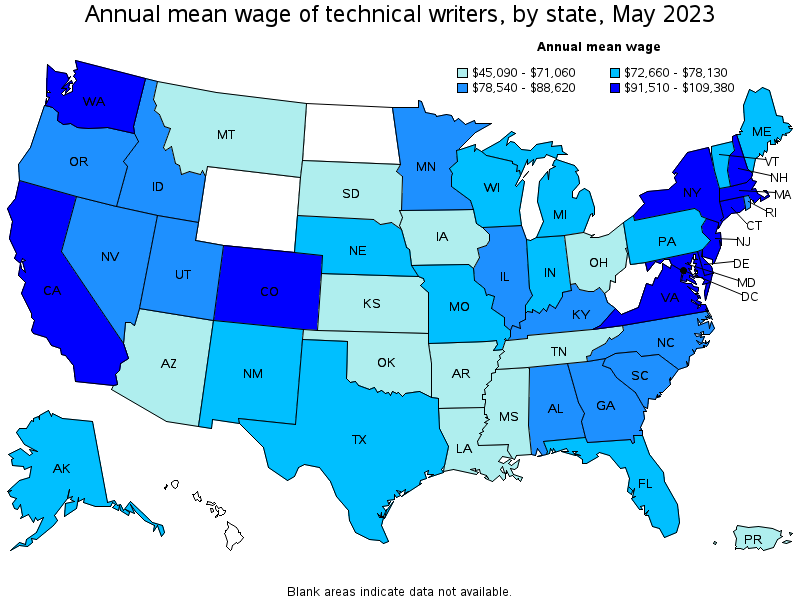
Top paying states for Technical Writers:
| State | Employment (1) | Employment per thousand jobs | Location quotient (9) | Hourly mean wage | Annual mean wage (2) |
|---|---|---|---|---|---|
| California | 5,990 | 0.33 | 1.06 | $ 52.59 | $ 109,380 |
| Delaware | 110 | 0.23 | 0.73 | $ 51.15 | $ 106,400 |
| Massachusetts | 1,980 | 0.54 | 1.72 | $ 50.46 | $ 104,960 |
| Washington | 1,490 | 0.43 | 1.35 | $ 50.21 | $ 104,440 |
| District of Columbia | 410 | 0.58 | 1.85 | $ 49.07 | $ 102,070 |
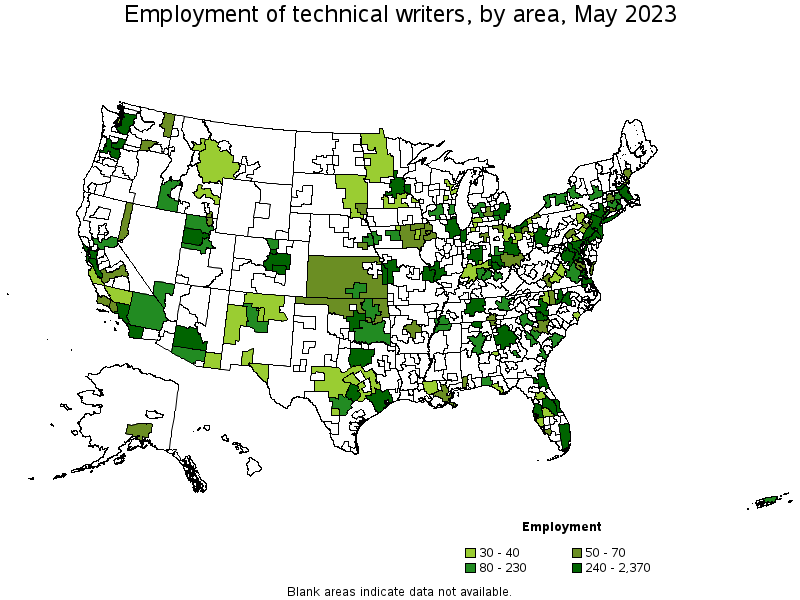
Metropolitan areas with the highest employment level in Technical Writers:
| Metropolitan area | Employment (1) | Employment per thousand jobs | Location quotient (9) | Hourly mean wage | Annual mean wage (2) |
|---|---|---|---|---|---|
| Washington-Arlington-Alexandria, DC-VA-MD-WV | 2,370 | 0.77 | 2.43 | $ 47.74 | $ 99,300 |
| New York-Newark-Jersey City, NY-NJ-PA | 2,200 | 0.23 | 0.73 | $ 45.77 | $ 95,200 |
| Boston-Cambridge-Nashua, MA-NH | 1,720 | 0.62 | 1.97 | $ 51.28 | $ 106,660 |
| Phoenix-Mesa-Scottsdale, AZ | 1,560 | 0.68 | 2.16 | (8) | (8) |
| Los Angeles-Long Beach-Anaheim, CA | 1,400 | 0.23 | 0.72 | $ 46.73 | $ 97,200 |
| San Francisco-Oakland-Hayward, CA | 1,310 | 0.54 | 1.71 | $ 62.85 | $ 130,730 |
| Dallas-Fort Worth-Arlington, TX | 1,160 | 0.29 | 0.92 | $ 37.49 | $ 77,980 |
| Seattle-Tacoma-Bellevue, WA | 1,100 | 0.53 | 1.68 | $ 52.57 | $ 109,340 |
| San Jose-Sunnyvale-Santa Clara, CA | 1,050 | 0.92 | 2.90 | $ 65.86 | $ 136,990 |
| Atlanta-Sandy Springs-Roswell, GA | 960 | 0.34 | 1.07 | $ 40.83 | $ 84,930 |
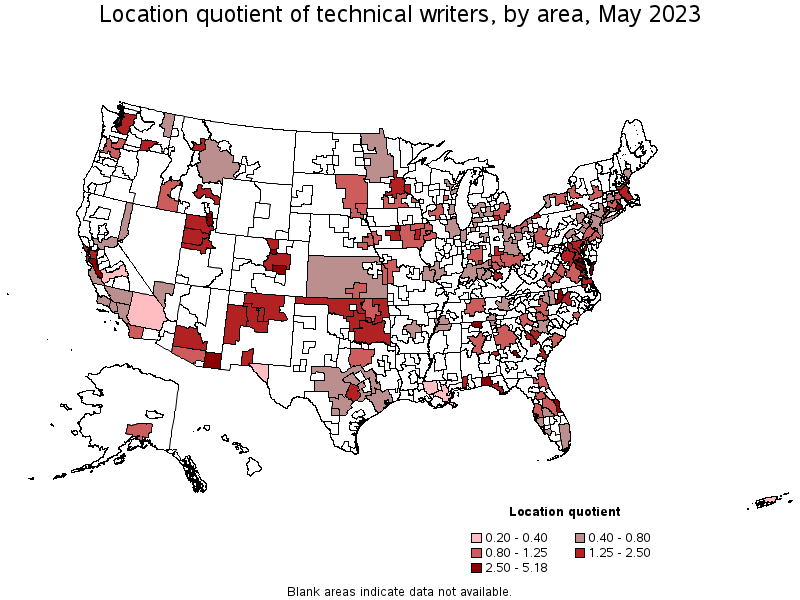
Metropolitan areas with the highest concentration of jobs and location quotients in Technical Writers:
| Metropolitan area | Employment (1) | Employment per thousand jobs | Location quotient (9) | Hourly mean wage | Annual mean wage (2) |
|---|---|---|---|---|---|
| California-Lexington Park, MD | 80 | 1.64 | 5.18 | $ 42.02 | $ 87,400 |
| Crestview-Fort Walton Beach-Destin, FL | 190 | 1.56 | 4.94 | $ 37.83 | $ 78,680 |
| Huntsville, AL | 360 | 1.44 | 4.55 | $ 40.11 | $ 83,420 |
| Warner Robins, GA | 110 | 1.39 | 4.41 | $ 30.51 | $ 63,460 |
| Boulder, CO | 240 | 1.25 | 3.96 | $ 49.47 | $ 102,910 |
| Palm Bay-Melbourne-Titusville, FL | 260 | 1.10 | 3.48 | $ 38.79 | $ 80,690 |
| Norwich-New London-Westerly, CT-RI | 130 | 1.05 | 3.33 | $ 41.50 | $ 86,310 |
| Sierra Vista-Douglas, AZ | 40 | 1.03 | 3.27 | $ 39.57 | $ 82,300 |
| Colorado Springs, CO | 300 | 0.95 | 3.02 | $ 37.27 | $ 77,510 |
| San Jose-Sunnyvale-Santa Clara, CA | 1,050 | 0.92 | 2.90 | $ 65.86 | $ 136,990 |
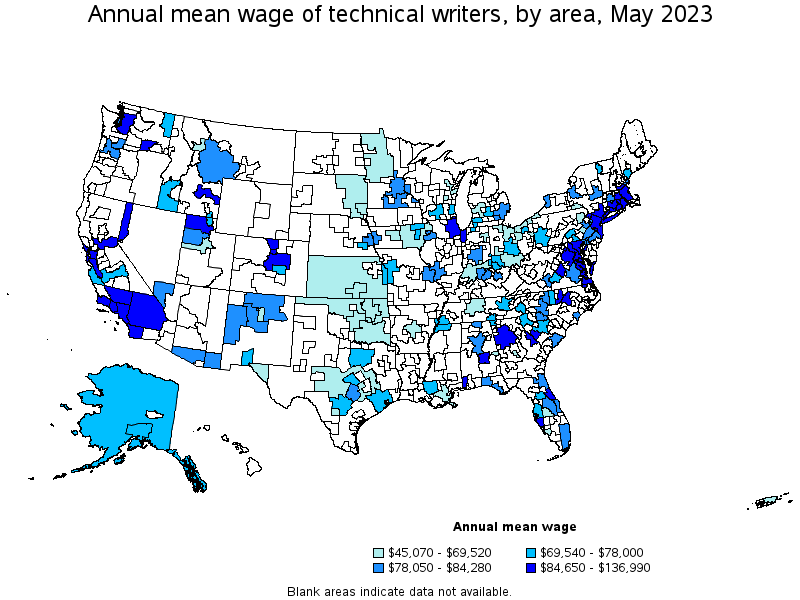
Top paying metropolitan areas for Technical Writers:
| Metropolitan area | Employment (1) | Employment per thousand jobs | Location quotient (9) | Hourly mean wage | Annual mean wage (2) |
|---|---|---|---|---|---|
| San Jose-Sunnyvale-Santa Clara, CA | 1,050 | 0.92 | 2.90 | $ 65.86 | $ 136,990 |
| San Francisco-Oakland-Hayward, CA | 1,310 | 0.54 | 1.71 | $ 62.85 | $ 130,730 |
| Santa Maria-Santa Barbara, CA | 50 | 0.25 | 0.79 | $ 55.01 | $ 114,430 |
| Idaho Falls, ID | 40 | 0.55 | 1.74 | $ 54.18 | $ 112,690 |
| Seattle-Tacoma-Bellevue, WA | 1,100 | 0.53 | 1.68 | $ 52.57 | $ 109,340 |
| Boston-Cambridge-Nashua, MA-NH | 1,720 | 0.62 | 1.97 | $ 51.28 | $ 106,660 |
| Boulder, CO | 240 | 1.25 | 3.96 | $ 49.47 | $ 102,910 |
| Kennewick-Richland, WA | 70 | 0.58 | 1.85 | $ 49.23 | $ 102,400 |
| Durham-Chapel Hill, NC | 290 | 0.85 | 2.69 | $ 48.77 | $ 101,430 |
| San Diego-Carlsbad, CA | 580 | 0.38 | 1.21 | $ 47.91 | $ 99,640 |
Nonmetropolitan areas with the highest employment in Technical Writers:
| Nonmetropolitan area | Employment (1) | Employment per thousand jobs | Location quotient (9) | Hourly mean wage | Annual mean wage (2) |
|---|---|---|---|---|---|
| Southeast Oklahoma nonmetropolitan area | 80 | 0.46 | 1.45 | $ 27.28 | $ 56,740 |
| Kansas nonmetropolitan area | 70 | 0.18 | 0.56 | $ 28.57 | $ 59,420 |
| Southeast Iowa nonmetropolitan area | 70 | 0.31 | 0.98 | $ 32.35 | $ 67,280 |
| Northeast Oklahoma nonmetropolitan area | 60 | 0.51 | 1.63 | $ 30.21 | $ 62,850 |
| Southern Ohio nonmetropolitan area | 60 | 0.36 | 1.15 | $ 27.53 | $ 57,260 |
Nonmetropolitan areas with the highest concentration of jobs and location quotients in Technical Writers:
| Nonmetropolitan area | Employment (1) | Employment per thousand jobs | Location quotient (9) | Hourly mean wage | Annual mean wage (2) |
|---|---|---|---|---|---|
| Northeast Virginia nonmetropolitan area | 50 | 0.94 | 2.97 | $ 42.27 | $ 87,920 |
| Northeast Oklahoma nonmetropolitan area | 60 | 0.51 | 1.63 | $ 30.21 | $ 62,850 |
| Northwest Oklahoma nonmetropolitan area | 50 | 0.50 | 1.57 | $ 28.14 | $ 58,530 |
| Southeast Oklahoma nonmetropolitan area | 80 | 0.46 | 1.45 | $ 27.28 | $ 56,740 |
| Northern New Mexico nonmetropolitan area | 30 | 0.40 | 1.26 | $ 37.96 | $ 78,960 |
Top paying nonmetropolitan areas for Technical Writers:
| Nonmetropolitan area | Employment (1) | Employment per thousand jobs | Location quotient (9) | Hourly mean wage | Annual mean wage (2) |
|---|---|---|---|---|---|
| Northeast Virginia nonmetropolitan area | 50 | 0.94 | 2.97 | $ 42.27 | $ 87,920 |
| Southeast Minnesota nonmetropolitan area | 40 | 0.29 | 0.92 | $ 38.21 | $ 79,480 |
| Southwest Montana nonmetropolitan area | 40 | 0.24 | 0.76 | $ 38.00 | $ 79,050 |
| Northern New Mexico nonmetropolitan area | 30 | 0.40 | 1.26 | $ 37.96 | $ 78,960 |
| Alaska nonmetropolitan area | (8) | (8) | (8) | $ 36.95 | $ 76,860 |
These estimates are calculated with data collected from employers in all industry sectors, all metropolitan and nonmetropolitan areas, and all states and the District of Columbia. The top employment and wage figures are provided above. The complete list is available in the downloadable XLS files.
The percentile wage estimate is the value of a wage below which a certain percent of workers fall. The median wage is the 50th percentile wage estimate—50 percent of workers earn less than the median and 50 percent of workers earn more than the median. More about percentile wages.
(1) Estimates for detailed occupations do not sum to the totals because the totals include occupations not shown separately. Estimates do not include self-employed workers.
(2) Annual wages have been calculated by multiplying the hourly mean wage by a "year-round, full-time" hours figure of 2,080 hours; for those occupations where there is not an hourly wage published, the annual wage has been directly calculated from the reported survey data.
(3) The relative standard error (RSE) is a measure of the reliability of a survey statistic. The smaller the relative standard error, the more precise the estimate.
(8) Estimate not released.
(9) The location quotient is the ratio of the area concentration of occupational employment to the national average concentration. A location quotient greater than one indicates the occupation has a higher share of employment than average, and a location quotient less than one indicates the occupation is less prevalent in the area than average.
Other OEWS estimates and related information:
May 2023 National Occupational Employment and Wage Estimates
May 2023 State Occupational Employment and Wage Estimates
May 2023 Metropolitan and Nonmetropolitan Area Occupational Employment and Wage Estimates
May 2023 National Industry-Specific Occupational Employment and Wage Estimates
Last Modified Date: April 3, 2024