
An official website of the United States government
An official website of the United States government
The .gov means it's official.
Federal government websites often end in .gov or .mil. Before sharing sensitive information,
make sure you're on a federal government site.
The site is secure.
The
https:// ensures that you are connecting to the official website and that any
information you provide is encrypted and transmitted securely.
Originate and prepare written material, such as scripts, stories, advertisements, and other material. Excludes �News Analysts, Reporters, and Journalists� (27-3023), �Public Relations Specialists� (27-3031), and �Technical Writers� (27-3042).
Employment estimate and mean wage estimates for Writers and Authors:
| Employment (1) | Employment RSE (3) |
Mean hourly wage |
Mean annual wage (2) |
Wage RSE (3) |
|---|---|---|---|---|
| 49,450 | 8.2 % | $ 42.11 | $ 87,590 | 1.8 % |
Percentile wage estimates for Writers and Authors:
| Percentile | 10% | 25% | 50% (Median) |
75% | 90% |
|---|---|---|---|---|---|
| Hourly Wage | $ 19.67 | $ 25.32 | $ 35.43 | $ 48.55 | $ 71.27 |
| Annual Wage (2) | $ 40,900 | $ 52,660 | $ 73,690 | $ 100,990 | $ 148,240 |
Industries with the highest published employment and wages for Writers and Authors are provided. For a list of all industries with employment in Writers and Authors, see the Create Customized Tables function.
Industries with the highest levels of employment in Writers and Authors:
| Industry | Employment (1) | Percent of industry employment | Hourly mean wage | Annual mean wage (2) |
|---|---|---|---|---|
| Advertising, Public Relations, and Related Services | 6,560 | 1.31 | $ 38.08 | $ 79,200 |
| Independent Artists, Writers, and Performers | 5,250 | 8.15 | $ 52.22 | $ 108,620 |
| Newspaper, Periodical, Book, and Directory Publishers | 4,830 | 1.65 | $ 35.45 | $ 73,740 |
| Management, Scientific, and Technical Consulting Services | 4,030 | 0.22 | $ 37.54 | $ 78,080 |
| Motion Picture and Video Industries | 2,820 | 0.70 | $ 62.47 | $ 129,930 |
Industries with the highest concentration of employment in Writers and Authors:
| Industry | Employment (1) | Percent of industry employment | Hourly mean wage | Annual mean wage (2) |
|---|---|---|---|---|
| Independent Artists, Writers, and Performers | 5,250 | 8.15 | $ 52.22 | $ 108,620 |
| Newspaper, Periodical, Book, and Directory Publishers | 4,830 | 1.65 | $ 35.45 | $ 73,740 |
| Advertising, Public Relations, and Related Services | 6,560 | 1.31 | $ 38.08 | $ 79,200 |
| Media Streaming Distribution Services, Social Networks, and Other Media Networks and Content Providers | 2,730 | 1.17 | $ 57.29 | $ 119,150 |
| Agents and Managers for Artists, Athletes, Entertainers, and Other Public Figures | 260 | 0.84 | $ 61.92 | $ 128,790 |
Top paying industries for Writers and Authors:
| Industry | Employment (1) | Percent of industry employment | Hourly mean wage | Annual mean wage (2) |
|---|---|---|---|---|
| Motion Picture and Video Industries | 2,820 | 0.70 | $ 62.47 | $ 129,930 |
| Agents and Managers for Artists, Athletes, Entertainers, and Other Public Figures | 260 | 0.84 | $ 61.92 | $ 128,790 |
| Other Schools and Instruction | 100 | 0.02 | $ 59.08 | $ 122,880 |
| Media Streaming Distribution Services, Social Networks, and Other Media Networks and Content Providers | 2,730 | 1.17 | $ 57.29 | $ 119,150 |
| Medical Equipment and Supplies Manufacturing | 40 | 0.01 | $ 56.31 | $ 117,130 |
States and areas with the highest published employment, location quotients, and wages for Writers and Authors are provided. For a list of all areas with employment in Writers and Authors, see the Create Customized Tables function.
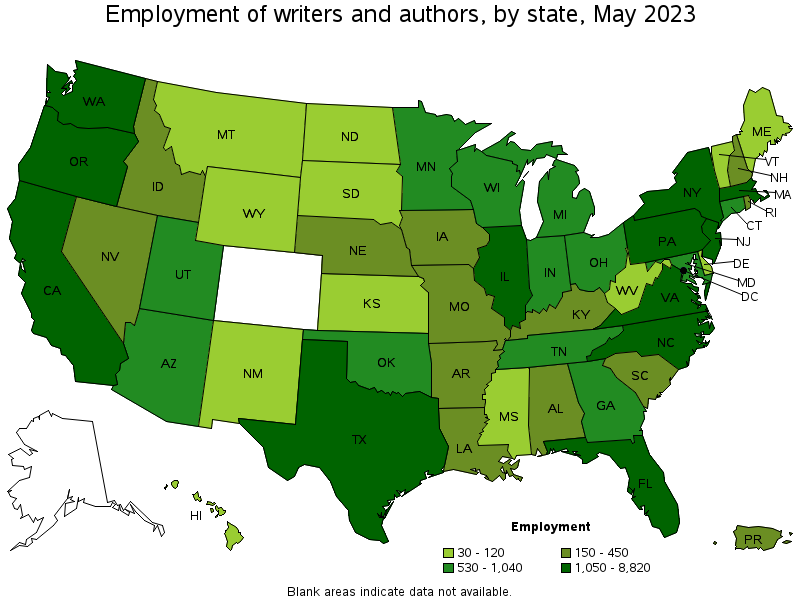
States with the highest employment level in Writers and Authors:
| State | Employment (1) | Employment per thousand jobs | Location quotient (9) | Hourly mean wage | Annual mean wage (2) |
|---|---|---|---|---|---|
| California | 8,820 | 0.49 | 1.51 | $ 52.23 | $ 108,640 |
| New York | 7,540 | 0.80 | 2.47 | $ 58.21 | $ 121,070 |
| Florida | 2,700 | 0.28 | 0.87 | $ 31.99 | $ 66,550 |
| Illinois | 2,390 | 0.40 | 1.22 | $ 33.48 | $ 69,630 |
| North Carolina | 2,300 | 0.48 | 1.47 | $ 32.74 | $ 68,100 |
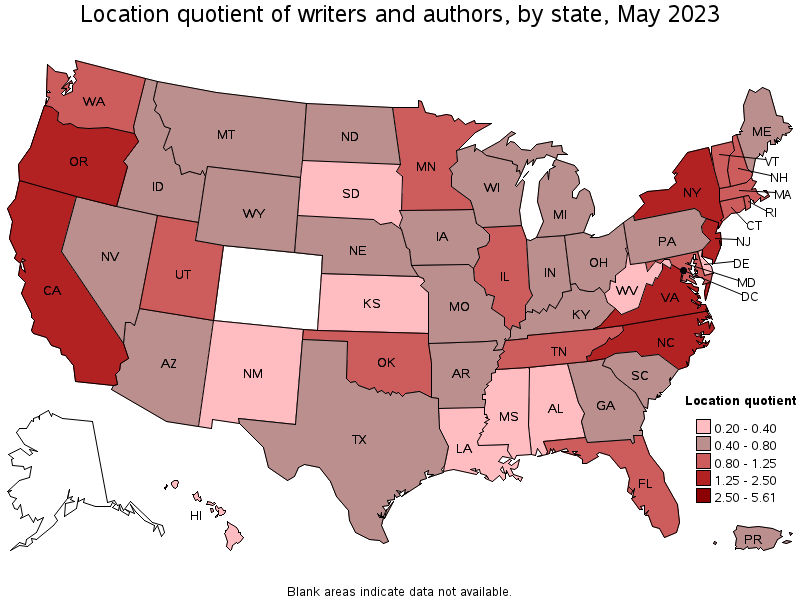
States with the highest concentration of jobs and location quotients in Writers and Authors:
| State | Employment (1) | Employment per thousand jobs | Location quotient (9) | Hourly mean wage | Annual mean wage (2) |
|---|---|---|---|---|---|
| District of Columbia | 1,280 | 1.83 | 5.61 | $ 50.53 | $ 105,100 |
| New York | 7,540 | 0.80 | 2.47 | $ 58.21 | $ 121,070 |
| Oregon | 1,050 | 0.54 | 1.66 | $ 41.09 | $ 85,460 |
| California | 8,820 | 0.49 | 1.51 | $ 52.23 | $ 108,640 |
| Virginia | 1,920 | 0.48 | 1.48 | $ 41.31 | $ 85,930 |
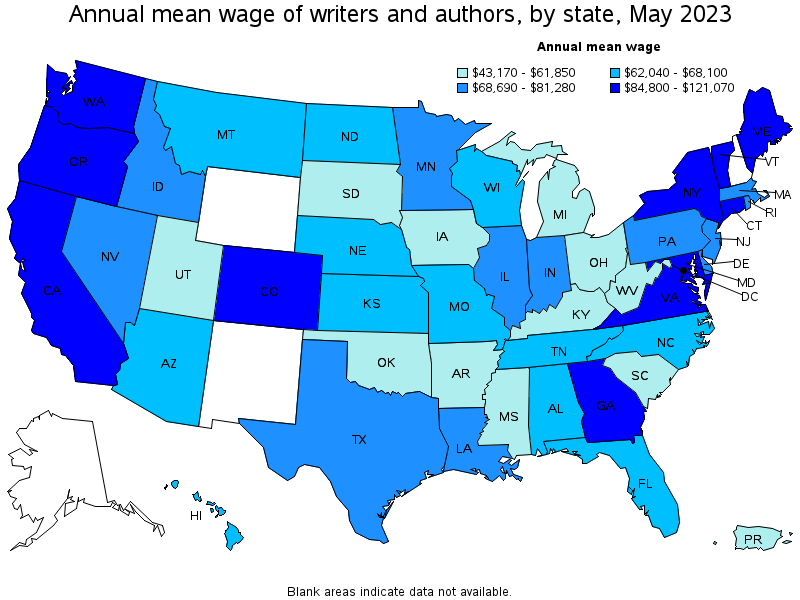
Top paying states for Writers and Authors:
| State | Employment (1) | Employment per thousand jobs | Location quotient (9) | Hourly mean wage | Annual mean wage (2) |
|---|---|---|---|---|---|
| New York | 7,540 | 0.80 | 2.47 | $ 58.21 | $ 121,070 |
| California | 8,820 | 0.49 | 1.51 | $ 52.23 | $ 108,640 |
| District of Columbia | 1,280 | 1.83 | 5.61 | $ 50.53 | $ 105,100 |
| Maine | 100 | 0.16 | 0.48 | $ 48.81 | $ 101,530 |
| Maryland | 740 | 0.28 | 0.85 | $ 47.25 | $ 98,280 |
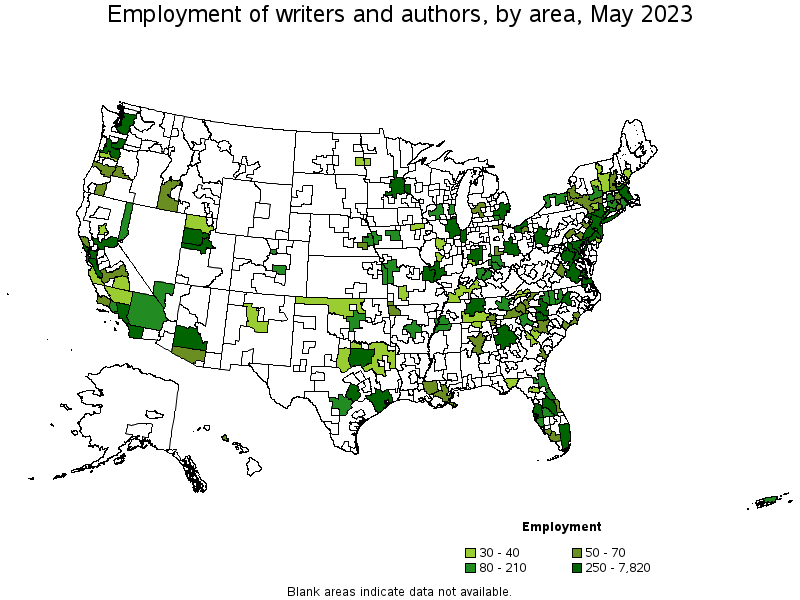
Metropolitan areas with the highest employment level in Writers and Authors:
| Metropolitan area | Employment (1) | Employment per thousand jobs | Location quotient (9) | Hourly mean wage | Annual mean wage (2) |
|---|---|---|---|---|---|
| New York-Newark-Jersey City, NY-NJ-PA | 7,820 | 0.82 | 2.53 | $ 55.79 | $ 116,030 |
| Los Angeles-Long Beach-Anaheim, CA | 4,580 | 0.74 | 2.27 | $ 57.37 | $ 119,320 |
| Washington-Arlington-Alexandria, DC-VA-MD-WV | 2,540 | 0.82 | 2.52 | $ 49.42 | $ 102,790 |
| Chicago-Naperville-Elgin, IL-IN-WI | 1,960 | 0.44 | 1.34 | $ 33.87 | $ 70,450 |
| San Francisco-Oakland-Hayward, CA | 1,530 | 0.63 | 1.94 | $ 54.61 | $ 113,580 |
| Boston-Cambridge-Nashua, MA-NH | 980 | 0.35 | 1.09 | $ 37.64 | $ 78,290 |
| Seattle-Tacoma-Bellevue, WA | 960 | 0.46 | 1.41 | $ 43.33 | $ 90,120 |
| Miami-Fort Lauderdale-West Palm Beach, FL | 830 | 0.30 | 0.93 | $ 30.40 | $ 63,240 |
| Philadelphia-Camden-Wilmington, PA-NJ-DE-MD | 760 | 0.27 | 0.83 | $ 37.25 | $ 77,480 |
| Minneapolis-St. Paul-Bloomington, MN-WI | 750 | 0.39 | 1.21 | $ 36.74 | $ 76,410 |
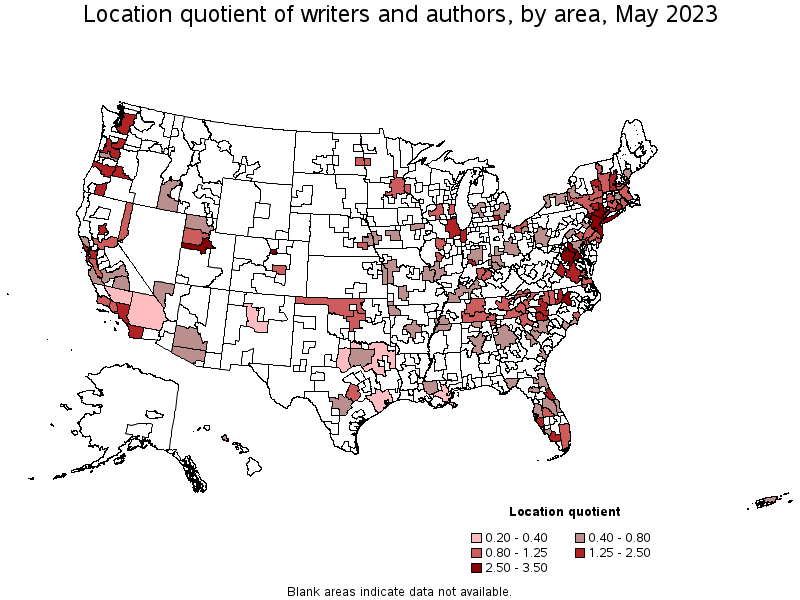
Metropolitan areas with the highest concentration of jobs and location quotients in Writers and Authors:
| Metropolitan area | Employment (1) | Employment per thousand jobs | Location quotient (9) | Hourly mean wage | Annual mean wage (2) |
|---|---|---|---|---|---|
| Boulder, CO | 180 | 0.95 | 2.92 | $ 48.14 | $ 100,140 |
| Provo-Orem, UT | 270 | 0.93 | 2.87 | $ 27.50 | $ 57,200 |
| Raleigh, NC | 600 | 0.85 | 2.61 | $ 35.08 | $ 72,970 |
| New York-Newark-Jersey City, NY-NJ-PA | 7,820 | 0.82 | 2.53 | $ 55.79 | $ 116,030 |
| Washington-Arlington-Alexandria, DC-VA-MD-WV | 2,540 | 0.82 | 2.52 | $ 49.42 | $ 102,790 |
| Bend-Redmond, OR | 70 | 0.74 | 2.29 | $ 37.96 | $ 78,950 |
| Los Angeles-Long Beach-Anaheim, CA | 4,580 | 0.74 | 2.27 | $ 57.37 | $ 119,320 |
| Ann Arbor, MI | 150 | 0.69 | 2.12 | $ 22.84 | $ 47,500 |
| Trenton, NJ | 150 | 0.65 | 1.99 | $ 38.74 | $ 80,590 |
| Kingston, NY | 40 | 0.65 | 1.99 | (8) | (8) |
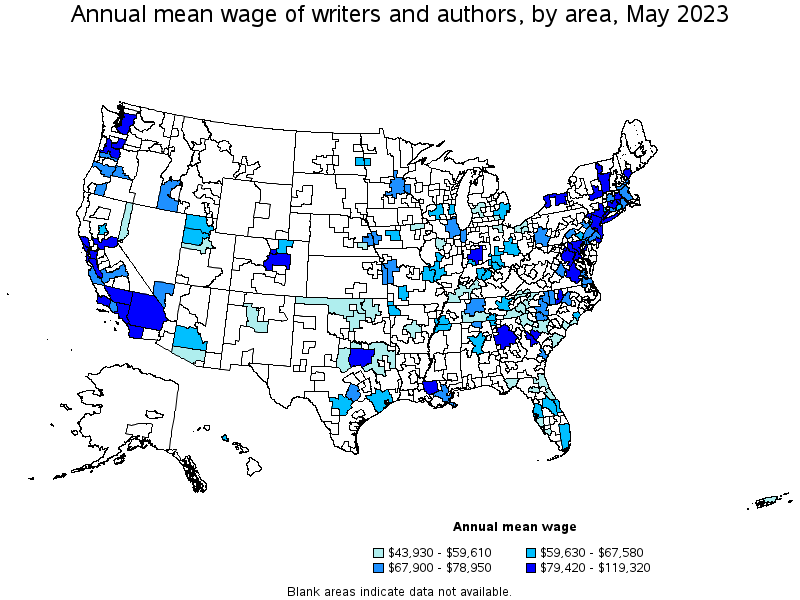
Top paying metropolitan areas for Writers and Authors:
| Metropolitan area | Employment (1) | Employment per thousand jobs | Location quotient (9) | Hourly mean wage | Annual mean wage (2) |
|---|---|---|---|---|---|
| Los Angeles-Long Beach-Anaheim, CA | 4,580 | 0.74 | 2.27 | $ 57.37 | $ 119,320 |
| New York-Newark-Jersey City, NY-NJ-PA | 7,820 | 0.82 | 2.53 | $ 55.79 | $ 116,030 |
| Augusta-Richmond County, GA-SC | 30 | 0.14 | 0.43 | $ 55.13 | $ 114,670 |
| San Francisco-Oakland-Hayward, CA | 1,530 | 0.63 | 1.94 | $ 54.61 | $ 113,580 |
| Portland-South Portland, ME | 30 | 0.17 | 0.51 | $ 52.81 | $ 109,840 |
| San Jose-Sunnyvale-Santa Clara, CA | 320 | 0.28 | 0.85 | $ 52.71 | $ 109,630 |
| Washington-Arlington-Alexandria, DC-VA-MD-WV | 2,540 | 0.82 | 2.52 | $ 49.42 | $ 102,790 |
| Baltimore-Columbia-Towson, MD | 320 | 0.24 | 0.75 | $ 49.14 | $ 102,210 |
| Atlanta-Sandy Springs-Roswell, GA | 630 | 0.22 | 0.69 | $ 49.00 | $ 101,920 |
| Hartford-West Hartford-East Hartford, CT | 150 | 0.27 | 0.82 | $ 48.22 | $ 100,290 |
Nonmetropolitan areas with the highest employment in Writers and Authors:
| Nonmetropolitan area | Employment (1) | Employment per thousand jobs | Location quotient (9) | Hourly mean wage | Annual mean wage (2) |
|---|---|---|---|---|---|
| Central East New York nonmetropolitan area | 50 | 0.35 | 1.07 | (8) | (8) |
| Mountain North Carolina nonmetropolitan area | 50 | 0.37 | 1.13 | $ 27.98 | $ 58,210 |
| West Central-Southwest New Hampshire nonmetropolitan area | 50 | 0.45 | 1.39 | (8) | (8) |
| South Central Tennessee nonmetropolitan area | 30 | 0.31 | 0.96 | $ 26.57 | $ 55,270 |
| Southern Vermont nonmetropolitan area | 30 | 0.34 | 1.05 | $ 42.54 | $ 88,470 |
Nonmetropolitan areas with the highest concentration of jobs and location quotients in Writers and Authors:
| Nonmetropolitan area | Employment (1) | Employment per thousand jobs | Location quotient (9) | Hourly mean wage | Annual mean wage (2) |
|---|---|---|---|---|---|
| West Central-Southwest New Hampshire nonmetropolitan area | 50 | 0.45 | 1.39 | (8) | (8) |
| Mountain North Carolina nonmetropolitan area | 50 | 0.37 | 1.13 | $ 27.98 | $ 58,210 |
| Central East New York nonmetropolitan area | 50 | 0.35 | 1.07 | (8) | (8) |
| Southern Vermont nonmetropolitan area | 30 | 0.34 | 1.05 | $ 42.54 | $ 88,470 |
| South Central Tennessee nonmetropolitan area | 30 | 0.31 | 0.96 | $ 26.57 | $ 55,270 |
Top paying nonmetropolitan areas for Writers and Authors:
| Nonmetropolitan area | Employment (1) | Employment per thousand jobs | Location quotient (9) | Hourly mean wage | Annual mean wage (2) |
|---|---|---|---|---|---|
| Southern Vermont nonmetropolitan area | 30 | 0.34 | 1.05 | $ 42.54 | $ 88,470 |
| Mountain North Carolina nonmetropolitan area | 50 | 0.37 | 1.13 | $ 27.98 | $ 58,210 |
| South Central Tennessee nonmetropolitan area | 30 | 0.31 | 0.96 | $ 26.57 | $ 55,270 |
| Northwest Oklahoma nonmetropolitan area | 30 | 0.31 | 0.96 | $ 26.01 | $ 54,110 |
| West Kentucky nonmetropolitan area | 30 | 0.20 | 0.62 | $ 24.96 | $ 51,930 |
These estimates are calculated with data collected from employers in all industry sectors, all metropolitan and nonmetropolitan areas, and all states and the District of Columbia. The top employment and wage figures are provided above. The complete list is available in the downloadable XLS files.
The percentile wage estimate is the value of a wage below which a certain percent of workers fall. The median wage is the 50th percentile wage estimate—50 percent of workers earn less than the median and 50 percent of workers earn more than the median. More about percentile wages.
(1) Estimates for detailed occupations do not sum to the totals because the totals include occupations not shown separately. Estimates do not include self-employed workers.
(2) Annual wages have been calculated by multiplying the hourly mean wage by a "year-round, full-time" hours figure of 2,080 hours; for those occupations where there is not an hourly wage published, the annual wage has been directly calculated from the reported survey data.
(3) The relative standard error (RSE) is a measure of the reliability of a survey statistic. The smaller the relative standard error, the more precise the estimate.
(8) Estimate not released.
(9) The location quotient is the ratio of the area concentration of occupational employment to the national average concentration. A location quotient greater than one indicates the occupation has a higher share of employment than average, and a location quotient less than one indicates the occupation is less prevalent in the area than average.
Other OEWS estimates and related information:
May 2023 National Occupational Employment and Wage Estimates
May 2023 State Occupational Employment and Wage Estimates
May 2023 Metropolitan and Nonmetropolitan Area Occupational Employment and Wage Estimates
May 2023 National Industry-Specific Occupational Employment and Wage Estimates
Last Modified Date: April 3, 2024