
An official website of the United States government
An official website of the United States government
The .gov means it's official.
Federal government websites often end in .gov or .mil. Before sharing sensitive information,
make sure you're on a federal government site.
The site is secure.
The
https:// ensures that you are connecting to the official website and that any
information you provide is encrypted and transmitted securely.
Diagnose and treat diseases relating to the skin, hair, and nails. May perform both medical and dermatological surgery functions.
Employment estimate and mean wage estimates for Dermatologists:
| Employment (1) | Employment RSE (3) |
Mean hourly wage |
Mean annual wage (2) |
Wage RSE (3) |
|---|---|---|---|---|
| 12,040 | 7.8 % | $ 164.84 | $ 342,860 | 5.7 % |
Percentile wage estimates for Dermatologists:
| Percentile | 10% | 25% | 50% (Median) |
75% | 90% |
|---|---|---|---|---|---|
| Hourly Wage | $ 49.52 | $ 86.90 | (5) | (5) | (5) |
| Annual Wage (2) | $ 103,000 | $ 180,750 | (5) | (5) | (5) |
Industries with the highest published employment and wages for Dermatologists are provided. For a list of all industries with employment in Dermatologists, see the Create Customized Tables function.
Industries with the highest levels of employment in Dermatologists:
| Industry | Employment (1) | Percent of industry employment | Hourly mean wage | Annual mean wage (2) |
|---|---|---|---|---|
| Offices of Physicians | 11,020 | 0.39 | $ 167.08 | $ 347,530 |
| Outpatient Care Centers | 200 | 0.02 | $ 221.38 | $ 460,470 |
| Merchant Wholesalers, Nondurable Goods (4242 and 4246 only) | 100 | 0.02 | $ 82.93 | $ 172,500 |
| Colleges, Universities, and Professional Schools | 70 | 0.00 | $ 56.46 | $ 117,440 |
| Personal Care Services | 70 | 0.01 | $ 70.65 | $ 146,940 |
Industries with the highest concentration of employment in Dermatologists:
| Industry | Employment (1) | Percent of industry employment | Hourly mean wage | Annual mean wage (2) |
|---|---|---|---|---|
| Offices of Physicians | 11,020 | 0.39 | $ 167.08 | $ 347,530 |
| Merchant Wholesalers, Nondurable Goods (4242 and 4246 only) | 100 | 0.02 | $ 82.93 | $ 172,500 |
| Outpatient Care Centers | 200 | 0.02 | $ 221.38 | $ 460,470 |
| Personal Care Services | 70 | 0.01 | $ 70.65 | $ 146,940 |
| Colleges, Universities, and Professional Schools | 70 | 0.00 | $ 56.46 | $ 117,440 |
Top paying industries for Dermatologists:
| Industry | Employment (1) | Percent of industry employment | Hourly mean wage | Annual mean wage (2) |
|---|---|---|---|---|
| Outpatient Care Centers | 200 | 0.02 | $ 221.38 | $ 460,470 |
| Offices of Physicians | 11,020 | 0.39 | $ 167.08 | $ 347,530 |
| General Medical and Surgical Hospitals | (8) | (8) | $ 145.64 | $ 302,940 |
| Merchant Wholesalers, Nondurable Goods (4242 and 4246 only) | 100 | 0.02 | $ 82.93 | $ 172,500 |
| Personal Care Services | 70 | 0.01 | $ 70.65 | $ 146,940 |
States and areas with the highest published employment, location quotients, and wages for Dermatologists are provided. For a list of all areas with employment in Dermatologists, see the Create Customized Tables function.
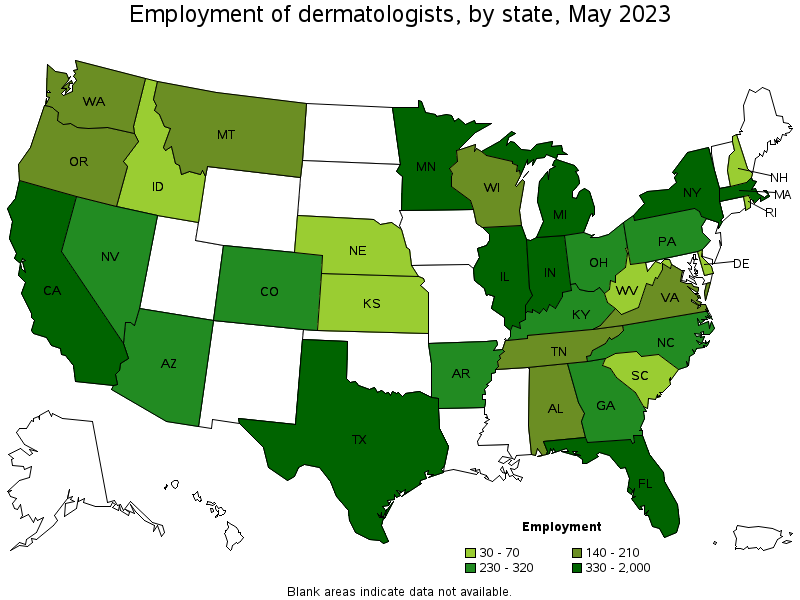
States with the highest employment level in Dermatologists:
| State | Employment (1) | Employment per thousand jobs | Location quotient (9) | Hourly mean wage | Annual mean wage (2) |
|---|---|---|---|---|---|
| Florida | 2,000 | 0.21 | 2.63 | (8) | (8) |
| New York | 1,180 | 0.13 | 1.58 | $ 146.71 | $ 305,150 |
| Texas | 730 | 0.05 | 0.68 | $ 132.75 | $ 276,120 |
| California | 700 | 0.04 | 0.49 | $ 150.64 | $ 313,330 |
| Massachusetts | 630 | 0.17 | 2.20 | (8) | (8) |
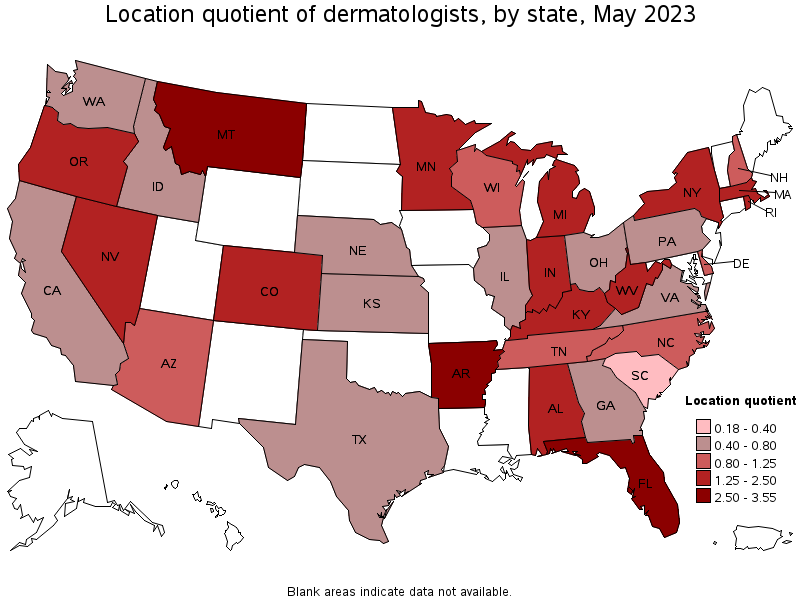
States with the highest concentration of jobs and location quotients in Dermatologists:
| State | Employment (1) | Employment per thousand jobs | Location quotient (9) | Hourly mean wage | Annual mean wage (2) |
|---|---|---|---|---|---|
| Montana | 140 | 0.28 | 3.55 | $ 197.48 | $ 410,750 |
| Florida | 2,000 | 0.21 | 2.63 | (8) | (8) |
| Arkansas | 260 | 0.21 | 2.59 | $ 153.16 | $ 318,560 |
| Massachusetts | 630 | 0.17 | 2.20 | (8) | (8) |
| Nevada | 230 | 0.15 | 1.94 | $ 158.25 | $ 329,160 |
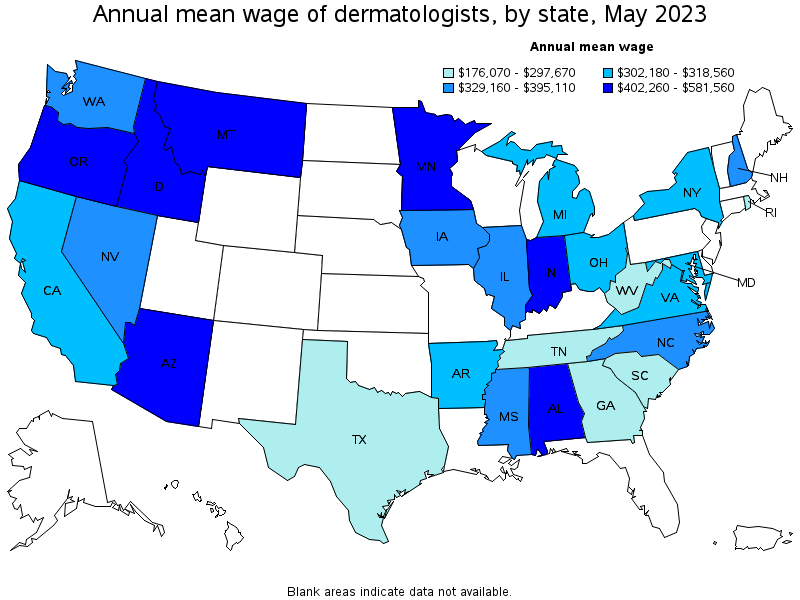
Top paying states for Dermatologists:
| State | Employment (1) | Employment per thousand jobs | Location quotient (9) | Hourly mean wage | Annual mean wage (2) |
|---|---|---|---|---|---|
| Hawaii | (8) | (8) | (8) | (5) | (5) |
| Pennsylvania | 320 | 0.05 | 0.68 | (5) | (5) |
| Wisconsin | 210 | 0.07 | 0.94 | (5) | (5) |
| Minnesota | 420 | 0.15 | 1.83 | $ 279.59 | $ 581,560 |
| Idaho | 50 | 0.06 | 0.76 | $ 252.42 | $ 525,040 |
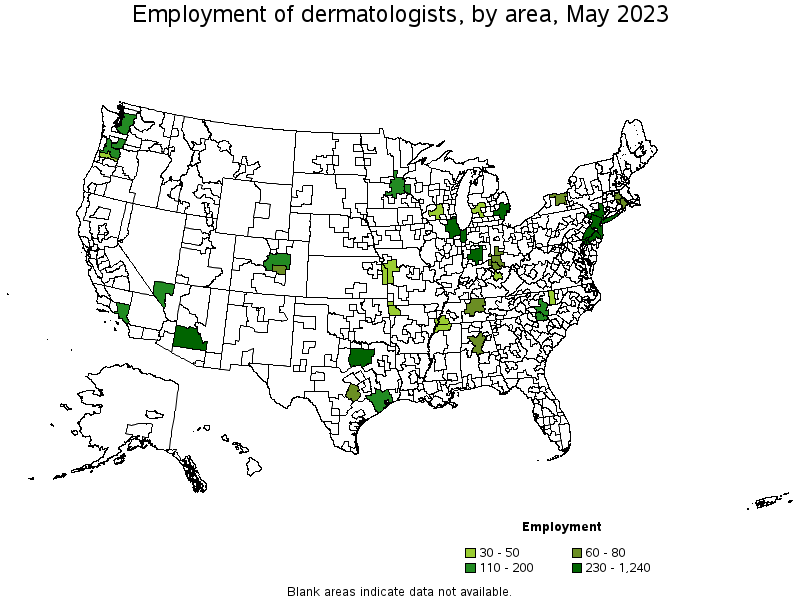
Metropolitan areas with the highest employment level in Dermatologists:
| Metropolitan area | Employment (1) | Employment per thousand jobs | Location quotient (9) | Hourly mean wage | Annual mean wage (2) |
|---|---|---|---|---|---|
| New York-Newark-Jersey City, NY-NJ-PA | 1,240 | 0.13 | 1.64 | $ 144.21 | $ 299,960 |
| Dallas-Fort Worth-Arlington, TX | 360 | 0.09 | 1.14 | (8) | (8) |
| Detroit-Warren-Dearborn, MI | 330 | 0.18 | 2.22 | $ 151.94 | $ 316,040 |
| Chicago-Naperville-Elgin, IL-IN-WI | 300 | 0.07 | 0.84 | $ 168.24 | $ 349,940 |
| Philadelphia-Camden-Wilmington, PA-NJ-DE-MD | 280 | 0.10 | 1.25 | (5) | (5) |
| Phoenix-Mesa-Scottsdale, AZ | 230 | 0.10 | 1.28 | $ 211.51 | $ 439,940 |
| Indianapolis-Carmel-Anderson, IN | 230 | 0.21 | 2.64 | $ 200.01 | $ 416,020 |
| Minneapolis-St. Paul-Bloomington, MN-WI | 200 | 0.10 | 1.32 | (5) | (5) |
| Las Vegas-Henderson-Paradise, NV | 200 | 0.18 | 2.29 | $ 156.66 | $ 325,860 |
| Houston-The Woodlands-Sugar Land, TX | 180 | 0.06 | 0.70 | $ 149.81 | $ 311,600 |
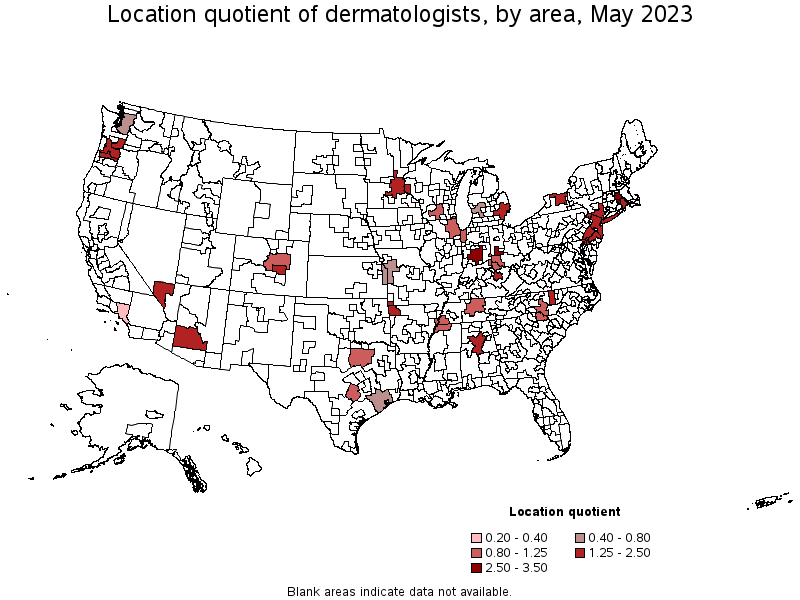
Metropolitan areas with the highest concentration of jobs and location quotients in Dermatologists:
| Metropolitan area | Employment (1) | Employment per thousand jobs | Location quotient (9) | Hourly mean wage | Annual mean wage (2) |
|---|---|---|---|---|---|
| Dayton, OH | 80 | 0.21 | 2.67 | (8) | (8) |
| Indianapolis-Carmel-Anderson, IN | 230 | 0.21 | 2.64 | $ 200.01 | $ 416,020 |
| Worcester, MA-CT | 60 | 0.20 | 2.58 | $ 160.48 | $ 333,800 |
| Salem, OR | 40 | 0.20 | 2.47 | $ 176.55 | $ 367,230 |
| Colorado Springs, CO | 60 | 0.19 | 2.37 | (8) | (8) |
| Las Vegas-Henderson-Paradise, NV | 200 | 0.18 | 2.29 | $ 156.66 | $ 325,860 |
| Detroit-Warren-Dearborn, MI | 330 | 0.18 | 2.22 | $ 151.94 | $ 316,040 |
| Lexington-Fayette, KY | 40 | 0.16 | 2.02 | (8) | (8) |
| Rochester, NY | 70 | 0.14 | 1.74 | (8) | (8) |
| Fayetteville-Springdale-Rogers, AR-MO | 40 | 0.14 | 1.71 | $ 213.91 | $ 444,940 |
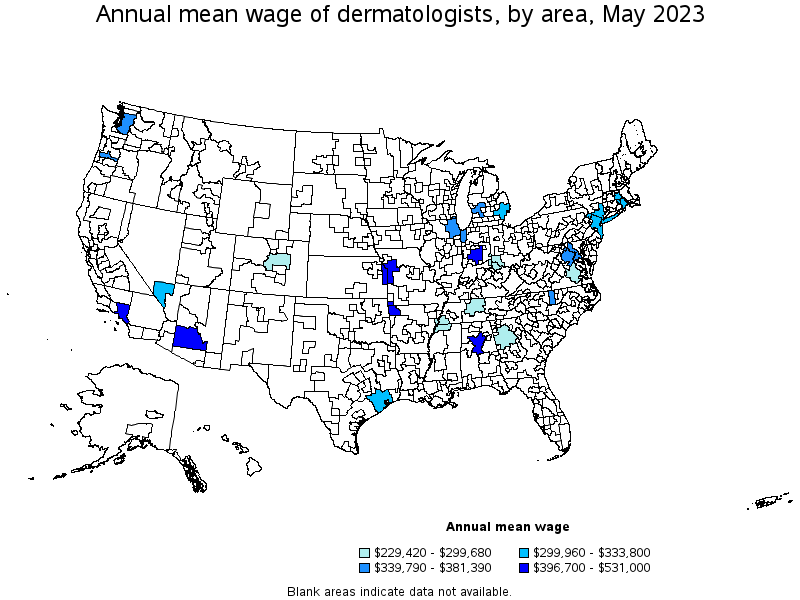
Top paying metropolitan areas for Dermatologists:
| Metropolitan area | Employment (1) | Employment per thousand jobs | Location quotient (9) | Hourly mean wage | Annual mean wage (2) |
|---|---|---|---|---|---|
| Charlotte-Concord-Gastonia, NC-SC | 110 | 0.09 | 1.08 | (5) | (5) |
| Gulfport-Biloxi-Pascagoula, MS | (8) | (8) | (8) | (5) | (5) |
| Minneapolis-St. Paul-Bloomington, MN-WI | 200 | 0.10 | 1.32 | (5) | (5) |
| Philadelphia-Camden-Wilmington, PA-NJ-DE-MD | 280 | 0.10 | 1.25 | (5) | (5) |
| Portland-Vancouver-Hillsboro, OR-WA | 140 | 0.11 | 1.43 | (5) | (5) |
| Urban Honolulu, HI | (8) | (8) | (8) | (5) | (5) |
| Kansas City, MO-KS | 50 | 0.04 | 0.55 | $ 255.29 | $ 531,000 |
| Fayetteville-Springdale-Rogers, AR-MO | 40 | 0.14 | 1.71 | $ 213.91 | $ 444,940 |
| Phoenix-Mesa-Scottsdale, AZ | 230 | 0.10 | 1.28 | $ 211.51 | $ 439,940 |
| Birmingham-Hoover, AL | 60 | 0.11 | 1.37 | $ 210.19 | $ 437,200 |
These estimates are calculated with data collected from employers in all industry sectors, all metropolitan and nonmetropolitan areas, and all states and the District of Columbia. The top employment and wage figures are provided above. The complete list is available in the downloadable XLS files.
The percentile wage estimate is the value of a wage below which a certain percent of workers fall. The median wage is the 50th percentile wage estimate—50 percent of workers earn less than the median and 50 percent of workers earn more than the median. More about percentile wages.
(1) Estimates for detailed occupations do not sum to the totals because the totals include occupations not shown separately. Estimates do not include self-employed workers.
(2) Annual wages have been calculated by multiplying the hourly mean wage by a "year-round, full-time" hours figure of 2,080 hours; for those occupations where there is not an hourly wage published, the annual wage has been directly calculated from the reported survey data.
(3) The relative standard error (RSE) is a measure of the reliability of a survey statistic. The smaller the relative standard error, the more precise the estimate.
(5) This wage is equal to or greater than $115.00 per hour or $239,200 per year.
(8) Estimate not released.
(9) The location quotient is the ratio of the area concentration of occupational employment to the national average concentration. A location quotient greater than one indicates the occupation has a higher share of employment than average, and a location quotient less than one indicates the occupation is less prevalent in the area than average.
Other OEWS estimates and related information:
May 2023 National Occupational Employment and Wage Estimates
May 2023 State Occupational Employment and Wage Estimates
May 2023 Metropolitan and Nonmetropolitan Area Occupational Employment and Wage Estimates
May 2023 National Industry-Specific Occupational Employment and Wage Estimates
Last Modified Date: April 3, 2024