
An official website of the United States government
An official website of the United States government
The .gov means it's official.
Federal government websites often end in .gov or .mil. Before sharing sensitive information,
make sure you're on a federal government site.
The site is secure.
The
https:// ensures that you are connecting to the official website and that any
information you provide is encrypted and transmitted securely.
Coordinate activities in resident facilities in secondary school and college dormitories, group homes, or similar establishments. Order supplies and determine need for maintenance, repairs, and furnishings. May maintain household records and assign rooms. May assist residents with problem solving or refer them to counseling resources.
Employment estimate and mean wage estimates for Residential Advisors:
| Employment (1) | Employment RSE (3) |
Mean hourly wage |
Mean annual wage (2) |
Wage RSE (3) |
|---|---|---|---|---|
| 88,700 | 2.8 % | $ 19.33 | $ 40,200 | 0.5 % |
Percentile wage estimates for Residential Advisors:
| Percentile | 10% | 25% | 50% (Median) |
75% | 90% |
|---|---|---|---|---|---|
| Hourly Wage | $ 13.23 | $ 15.63 | $ 18.25 | $ 22.26 | $ 26.75 |
| Annual Wage (2) | $ 27,520 | $ 32,510 | $ 37,950 | $ 46,310 | $ 55,640 |
Industries with the highest published employment and wages for Residential Advisors are provided. For a list of all industries with employment in Residential Advisors, see the Create Customized Tables function.
Industries with the highest levels of employment in Residential Advisors:
| Industry | Employment (1) | Percent of industry employment | Hourly mean wage | Annual mean wage (2) |
|---|---|---|---|---|
| Residential Intellectual and Developmental Disability, Mental Health, and Substance Abuse Facilities | 21,260 | 3.41 | $ 19.24 | $ 40,020 |
| Community Food and Housing, and Emergency and Other Relief Services | 12,350 | 5.71 | $ 18.56 | $ 38,590 |
| Other Residential Care Facilities | 10,580 | 6.88 | $ 18.62 | $ 38,730 |
| Colleges, Universities, and Professional Schools | 9,970 | 0.32 | $ 19.67 | $ 40,920 |
| Individual and Family Services | 8,310 | 0.28 | $ 19.84 | $ 41,270 |
Industries with the highest concentration of employment in Residential Advisors:
| Industry | Employment (1) | Percent of industry employment | Hourly mean wage | Annual mean wage (2) |
|---|---|---|---|---|
| Rooming and Boarding Houses, Dormitories, and Workers' Camps | 1,310 | 13.19 | $ 19.90 | $ 41,390 |
| Other Residential Care Facilities | 10,580 | 6.88 | $ 18.62 | $ 38,730 |
| Community Food and Housing, and Emergency and Other Relief Services | 12,350 | 5.71 | $ 18.56 | $ 38,590 |
| Residential Intellectual and Developmental Disability, Mental Health, and Substance Abuse Facilities | 21,260 | 3.41 | $ 19.24 | $ 40,020 |
| Vocational Rehabilitation Services | 3,500 | 1.26 | $ 19.22 | $ 39,980 |
Top paying industries for Residential Advisors:
| Industry | Employment (1) | Percent of industry employment | Hourly mean wage | Annual mean wage (2) |
|---|---|---|---|---|
| Local Government, excluding Schools and Hospitals (OEWS Designation) | 2,050 | 0.04 | $ 25.68 | $ 53,400 |
| General Medical and Surgical Hospitals | 150 | (7) | $ 24.36 | $ 50,660 |
| Grantmaking and Giving Services | 100 | 0.06 | $ 22.67 | $ 47,150 |
| Management of Companies and Enterprises | 410 | 0.01 | $ 22.67 | $ 47,140 |
| Religious Organizations | (8) | (8) | $ 22.54 | $ 46,870 |
States and areas with the highest published employment, location quotients, and wages for Residential Advisors are provided. For a list of all areas with employment in Residential Advisors, see the Create Customized Tables function.
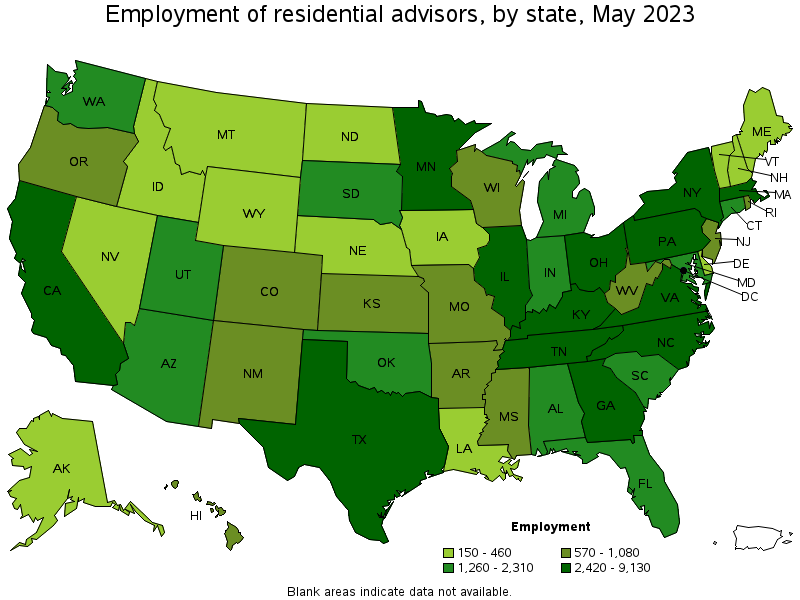
States with the highest employment level in Residential Advisors:
| State | Employment (1) | Employment per thousand jobs | Location quotient (9) | Hourly mean wage | Annual mean wage (2) |
|---|---|---|---|---|---|
| California | 9,130 | 0.51 | 0.87 | $ 22.94 | $ 47,720 |
| New York | 5,630 | 0.60 | 1.03 | $ 21.73 | $ 45,190 |
| Pennsylvania | 5,580 | 0.94 | 1.61 | $ 18.58 | $ 38,640 |
| Massachusetts | 4,720 | 1.29 | 2.22 | $ 22.88 | $ 47,580 |
| Ohio | 4,080 | 0.75 | 1.28 | $ 16.88 | $ 35,100 |
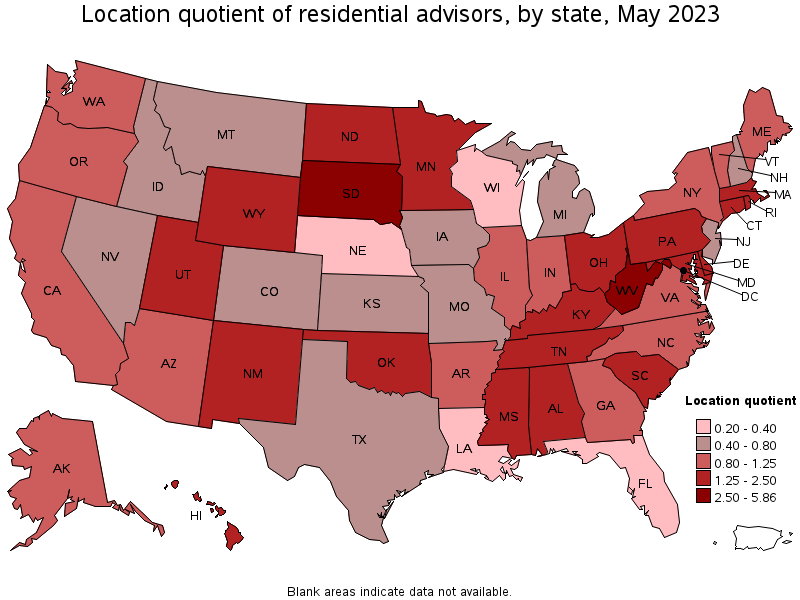
States with the highest concentration of jobs and location quotients in Residential Advisors:
| State | Employment (1) | Employment per thousand jobs | Location quotient (9) | Hourly mean wage | Annual mean wage (2) |
|---|---|---|---|---|---|
| South Dakota | 1,520 | 3.42 | 5.86 | $ 16.85 | $ 35,050 |
| West Virginia | 1,080 | 1.57 | 2.69 | $ 14.85 | $ 30,880 |
| District of Columbia | 930 | 1.32 | 2.26 | $ 22.11 | $ 45,980 |
| Massachusetts | 4,720 | 1.29 | 2.22 | $ 22.88 | $ 47,580 |
| Kentucky | 2,420 | 1.23 | 2.11 | $ 13.44 | $ 27,960 |
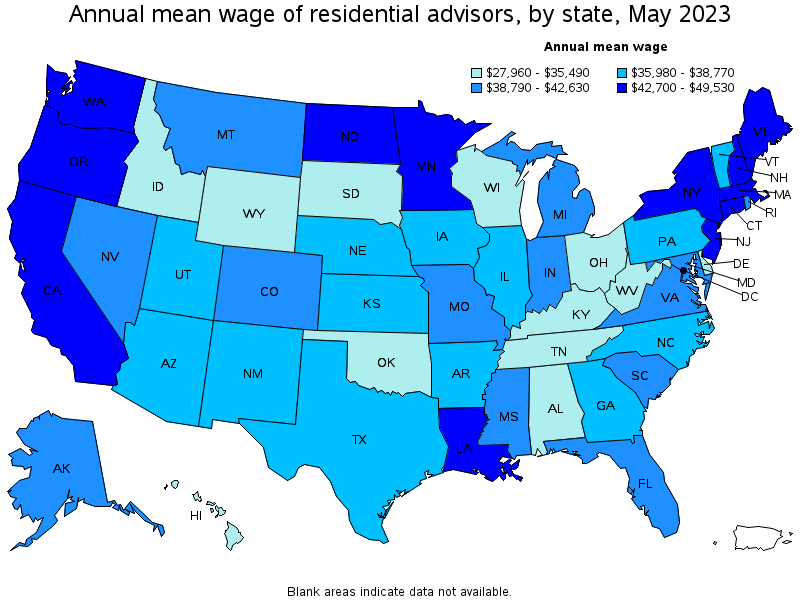
Top paying states for Residential Advisors:
| State | Employment (1) | Employment per thousand jobs | Location quotient (9) | Hourly mean wage | Annual mean wage (2) |
|---|---|---|---|---|---|
| Louisiana | 210 | 0.12 | 0.20 | $ 23.81 | $ 49,530 |
| California | 9,130 | 0.51 | 0.87 | $ 22.94 | $ 47,720 |
| Massachusetts | 4,720 | 1.29 | 2.22 | $ 22.88 | $ 47,580 |
| Washington | 1,980 | 0.57 | 0.97 | $ 22.26 | $ 46,290 |
| District of Columbia | 930 | 1.32 | 2.26 | $ 22.11 | $ 45,980 |
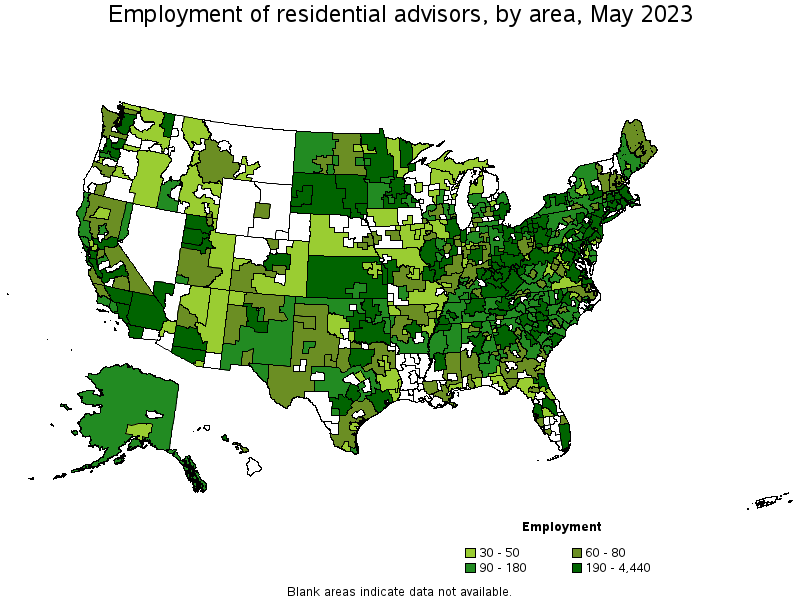
Metropolitan areas with the highest employment level in Residential Advisors:
| Metropolitan area | Employment (1) | Employment per thousand jobs | Location quotient (9) | Hourly mean wage | Annual mean wage (2) |
|---|---|---|---|---|---|
| New York-Newark-Jersey City, NY-NJ-PA | 4,440 | 0.47 | 0.80 | $ 22.29 | $ 46,360 |
| Los Angeles-Long Beach-Anaheim, CA | 3,340 | 0.54 | 0.92 | $ 23.13 | $ 48,110 |
| Boston-Cambridge-Nashua, MA-NH | 3,010 | 1.09 | 1.87 | $ 23.64 | $ 49,160 |
| Washington-Arlington-Alexandria, DC-VA-MD-WV | 2,480 | 0.80 | 1.37 | $ 21.67 | $ 45,080 |
| Philadelphia-Camden-Wilmington, PA-NJ-DE-MD | 2,190 | 0.77 | 1.32 | $ 19.09 | $ 39,700 |
| Minneapolis-St. Paul-Bloomington, MN-WI | 1,910 | 1.00 | 1.71 | $ 21.99 | $ 45,750 |
| Chicago-Naperville-Elgin, IL-IN-WI | 1,680 | 0.37 | 0.64 | $ 19.41 | $ 40,380 |
| Atlanta-Sandy Springs-Roswell, GA | 1,480 | 0.52 | 0.90 | $ 18.39 | $ 38,260 |
| Nashville-Davidson--Murfreesboro--Franklin, TN | 1,190 | 1.11 | 1.89 | $ 18.49 | $ 38,450 |
| San Francisco-Oakland-Hayward, CA | 1,170 | 0.48 | 0.82 | $ 25.35 | $ 52,720 |
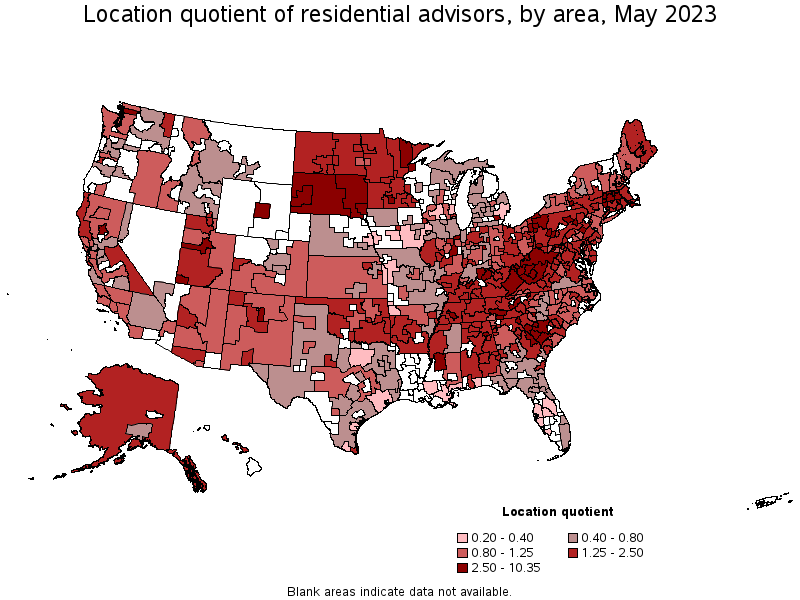
Metropolitan areas with the highest concentration of jobs and location quotients in Residential Advisors:
| Metropolitan area | Employment (1) | Employment per thousand jobs | Location quotient (9) | Hourly mean wage | Annual mean wage (2) |
|---|---|---|---|---|---|
| Rapid City, SD | 430 | 6.04 | 10.35 | $ 16.78 | $ 34,900 |
| Cumberland, MD-WV | 110 | 3.13 | 5.36 | $ 24.85 | $ 51,690 |
| Mankato-North Mankato, MN | 160 | 2.96 | 5.07 | $ 21.12 | $ 43,940 |
| Augusta-Richmond County, GA-SC | 650 | 2.84 | 4.87 | $ 17.67 | $ 36,760 |
| Johnstown, PA | 140 | 2.81 | 4.82 | $ 17.70 | $ 36,820 |
| Jackson, TN | 190 | 2.71 | 4.64 | $ 13.90 | $ 28,910 |
| Jackson, MS | 680 | 2.68 | 4.59 | $ 23.04 | $ 47,930 |
| Bloomsburg-Berwick, PA | 100 | 2.46 | 4.21 | $ 11.55 | $ 24,020 |
| Duluth, MN-WI | 290 | 2.38 | 4.07 | $ 21.51 | $ 44,750 |
| Ithaca, NY | 110 | 2.20 | 3.76 | $ 22.64 | $ 47,080 |
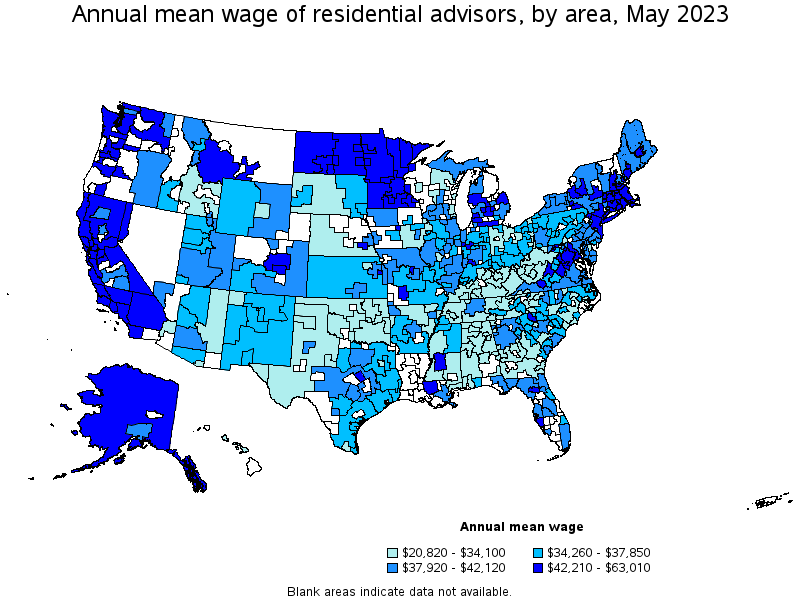
Top paying metropolitan areas for Residential Advisors:
| Metropolitan area | Employment (1) | Employment per thousand jobs | Location quotient (9) | Hourly mean wage | Annual mean wage (2) |
|---|---|---|---|---|---|
| Napa, CA | 50 | 0.62 | 1.07 | $ 30.30 | $ 63,010 |
| Baton Rouge, LA | 70 | 0.19 | 0.33 | $ 29.18 | $ 60,700 |
| San Francisco-Oakland-Hayward, CA | 1,170 | 0.48 | 0.82 | $ 25.35 | $ 52,720 |
| San Jose-Sunnyvale-Santa Clara, CA | 560 | 0.49 | 0.84 | $ 24.95 | $ 51,890 |
| Cumberland, MD-WV | 110 | 3.13 | 5.36 | $ 24.85 | $ 51,690 |
| Salinas, CA | 70 | 0.38 | 0.64 | $ 24.25 | $ 50,440 |
| Seattle-Tacoma-Bellevue, WA | 1,030 | 0.50 | 0.85 | $ 23.94 | $ 49,800 |
| Santa Rosa, CA | 150 | 0.71 | 1.21 | $ 23.93 | $ 49,770 |
| Boston-Cambridge-Nashua, MA-NH | 3,010 | 1.09 | 1.87 | $ 23.64 | $ 49,160 |
| Portland-South Portland, ME | 150 | 0.72 | 1.23 | $ 23.23 | $ 48,320 |
Nonmetropolitan areas with the highest employment in Residential Advisors:
| Nonmetropolitan area | Employment (1) | Employment per thousand jobs | Location quotient (9) | Hourly mean wage | Annual mean wage (2) |
|---|---|---|---|---|---|
| East South Dakota nonmetropolitan area | 560 | 4.23 | 7.24 | $ 16.80 | $ 34,940 |
| Western Pennsylvania nonmetropolitan area | 260 | 1.87 | 3.20 | $ 17.56 | $ 36,520 |
| East Tennessee nonmetropolitan area | 260 | 1.87 | 3.20 | $ 16.78 | $ 34,910 |
| North Northeastern Ohio nonmetropolitan area (noncontiguous) | 250 | 0.78 | 1.33 | $ 15.75 | $ 32,750 |
| Northwest Minnesota nonmetropolitan area | 240 | 1.29 | 2.20 | $ 21.64 | $ 45,020 |
Nonmetropolitan areas with the highest concentration of jobs and location quotients in Residential Advisors:
| Nonmetropolitan area | Employment (1) | Employment per thousand jobs | Location quotient (9) | Hourly mean wage | Annual mean wage (2) |
|---|---|---|---|---|---|
| East South Dakota nonmetropolitan area | 560 | 4.23 | 7.24 | $ 16.80 | $ 34,940 |
| West South Dakota nonmetropolitan area | 190 | 3.03 | 5.19 | $ 16.28 | $ 33,860 |
| Connecticut nonmetropolitan area | 90 | 2.72 | 4.65 | $ 20.11 | $ 41,830 |
| East Kentucky nonmetropolitan area | 220 | 2.14 | 3.66 | $ 12.64 | $ 26,290 |
| Western Pennsylvania nonmetropolitan area | 260 | 1.87 | 3.20 | $ 17.56 | $ 36,520 |
Top paying nonmetropolitan areas for Residential Advisors:
| Nonmetropolitan area | Employment (1) | Employment per thousand jobs | Location quotient (9) | Hourly mean wage | Annual mean wage (2) |
|---|---|---|---|---|---|
| Eastern Washington nonmetropolitan area | 40 | 0.40 | 0.68 | $ 23.30 | $ 48,450 |
| Alaska nonmetropolitan area | 130 | 1.23 | 2.10 | $ 22.82 | $ 47,460 |
| West Central-Southwest New Hampshire nonmetropolitan area | 60 | 0.58 | 0.99 | $ 22.58 | $ 46,970 |
| Southwest Minnesota nonmetropolitan area | 140 | 1.18 | 2.02 | $ 22.48 | $ 46,750 |
| East North Dakota nonmetropolitan area | 60 | 0.89 | 1.52 | $ 22.11 | $ 45,990 |
These estimates are calculated with data collected from employers in all industry sectors, all metropolitan and nonmetropolitan areas, and all states and the District of Columbia. The top employment and wage figures are provided above. The complete list is available in the downloadable XLS files.
The percentile wage estimate is the value of a wage below which a certain percent of workers fall. The median wage is the 50th percentile wage estimate—50 percent of workers earn less than the median and 50 percent of workers earn more than the median. More about percentile wages.
(1) Estimates for detailed occupations do not sum to the totals because the totals include occupations not shown separately. Estimates do not include self-employed workers.
(2) Annual wages have been calculated by multiplying the hourly mean wage by a "year-round, full-time" hours figure of 2,080 hours; for those occupations where there is not an hourly wage published, the annual wage has been directly calculated from the reported survey data.
(3) The relative standard error (RSE) is a measure of the reliability of a survey statistic. The smaller the relative standard error, the more precise the estimate.
(7) The value is less than .005 percent of industry employment.
(8) Estimate not released.
(9) The location quotient is the ratio of the area concentration of occupational employment to the national average concentration. A location quotient greater than one indicates the occupation has a higher share of employment than average, and a location quotient less than one indicates the occupation is less prevalent in the area than average.
Other OEWS estimates and related information:
May 2023 National Occupational Employment and Wage Estimates
May 2023 State Occupational Employment and Wage Estimates
May 2023 Metropolitan and Nonmetropolitan Area Occupational Employment and Wage Estimates
May 2023 National Industry-Specific Occupational Employment and Wage Estimates
Last Modified Date: April 3, 2024