
An official website of the United States government
An official website of the United States government
The .gov means it's official.
Federal government websites often end in .gov or .mil. Before sharing sensitive information,
make sure you're on a federal government site.
The site is secure.
The
https:// ensures that you are connecting to the official website and that any
information you provide is encrypted and transmitted securely.
All sales and related workers not listed separately.
Employment estimate and mean wage estimates for Sales and Related Workers, All Other:
| Employment (1) | Employment RSE (3) |
Mean hourly wage |
Mean annual wage (2) |
Wage RSE (3) |
|---|---|---|---|---|
| 114,280 | 3.3 % | $ 26.03 | $ 54,150 | 1.0 % |
Percentile wage estimates for Sales and Related Workers, All Other:
| Percentile | 10% | 25% | 50% (Median) |
75% | 90% |
|---|---|---|---|---|---|
| Hourly Wage | $ 13.10 | $ 16.14 | $ 21.45 | $ 30.56 | $ 44.20 |
| Annual Wage (2) | $ 27,250 | $ 33,580 | $ 44,610 | $ 63,560 | $ 91,940 |
Industries with the highest published employment and wages for Sales and Related Workers, All Other are provided. For a list of all industries with employment in Sales and Related Workers, All Other, see the Create Customized Tables function.
Industries with the highest levels of employment in Sales and Related Workers, All Other:
| Industry | Employment (1) | Percent of industry employment | Hourly mean wage | Annual mean wage (2) |
|---|---|---|---|---|
| Food and Beverage Retailers (4451 and 4452 only) | 14,650 | 0.48 | $ 16.64 | $ 34,610 |
| Nondepository Credit Intermediation | 8,540 | 1.55 | $ 16.03 | $ 33,350 |
| Management of Companies and Enterprises | 5,450 | 0.20 | $ 34.77 | $ 72,320 |
| General Merchandise Retailers | 4,770 | 0.15 | $ 19.88 | $ 41,360 |
| Automobile Dealers | 4,450 | 0.35 | $ 29.22 | $ 60,770 |
Industries with the highest concentration of employment in Sales and Related Workers, All Other:
| Industry | Employment (1) | Percent of industry employment | Hourly mean wage | Annual mean wage (2) |
|---|---|---|---|---|
| Nondepository Credit Intermediation | 8,540 | 1.55 | $ 16.03 | $ 33,350 |
| Other Support Services | 2,950 | 0.90 | $ 22.98 | $ 47,800 |
| Farm Product Raw Material Merchant Wholesalers | 580 | 0.82 | $ 27.14 | $ 56,450 |
| Miscellaneous Store Retailers (4594 and 4595 only) | 3,180 | 0.77 | $ 18.96 | $ 39,440 |
| Other Miscellaneous Retailers | 3,260 | 0.66 | $ 23.98 | $ 49,890 |
Top paying industries for Sales and Related Workers, All Other:
| Industry | Employment (1) | Percent of industry employment | Hourly mean wage | Annual mean wage (2) |
|---|---|---|---|---|
| Computer and Peripheral Equipment Manufacturing | 710 | 0.44 | $ 74.69 | $ 155,360 |
| Scientific Research and Development Services | 250 | 0.03 | $ 64.06 | $ 133,240 |
| Dairy Product Manufacturing | 50 | 0.03 | $ 48.78 | $ 101,460 |
| Accounting, Tax Preparation, Bookkeeping, and Payroll Services | 210 | 0.02 | $ 48.57 | $ 101,020 |
| Aerospace Product and Parts Manufacturing | 40 | 0.01 | $ 45.95 | $ 95,570 |
States and areas with the highest published employment, location quotients, and wages for Sales and Related Workers, All Other are provided. For a list of all areas with employment in Sales and Related Workers, All Other, see the Create Customized Tables function.
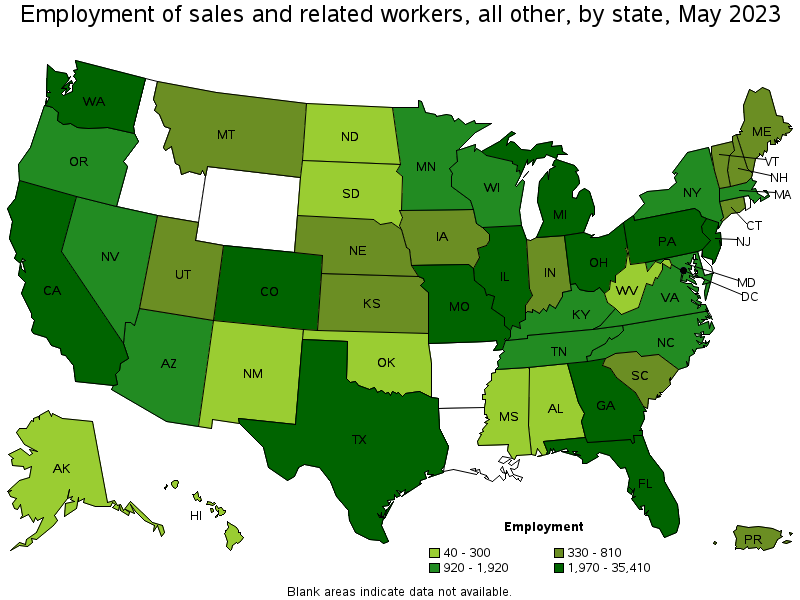
States with the highest employment level in Sales and Related Workers, All Other:
| State | Employment (1) | Employment per thousand jobs | Location quotient (9) | Hourly mean wage | Annual mean wage (2) |
|---|---|---|---|---|---|
| California | 35,410 | 1.97 | 2.62 | $ 31.50 | $ 65,520 |
| Texas | 16,190 | 1.19 | 1.59 | $ 17.92 | $ 37,270 |
| Colorado | 6,150 | 2.17 | 2.89 | $ 29.58 | $ 61,530 |
| New Jersey | 6,060 | 1.44 | 1.92 | $ 33.71 | $ 70,110 |
| Florida | 4,350 | 0.45 | 0.60 | $ 23.32 | $ 48,500 |
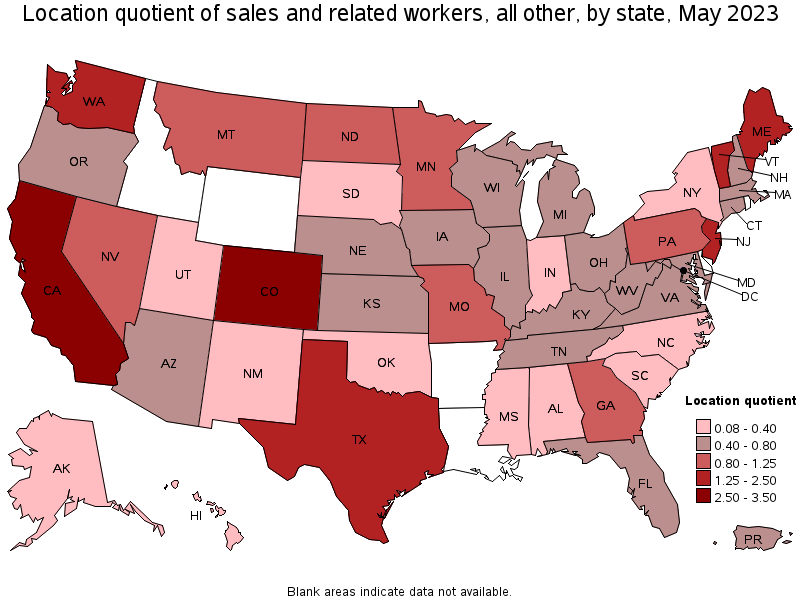
States with the highest concentration of jobs and location quotients in Sales and Related Workers, All Other:
| State | Employment (1) | Employment per thousand jobs | Location quotient (9) | Hourly mean wage | Annual mean wage (2) |
|---|---|---|---|---|---|
| Colorado | 6,150 | 2.17 | 2.89 | $ 29.58 | $ 61,530 |
| California | 35,410 | 1.97 | 2.62 | $ 31.50 | $ 65,520 |
| New Jersey | 6,060 | 1.44 | 1.92 | $ 33.71 | $ 70,110 |
| Vermont | 420 | 1.39 | 1.84 | $ 26.23 | $ 54,560 |
| Texas | 16,190 | 1.19 | 1.59 | $ 17.92 | $ 37,270 |
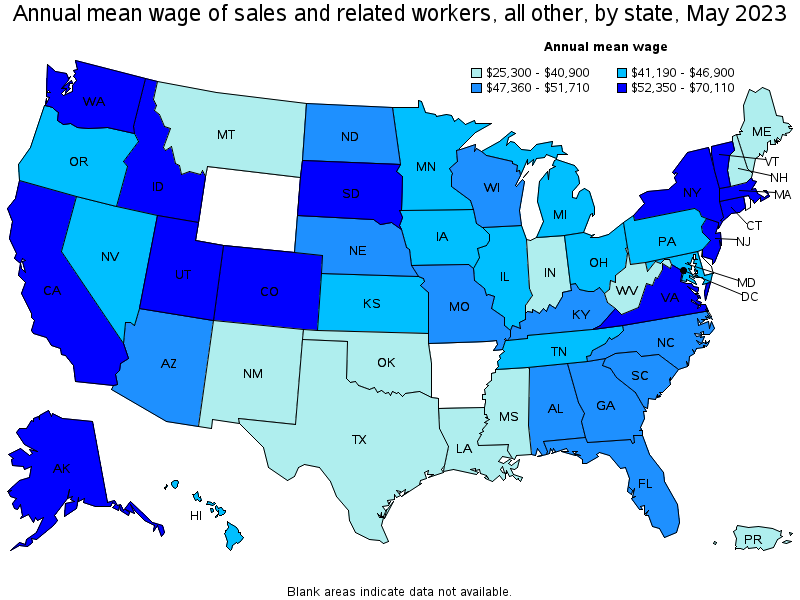
Top paying states for Sales and Related Workers, All Other:
| State | Employment (1) | Employment per thousand jobs | Location quotient (9) | Hourly mean wage | Annual mean wage (2) |
|---|---|---|---|---|---|
| New Jersey | 6,060 | 1.44 | 1.92 | $ 33.71 | $ 70,110 |
| Washington | 3,890 | 1.11 | 1.48 | $ 32.22 | $ 67,020 |
| California | 35,410 | 1.97 | 2.62 | $ 31.50 | $ 65,520 |
| Colorado | 6,150 | 2.17 | 2.89 | $ 29.58 | $ 61,530 |
| Idaho | (8) | (8) | (8) | $ 28.88 | $ 60,060 |
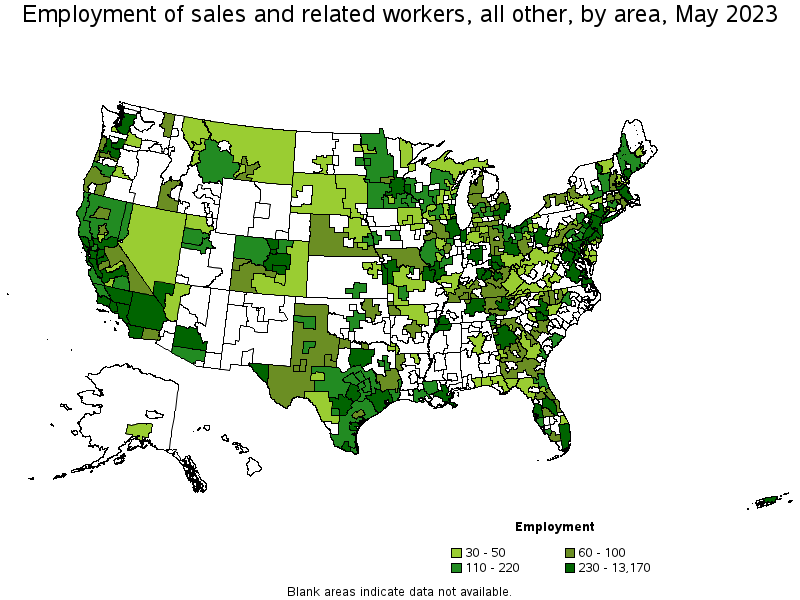
Metropolitan areas with the highest employment level in Sales and Related Workers, All Other:
| Metropolitan area | Employment (1) | Employment per thousand jobs | Location quotient (9) | Hourly mean wage | Annual mean wage (2) |
|---|---|---|---|---|---|
| Los Angeles-Long Beach-Anaheim, CA | 13,170 | 2.13 | 2.83 | $ 28.85 | $ 60,000 |
| New York-Newark-Jersey City, NY-NJ-PA | 5,470 | 0.58 | 0.77 | $ 32.41 | $ 67,420 |
| San Francisco-Oakland-Hayward, CA | 5,070 | 2.09 | 2.78 | $ 35.20 | $ 73,210 |
| Dallas-Fort Worth-Arlington, TX | 4,720 | 1.19 | 1.58 | $ 18.06 | $ 37,570 |
| Denver-Aurora-Lakewood, CO | 4,250 | 2.67 | 3.55 | $ 30.59 | $ 63,630 |
| Houston-The Woodlands-Sugar Land, TX | 3,780 | 1.19 | 1.58 | $ 18.04 | $ 37,530 |
| Seattle-Tacoma-Bellevue, WA | 3,390 | 1.63 | 2.16 | $ 33.05 | $ 68,750 |
| Riverside-San Bernardino-Ontario, CA | 2,940 | 1.77 | 2.35 | $ 28.49 | $ 59,260 |
| San Diego-Carlsbad, CA | 2,850 | 1.87 | 2.49 | $ 29.97 | $ 62,340 |
| San Jose-Sunnyvale-Santa Clara, CA | 2,270 | 1.99 | 2.64 | $ 49.08 | $ 102,080 |
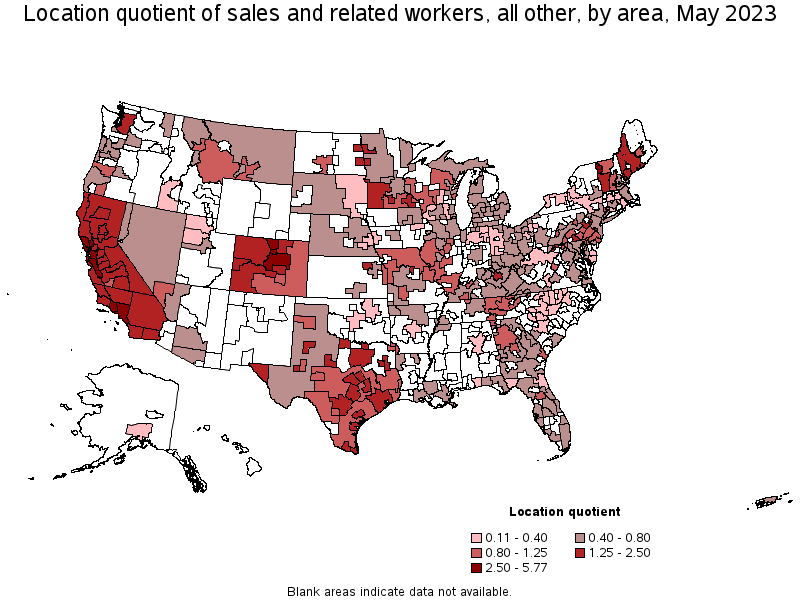
Metropolitan areas with the highest concentration of jobs and location quotients in Sales and Related Workers, All Other:
| Metropolitan area | Employment (1) | Employment per thousand jobs | Location quotient (9) | Hourly mean wage | Annual mean wage (2) |
|---|---|---|---|---|---|
| Napa, CA | 340 | 4.34 | 5.77 | $ 31.14 | $ 64,770 |
| Denver-Aurora-Lakewood, CO | 4,250 | 2.67 | 3.55 | $ 30.59 | $ 63,630 |
| Santa Rosa, CA | 480 | 2.31 | 3.06 | $ 31.17 | $ 64,830 |
| Los Angeles-Long Beach-Anaheim, CA | 13,170 | 2.13 | 2.83 | $ 28.85 | $ 60,000 |
| San Francisco-Oakland-Hayward, CA | 5,070 | 2.09 | 2.78 | $ 35.20 | $ 73,210 |
| Boulder, CO | 400 | 2.06 | 2.74 | $ 32.50 | $ 67,600 |
| Fort Collins, CO | 350 | 2.04 | 2.72 | $ 25.28 | $ 52,590 |
| Oxnard-Thousand Oaks-Ventura, CA | 640 | 2.03 | 2.69 | $ 30.72 | $ 63,910 |
| San Jose-Sunnyvale-Santa Clara, CA | 2,270 | 1.99 | 2.64 | $ 49.08 | $ 102,080 |
| Burlington-South Burlington, VT | 230 | 1.95 | 2.59 | $ 28.28 | $ 58,810 |
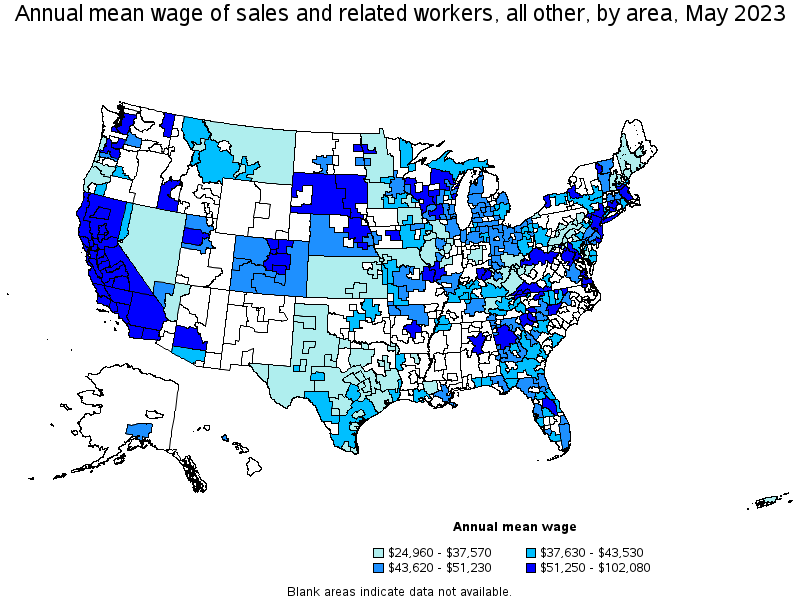
Top paying metropolitan areas for Sales and Related Workers, All Other:
| Metropolitan area | Employment (1) | Employment per thousand jobs | Location quotient (9) | Hourly mean wage | Annual mean wage (2) |
|---|---|---|---|---|---|
| San Jose-Sunnyvale-Santa Clara, CA | 2,270 | 1.99 | 2.64 | $ 49.08 | $ 102,080 |
| New Haven, CT | 40 | 0.14 | 0.19 | $ 44.79 | $ 93,150 |
| Trenton, NJ | 280 | 1.19 | 1.59 | $ 40.02 | $ 83,240 |
| San Francisco-Oakland-Hayward, CA | 5,070 | 2.09 | 2.78 | $ 35.20 | $ 73,210 |
| Little Rock-North Little Rock-Conway, AR | 80 | 0.23 | 0.31 | $ 34.29 | $ 71,320 |
| Seattle-Tacoma-Bellevue, WA | 3,390 | 1.63 | 2.16 | $ 33.05 | $ 68,750 |
| Boise City, ID | 60 | 0.17 | 0.23 | $ 32.67 | $ 67,960 |
| Boulder, CO | 400 | 2.06 | 2.74 | $ 32.50 | $ 67,600 |
| New York-Newark-Jersey City, NY-NJ-PA | 5,470 | 0.58 | 0.77 | $ 32.41 | $ 67,420 |
| Sacramento--Roseville--Arden-Arcade, CA | 1,940 | 1.85 | 2.46 | $ 31.43 | $ 65,370 |
Nonmetropolitan areas with the highest employment in Sales and Related Workers, All Other:
| Nonmetropolitan area | Employment (1) | Employment per thousand jobs | Location quotient (9) | Hourly mean wage | Annual mean wage (2) |
|---|---|---|---|---|---|
| Southwest Maine nonmetropolitan area | 180 | 0.95 | 1.26 | $ 16.54 | $ 34,410 |
| Hill Country Region of Texas nonmetropolitan area | 150 | 0.76 | 1.01 | $ 16.19 | $ 33,680 |
| North Valley-Northern Mountains Region of California nonmetropolitan area | 150 | 1.43 | 1.90 | $ 30.89 | $ 64,250 |
| Northwest Colorado nonmetropolitan area | 130 | 1.04 | 1.38 | $ 24.37 | $ 50,690 |
| North Northeastern Ohio nonmetropolitan area (noncontiguous) | 130 | 0.40 | 0.54 | $ 22.42 | $ 46,620 |
Nonmetropolitan areas with the highest concentration of jobs and location quotients in Sales and Related Workers, All Other:
| Nonmetropolitan area | Employment (1) | Employment per thousand jobs | Location quotient (9) | Hourly mean wage | Annual mean wage (2) |
|---|---|---|---|---|---|
| North Valley-Northern Mountains Region of California nonmetropolitan area | 150 | 1.43 | 1.90 | $ 30.89 | $ 64,250 |
| Eastern Sierra-Mother Lode Region of California nonmetropolitan area | 80 | 1.30 | 1.73 | $ 30.59 | $ 63,630 |
| North Coast Region of California nonmetropolitan area | 130 | 1.24 | 1.65 | $ 27.84 | $ 57,920 |
| Southern Vermont nonmetropolitan area | 120 | 1.20 | 1.60 | $ 23.84 | $ 49,590 |
| Northwest Colorado nonmetropolitan area | 130 | 1.04 | 1.38 | $ 24.37 | $ 50,690 |
Top paying nonmetropolitan areas for Sales and Related Workers, All Other:
| Nonmetropolitan area | Employment (1) | Employment per thousand jobs | Location quotient (9) | Hourly mean wage | Annual mean wage (2) |
|---|---|---|---|---|---|
| Piedmont North Carolina nonmetropolitan area | 50 | 0.18 | 0.24 | $ 35.51 | $ 73,860 |
| North Valley-Northern Mountains Region of California nonmetropolitan area | 150 | 1.43 | 1.90 | $ 30.89 | $ 64,250 |
| Eastern Sierra-Mother Lode Region of California nonmetropolitan area | 80 | 1.30 | 1.73 | $ 30.59 | $ 63,630 |
| Southwest Virginia nonmetropolitan area | 40 | 0.31 | 0.41 | $ 29.26 | $ 60,860 |
| North Coast Region of California nonmetropolitan area | 130 | 1.24 | 1.65 | $ 27.84 | $ 57,920 |
These estimates are calculated with data collected from employers in all industry sectors, all metropolitan and nonmetropolitan areas, and all states and the District of Columbia. The top employment and wage figures are provided above. The complete list is available in the downloadable XLS files.
The percentile wage estimate is the value of a wage below which a certain percent of workers fall. The median wage is the 50th percentile wage estimate—50 percent of workers earn less than the median and 50 percent of workers earn more than the median. More about percentile wages.
(1) Estimates for detailed occupations do not sum to the totals because the totals include occupations not shown separately. Estimates do not include self-employed workers.
(2) Annual wages have been calculated by multiplying the hourly mean wage by a "year-round, full-time" hours figure of 2,080 hours; for those occupations where there is not an hourly wage published, the annual wage has been directly calculated from the reported survey data.
(3) The relative standard error (RSE) is a measure of the reliability of a survey statistic. The smaller the relative standard error, the more precise the estimate.
(8) Estimate not released.
(9) The location quotient is the ratio of the area concentration of occupational employment to the national average concentration. A location quotient greater than one indicates the occupation has a higher share of employment than average, and a location quotient less than one indicates the occupation is less prevalent in the area than average.
Other OEWS estimates and related information:
May 2023 National Occupational Employment and Wage Estimates
May 2023 State Occupational Employment and Wage Estimates
May 2023 Metropolitan and Nonmetropolitan Area Occupational Employment and Wage Estimates
May 2023 National Industry-Specific Occupational Employment and Wage Estimates
Last Modified Date: April 3, 2024