
An official website of the United States government
An official website of the United States government
The .gov means it's official.
Federal government websites often end in .gov or .mil. Before sharing sensitive information,
make sure you're on a federal government site.
The site is secure.
The
https:// ensures that you are connecting to the official website and that any
information you provide is encrypted and transmitted securely.
Authorize credit charges against customers� accounts. Investigate history and credit standing of individuals or business establishments applying for credit. May interview applicants to obtain personal and financial data, determine credit worthiness, process applications, and notify customers of acceptance or rejection of credit.
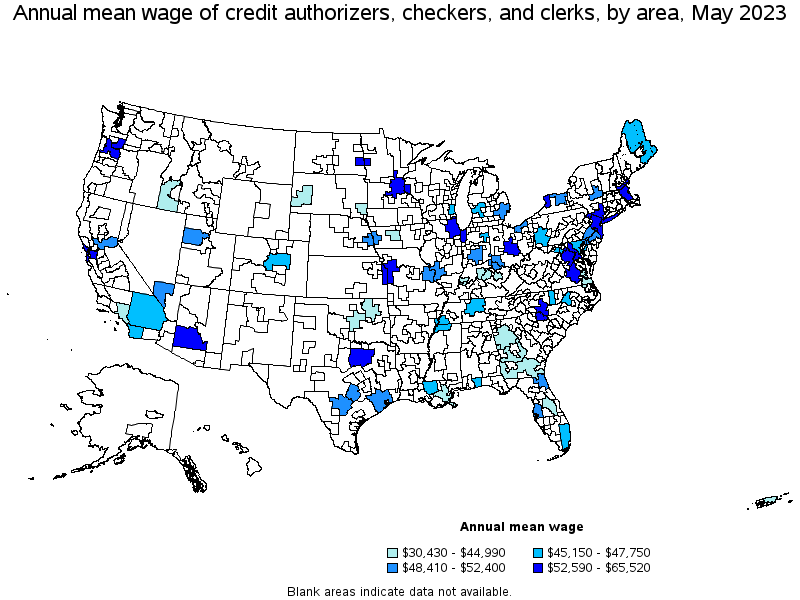
Employment estimate and mean wage estimates for Credit Authorizers, Checkers, and Clerks:
| Employment (1) | Employment RSE (3) |
Mean hourly wage |
Mean annual wage (2) |
Wage RSE (3) |
|---|---|---|---|---|
| 14,290 | 4.1 % | $ 24.22 | $ 50,380 | 1.2 % |
Percentile wage estimates for Credit Authorizers, Checkers, and Clerks:
| Percentile | 10% | 25% | 50% (Median) |
75% | 90% |
|---|---|---|---|---|---|
| Hourly Wage | $ 15.84 | $ 18.80 | $ 23.08 | $ 27.46 | $ 31.47 |
| Annual Wage (2) | $ 32,950 | $ 39,110 | $ 48,000 | $ 57,130 | $ 65,460 |
Industries with the highest published employment and wages for Credit Authorizers, Checkers, and Clerks are provided. For a list of all industries with employment in Credit Authorizers, Checkers, and Clerks, see the Create Customized Tables function.
Industries with the highest levels of employment in Credit Authorizers, Checkers, and Clerks:
| Industry | Employment (1) | Percent of industry employment | Hourly mean wage | Annual mean wage (2) |
|---|---|---|---|---|
| Credit Intermediation and Related Activities (5221 and 5223 only) | 3,130 | 0.15 | $ 26.29 | $ 54,690 |
| Nondepository Credit Intermediation | 2,280 | 0.41 | $ 23.80 | $ 49,510 |
| Management of Companies and Enterprises | 1,290 | 0.05 | $ 24.92 | $ 51,840 |
| Business Support Services | 770 | 0.10 | $ 18.37 | $ 38,200 |
| Furniture and Home Furnishings Retailers | 720 | 0.16 | $ 14.38 | $ 29,910 |
Industries with the highest concentration of employment in Credit Authorizers, Checkers, and Clerks:
| Industry | Employment (1) | Percent of industry employment | Hourly mean wage | Annual mean wage (2) |
|---|---|---|---|---|
| Nondepository Credit Intermediation | 2,280 | 0.41 | $ 23.80 | $ 49,510 |
| Furniture and Home Furnishings Retailers | 720 | 0.16 | $ 14.38 | $ 29,910 |
| Credit Intermediation and Related Activities (5221 and 5223 only) | 3,130 | 0.15 | $ 26.29 | $ 54,690 |
| Business Support Services | 770 | 0.10 | $ 18.37 | $ 38,200 |
| Rental and Leasing Services (5322, 5323, and 5324 only) | 250 | 0.07 | $ 20.14 | $ 41,900 |
Top paying industries for Credit Authorizers, Checkers, and Clerks:
| Industry | Employment (1) | Percent of industry employment | Hourly mean wage | Annual mean wage (2) |
|---|---|---|---|---|
| Automobile Dealers | 300 | 0.02 | $ 54.48 | $ 113,320 |
| Securities, Commodity Contracts, and Other Financial Investments and Related Activities | (8) | (8) | $ 30.33 | $ 63,080 |
| Telecommunications | 220 | 0.03 | $ 27.27 | $ 56,720 |
| Traveler Accommodation | 40 | (7) | $ 26.73 | $ 55,600 |
| Credit Intermediation and Related Activities (5221 and 5223 only) | 3,130 | 0.15 | $ 26.29 | $ 54,690 |
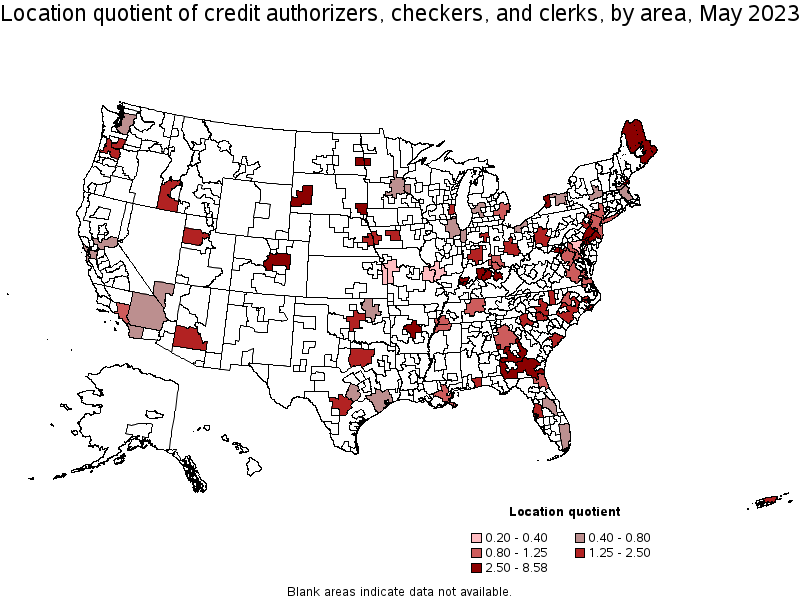
States and areas with the highest published employment, location quotients, and wages for Credit Authorizers, Checkers, and Clerks are provided. For a list of all areas with employment in Credit Authorizers, Checkers, and Clerks, see the Create Customized Tables function.
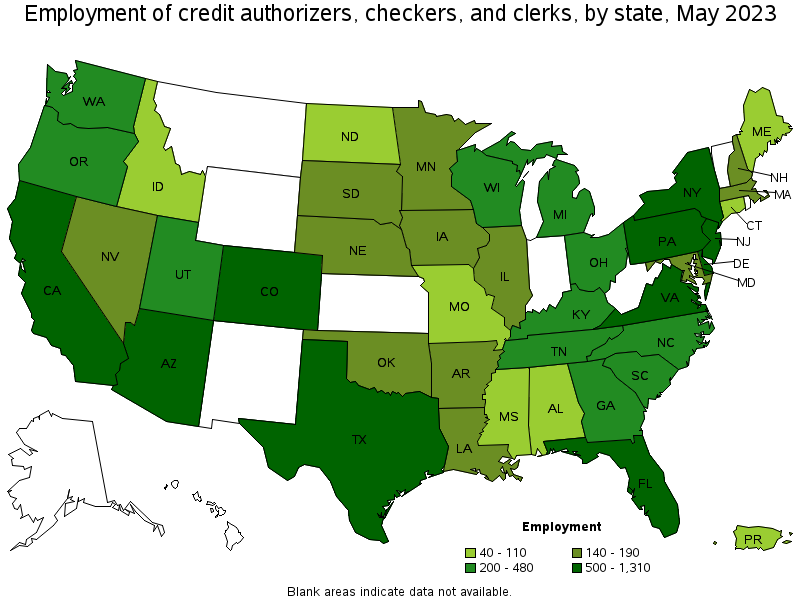
States with the highest employment level in Credit Authorizers, Checkers, and Clerks:
| State | Employment (1) | Employment per thousand jobs | Location quotient (9) | Hourly mean wage | Annual mean wage (2) |
|---|---|---|---|---|---|
| Texas | 1,310 | 0.10 | 1.03 | $ 26.41 | $ 54,930 |
| California | 1,180 | 0.07 | 0.70 | $ 22.49 | $ 46,770 |
| Pennsylvania | 910 | 0.15 | 1.63 | $ 21.39 | $ 44,500 |
| New York | 850 | 0.09 | 0.97 | $ 25.67 | $ 53,390 |
| Florida | 620 | 0.06 | 0.69 | $ 22.80 | $ 47,420 |
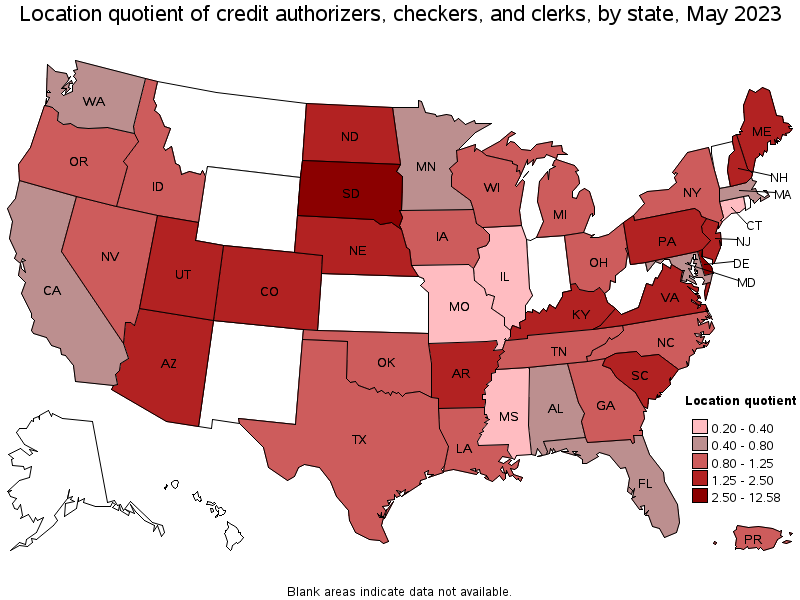
States with the highest concentration of jobs and location quotients in Credit Authorizers, Checkers, and Clerks:
| State | Employment (1) | Employment per thousand jobs | Location quotient (9) | Hourly mean wage | Annual mean wage (2) |
|---|---|---|---|---|---|
| Delaware | 560 | 1.18 | 12.58 | (8) | (8) |
| South Dakota | 190 | 0.42 | 4.45 | $ 20.54 | $ 42,710 |
| New Hampshire | 140 | 0.20 | 2.13 | $ 29.64 | $ 61,650 |
| Kentucky | 380 | 0.19 | 2.04 | $ 20.61 | $ 42,870 |
| Colorado | 500 | 0.18 | 1.87 | $ 22.36 | $ 46,510 |
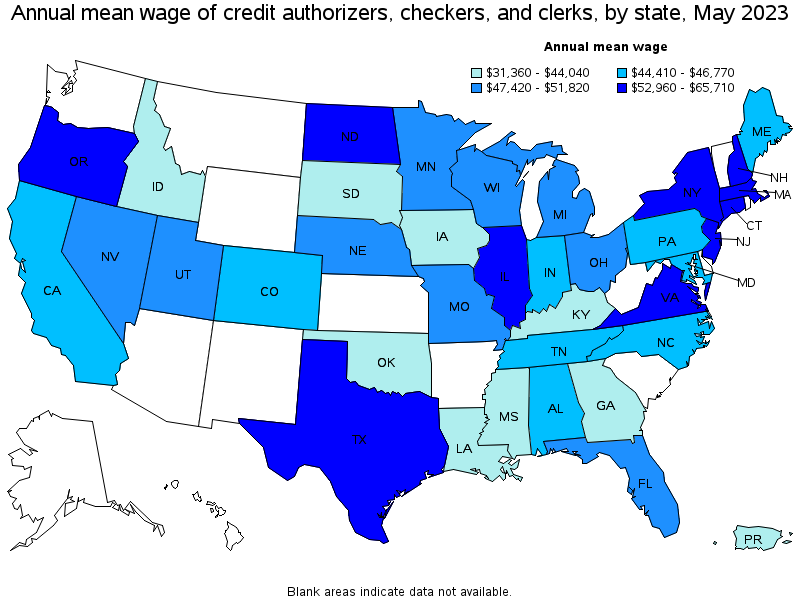
Top paying states for Credit Authorizers, Checkers, and Clerks:
| State | Employment (1) | Employment per thousand jobs | Location quotient (9) | Hourly mean wage | Annual mean wage (2) |
|---|---|---|---|---|---|
| Illinois | 190 | 0.03 | 0.33 | $ 31.59 | $ 65,710 |
| New Hampshire | 140 | 0.20 | 2.13 | $ 29.64 | $ 61,650 |
| North Dakota | 60 | 0.15 | 1.60 | $ 28.60 | $ 59,490 |
| Connecticut | 60 | 0.04 | 0.39 | $ 27.88 | $ 57,990 |
| Texas | 1,310 | 0.10 | 1.03 | $ 26.41 | $ 54,930 |
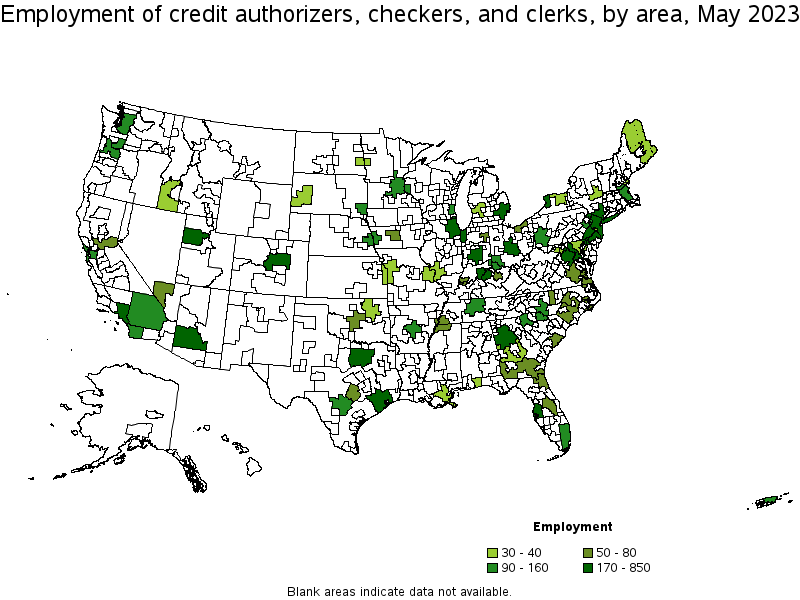
Metropolitan areas with the highest employment level in Credit Authorizers, Checkers, and Clerks:
| Metropolitan area | Employment (1) | Employment per thousand jobs | Location quotient (9) | Hourly mean wage | Annual mean wage (2) |
|---|---|---|---|---|---|
| New York-Newark-Jersey City, NY-NJ-PA | 850 | 0.09 | 0.95 | $ 26.42 | $ 54,950 |
| Philadelphia-Camden-Wilmington, PA-NJ-DE-MD | 810 | 0.29 | 3.04 | $ 24.79 | $ 51,570 |
| Dallas-Fort Worth-Arlington, TX | 690 | 0.17 | 1.84 | $ 28.25 | $ 58,770 |
| Los Angeles-Long Beach-Anaheim, CA | 520 | 0.08 | 0.90 | $ 20.87 | $ 43,400 |
| Phoenix-Mesa-Scottsdale, AZ | 430 | 0.19 | 2.01 | $ 30.38 | $ 63,180 |
| Denver-Aurora-Lakewood, CO | 420 | 0.27 | 2.82 | $ 21.71 | $ 45,150 |
| Washington-Arlington-Alexandria, DC-VA-MD-WV | 300 | 0.10 | 1.03 | $ 28.02 | $ 58,280 |
| Atlanta-Sandy Springs-Roswell, GA | 240 | 0.09 | 0.91 | $ 18.10 | $ 37,640 |
| Buffalo-Cheektowaga-Niagara Falls, NY | 200 | 0.38 | 3.99 | $ 25.79 | $ 53,630 |
| Louisville/Jefferson County, KY-IN | 190 | 0.29 | 3.04 | $ 20.92 | $ 43,510 |
Metropolitan areas with the highest concentration of jobs and location quotients in Credit Authorizers, Checkers, and Clerks:
| Metropolitan area | Employment (1) | Employment per thousand jobs | Location quotient (9) | Hourly mean wage | Annual mean wage (2) |
|---|---|---|---|---|---|
| Sioux Falls, SD | 130 | 0.81 | 8.58 | $ 21.28 | $ 44,250 |
| Rapid City, SD | 40 | 0.57 | 6.04 | $ 18.16 | $ 37,770 |
| Winchester, VA-WV | 30 | 0.52 | 5.57 | $ 22.12 | $ 46,010 |
| Evansville, IN-KY | 80 | 0.50 | 5.36 | $ 21.62 | $ 44,960 |
| Portsmouth, NH-ME | 40 | 0.41 | 4.41 | $ 28.54 | $ 59,360 |
| Buffalo-Cheektowaga-Niagara Falls, NY | 200 | 0.38 | 3.99 | $ 25.79 | $ 53,630 |
| Lexington-Fayette, KY | 80 | 0.30 | 3.22 | $ 20.92 | $ 43,510 |
| Louisville/Jefferson County, KY-IN | 190 | 0.29 | 3.04 | $ 20.92 | $ 43,510 |
| Philadelphia-Camden-Wilmington, PA-NJ-DE-MD | 810 | 0.29 | 3.04 | $ 24.79 | $ 51,570 |
| Denver-Aurora-Lakewood, CO | 420 | 0.27 | 2.82 | $ 21.71 | $ 45,150 |
Top paying metropolitan areas for Credit Authorizers, Checkers, and Clerks:
| Metropolitan area | Employment (1) | Employment per thousand jobs | Location quotient (9) | Hourly mean wage | Annual mean wage (2) |
|---|---|---|---|---|---|
| Chicago-Naperville-Elgin, IL-IN-WI | 190 | 0.04 | 0.44 | $ 31.50 | $ 65,520 |
| Fargo, ND-MN | 40 | 0.24 | 2.55 | $ 30.47 | $ 63,380 |
| Phoenix-Mesa-Scottsdale, AZ | 430 | 0.19 | 2.01 | $ 30.38 | $ 63,180 |
| Portsmouth, NH-ME | 40 | 0.41 | 4.41 | $ 28.54 | $ 59,360 |
| Dallas-Fort Worth-Arlington, TX | 690 | 0.17 | 1.84 | $ 28.25 | $ 58,770 |
| Washington-Arlington-Alexandria, DC-VA-MD-WV | 300 | 0.10 | 1.03 | $ 28.02 | $ 58,280 |
| Boston-Cambridge-Nashua, MA-NH | 140 | 0.05 | 0.56 | $ 27.41 | $ 57,010 |
| New York-Newark-Jersey City, NY-NJ-PA | 850 | 0.09 | 0.95 | $ 26.42 | $ 54,950 |
| San Francisco-Oakland-Hayward, CA | 130 | 0.05 | 0.55 | $ 26.23 | $ 54,550 |
| Columbus, OH | 180 | 0.17 | 1.78 | $ 26.22 | $ 54,530 |
Nonmetropolitan areas with the highest employment in Credit Authorizers, Checkers, and Clerks:
| Nonmetropolitan area | Employment (1) | Employment per thousand jobs | Location quotient (9) | Hourly mean wage | Annual mean wage (2) |
|---|---|---|---|---|---|
| Southeast Coastal North Carolina nonmetropolitan area | 60 | 0.23 | 2.47 | (8) | (8) |
| South Georgia nonmetropolitan area | 50 | 0.24 | 2.52 | $ 14.63 | $ 30,430 |
| Middle Georgia nonmetropolitan area | 40 | 0.30 | 3.20 | $ 15.73 | $ 32,720 |
| Northeast Maine nonmetropolitan area | 30 | 0.46 | 4.91 | $ 22.01 | $ 45,780 |
Nonmetropolitan areas with the highest concentration of jobs and location quotients in Credit Authorizers, Checkers, and Clerks:
| Nonmetropolitan area | Employment (1) | Employment per thousand jobs | Location quotient (9) | Hourly mean wage | Annual mean wage (2) |
|---|---|---|---|---|---|
| Northeast Maine nonmetropolitan area | 30 | 0.46 | 4.91 | $ 22.01 | $ 45,780 |
| Middle Georgia nonmetropolitan area | 40 | 0.30 | 3.20 | $ 15.73 | $ 32,720 |
| South Georgia nonmetropolitan area | 50 | 0.24 | 2.52 | $ 14.63 | $ 30,430 |
| Southeast Coastal North Carolina nonmetropolitan area | 60 | 0.23 | 2.47 | (8) | (8) |
Top paying nonmetropolitan areas for Credit Authorizers, Checkers, and Clerks:
| Nonmetropolitan area | Employment (1) | Employment per thousand jobs | Location quotient (9) | Hourly mean wage | Annual mean wage (2) |
|---|---|---|---|---|---|
| Northeast Maine nonmetropolitan area | 30 | 0.46 | 4.91 | $ 22.01 | $ 45,780 |
| Middle Georgia nonmetropolitan area | 40 | 0.30 | 3.20 | $ 15.73 | $ 32,720 |
| South Georgia nonmetropolitan area | 50 | 0.24 | 2.52 | $ 14.63 | $ 30,430 |
These estimates are calculated with data collected from employers in all industry sectors, all metropolitan and nonmetropolitan areas, and all states and the District of Columbia. The top employment and wage figures are provided above. The complete list is available in the downloadable XLS files.
The percentile wage estimate is the value of a wage below which a certain percent of workers fall. The median wage is the 50th percentile wage estimate—50 percent of workers earn less than the median and 50 percent of workers earn more than the median. More about percentile wages.
(1) Estimates for detailed occupations do not sum to the totals because the totals include occupations not shown separately. Estimates do not include self-employed workers.
(2) Annual wages have been calculated by multiplying the hourly mean wage by a "year-round, full-time" hours figure of 2,080 hours; for those occupations where there is not an hourly wage published, the annual wage has been directly calculated from the reported survey data.
(3) The relative standard error (RSE) is a measure of the reliability of a survey statistic. The smaller the relative standard error, the more precise the estimate.
(7) The value is less than .005 percent of industry employment.
(8) Estimate not released.
(9) The location quotient is the ratio of the area concentration of occupational employment to the national average concentration. A location quotient greater than one indicates the occupation has a higher share of employment than average, and a location quotient less than one indicates the occupation is less prevalent in the area than average.
Other OEWS estimates and related information:
May 2023 National Occupational Employment and Wage Estimates
May 2023 State Occupational Employment and Wage Estimates
May 2023 Metropolitan and Nonmetropolitan Area Occupational Employment and Wage Estimates
May 2023 National Industry-Specific Occupational Employment and Wage Estimates
Last Modified Date: April 3, 2024