
An official website of the United States government
An official website of the United States government
The .gov means it's official.
Federal government websites often end in .gov or .mil. Before sharing sensitive information,
make sure you're on a federal government site.
The site is secure.
The
https:// ensures that you are connecting to the official website and that any
information you provide is encrypted and transmitted securely.
File correspondence, cards, invoices, receipts, and other records in alphabetical or numerical order or according to the filing system used. Locate and remove material from file when requested.
Employment estimate and mean wage estimates for File Clerks:
| Employment (1) | Employment RSE (3) |
Mean hourly wage |
Mean annual wage (2) |
Wage RSE (3) |
|---|---|---|---|---|
| 82,290 | 2.2 % | $ 19.58 | $ 40,730 | 0.5 % |
Percentile wage estimates for File Clerks:
| Percentile | 10% | 25% | 50% (Median) |
75% | 90% |
|---|---|---|---|---|---|
| Hourly Wage | $ 13.00 | $ 15.55 | $ 18.33 | $ 22.68 | $ 27.95 |
| Annual Wage (2) | $ 27,040 | $ 32,350 | $ 38,130 | $ 47,180 | $ 58,140 |
Industries with the highest published employment and wages for File Clerks are provided. For a list of all industries with employment in File Clerks, see the Create Customized Tables function.
Industries with the highest levels of employment in File Clerks:
| Industry | Employment (1) | Percent of industry employment | Hourly mean wage | Annual mean wage (2) |
|---|---|---|---|---|
| Local Government, excluding Schools and Hospitals (OEWS Designation) | 14,110 | 0.26 | $ 22.99 | $ 47,830 |
| Legal Services | 10,490 | 0.88 | $ 18.79 | $ 39,080 |
| Offices of Physicians | 4,310 | 0.15 | $ 16.55 | $ 34,420 |
| Employment Services | 4,110 | 0.11 | $ 18.50 | $ 38,470 |
| Colleges, Universities, and Professional Schools | 2,720 | 0.09 | $ 21.18 | $ 44,050 |
Industries with the highest concentration of employment in File Clerks:
| Industry | Employment (1) | Percent of industry employment | Hourly mean wage | Annual mean wage (2) |
|---|---|---|---|---|
| Legal Services | 10,490 | 0.88 | $ 18.79 | $ 39,080 |
| Office Administrative Services | 2,040 | 0.37 | $ 18.22 | $ 37,910 |
| Computing Infrastructure Providers, Data Processing, Web Hosting, and Related Services | 1,700 | 0.35 | $ 16.18 | $ 33,650 |
| Local Government, excluding Schools and Hospitals (OEWS Designation) | 14,110 | 0.26 | $ 22.99 | $ 47,830 |
| Foundries | 200 | 0.19 | $ 22.14 | $ 46,060 |
Top paying industries for File Clerks:
| Industry | Employment (1) | Percent of industry employment | Hourly mean wage | Annual mean wage (2) |
|---|---|---|---|---|
| Federal, State, and Local Government, excluding State and Local Government Schools and Hospitals and the U.S. Postal Service (OEWS Designation) | 40 | (7) | $ 32.80 | $ 68,220 |
| Telecommunications | 350 | 0.05 | $ 30.03 | $ 62,470 |
| Navigational, Measuring, Electromedical, and Control Instruments Manufacturing | 100 | 0.02 | $ 29.32 | $ 60,980 |
| Electric Power Generation, Transmission and Distribution | 90 | 0.02 | $ 26.79 | $ 55,730 |
| Support Activities for Air Transportation | 160 | 0.06 | $ 26.54 | $ 55,210 |
States and areas with the highest published employment, location quotients, and wages for File Clerks are provided. For a list of all areas with employment in File Clerks, see the Create Customized Tables function.
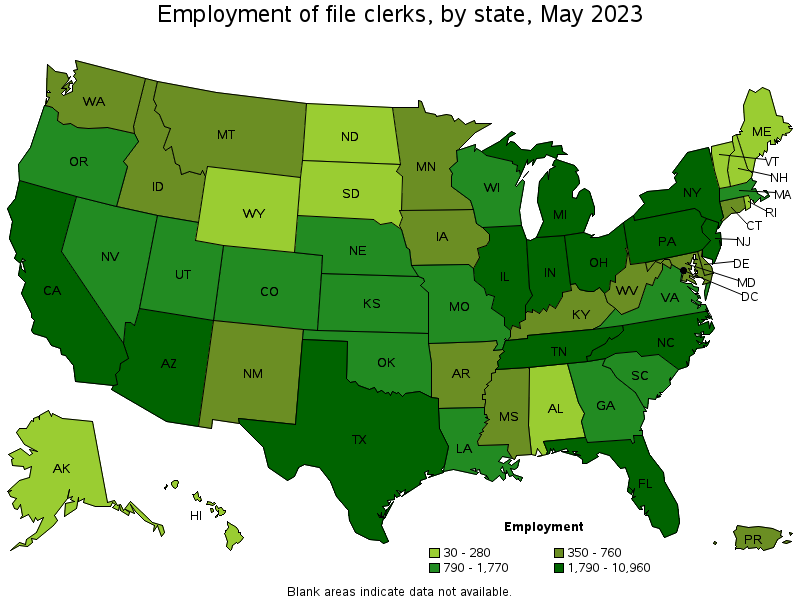
States with the highest employment level in File Clerks:
| State | Employment (1) | Employment per thousand jobs | Location quotient (9) | Hourly mean wage | Annual mean wage (2) |
|---|---|---|---|---|---|
| California | 10,960 | 0.61 | 1.13 | $ 22.44 | $ 46,680 |
| Texas | 10,130 | 0.75 | 1.38 | $ 17.38 | $ 36,140 |
| Florida | 7,050 | 0.74 | 1.36 | $ 19.21 | $ 39,960 |
| New York | 4,200 | 0.45 | 0.83 | $ 20.29 | $ 42,200 |
| Illinois | 4,000 | 0.67 | 1.23 | $ 21.25 | $ 44,200 |
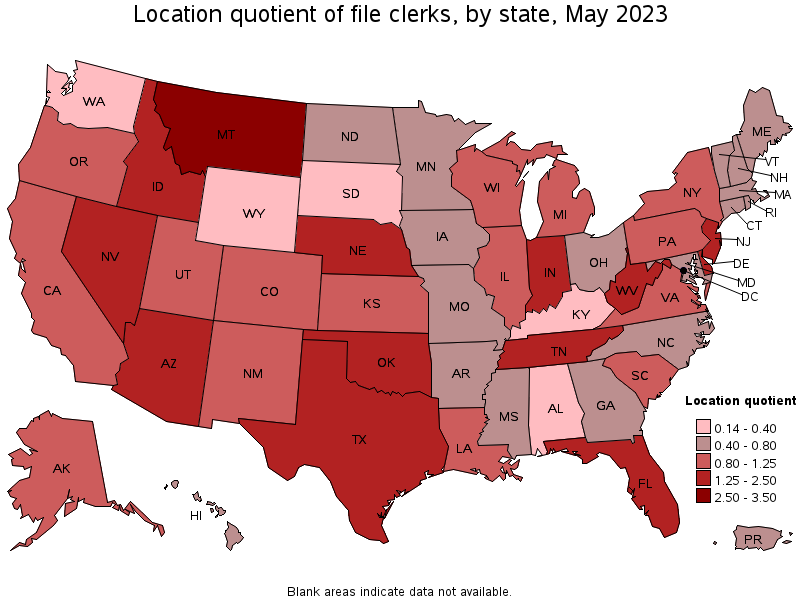
States with the highest concentration of jobs and location quotients in File Clerks:
| State | Employment (1) | Employment per thousand jobs | Location quotient (9) | Hourly mean wage | Annual mean wage (2) |
|---|---|---|---|---|---|
| Montana | 760 | 1.51 | 2.78 | $ 19.01 | $ 39,530 |
| Delaware | 630 | 1.35 | 2.49 | $ 15.85 | $ 32,960 |
| Tennessee | 3,350 | 1.04 | 1.92 | $ 18.39 | $ 38,260 |
| Oklahoma | 1,710 | 1.03 | 1.90 | $ 18.92 | $ 39,350 |
| New Jersey | 3,810 | 0.91 | 1.67 | $ 20.41 | $ 42,460 |
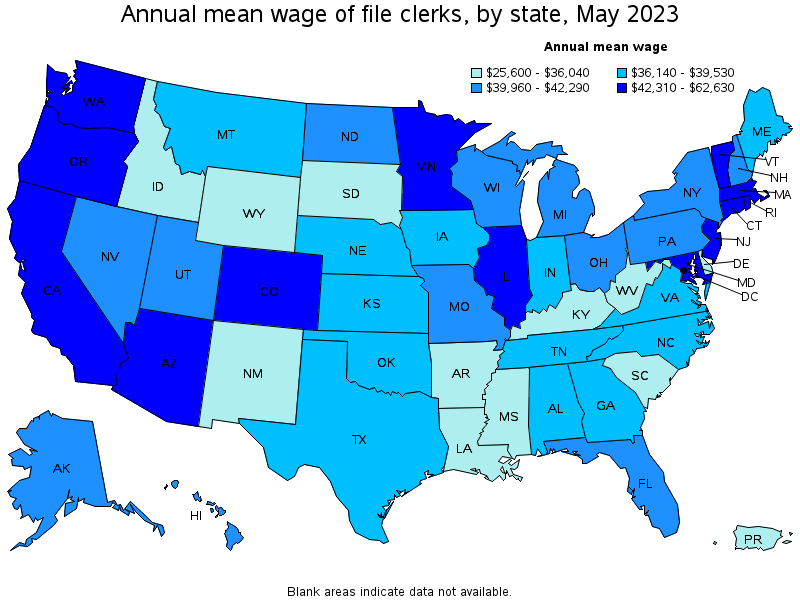
Top paying states for File Clerks:
| State | Employment (1) | Employment per thousand jobs | Location quotient (9) | Hourly mean wage | Annual mean wage (2) |
|---|---|---|---|---|---|
| District of Columbia | 180 | 0.26 | 0.48 | $ 30.11 | $ 62,630 |
| Massachusetts | 790 | 0.22 | 0.40 | $ 24.27 | $ 50,480 |
| Oregon | 1,000 | 0.52 | 0.95 | $ 22.96 | $ 47,750 |
| California | 10,960 | 0.61 | 1.13 | $ 22.44 | $ 46,680 |
| Washington | 710 | 0.20 | 0.38 | $ 22.06 | $ 45,880 |
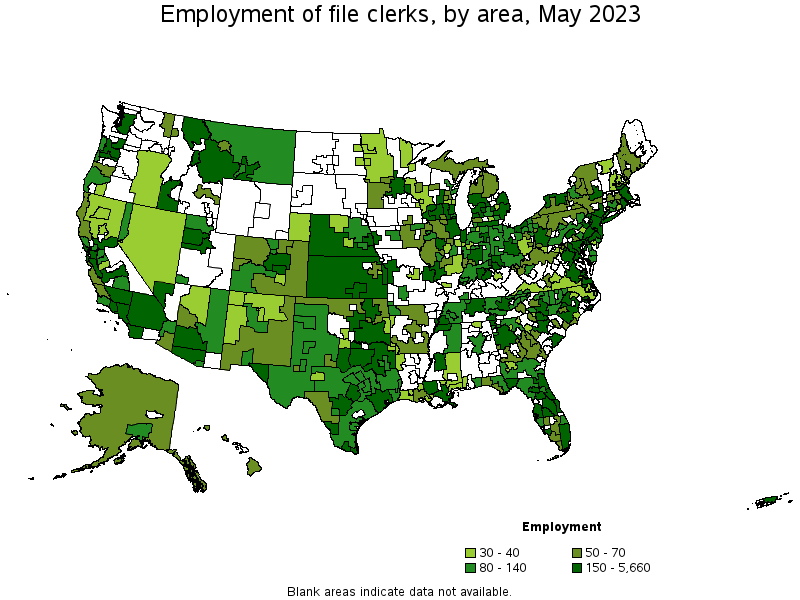
Metropolitan areas with the highest employment level in File Clerks:
| Metropolitan area | Employment (1) | Employment per thousand jobs | Location quotient (9) | Hourly mean wage | Annual mean wage (2) |
|---|---|---|---|---|---|
| New York-Newark-Jersey City, NY-NJ-PA | 5,660 | 0.60 | 1.10 | $ 20.91 | $ 43,490 |
| Los Angeles-Long Beach-Anaheim, CA | 4,780 | 0.77 | 1.43 | $ 21.66 | $ 45,040 |
| Chicago-Naperville-Elgin, IL-IN-WI | 2,890 | 0.64 | 1.18 | $ 22.07 | $ 45,900 |
| Dallas-Fort Worth-Arlington, TX | 2,840 | 0.72 | 1.32 | $ 18.64 | $ 38,760 |
| Houston-The Woodlands-Sugar Land, TX | 2,460 | 0.77 | 1.43 | $ 18.11 | $ 37,660 |
| Miami-Fort Lauderdale-West Palm Beach, FL | 2,050 | 0.75 | 1.39 | $ 21.55 | $ 44,810 |
| Phoenix-Mesa-Scottsdale, AZ | 1,850 | 0.81 | 1.49 | $ 20.76 | $ 43,190 |
| Philadelphia-Camden-Wilmington, PA-NJ-DE-MD | 1,780 | 0.63 | 1.16 | $ 19.04 | $ 39,600 |
| Washington-Arlington-Alexandria, DC-VA-MD-WV | 1,170 | 0.38 | 0.70 | $ 21.63 | $ 45,000 |
| Nashville-Davidson--Murfreesboro--Franklin, TN | 1,160 | 1.08 | 1.99 | $ 18.74 | $ 38,980 |
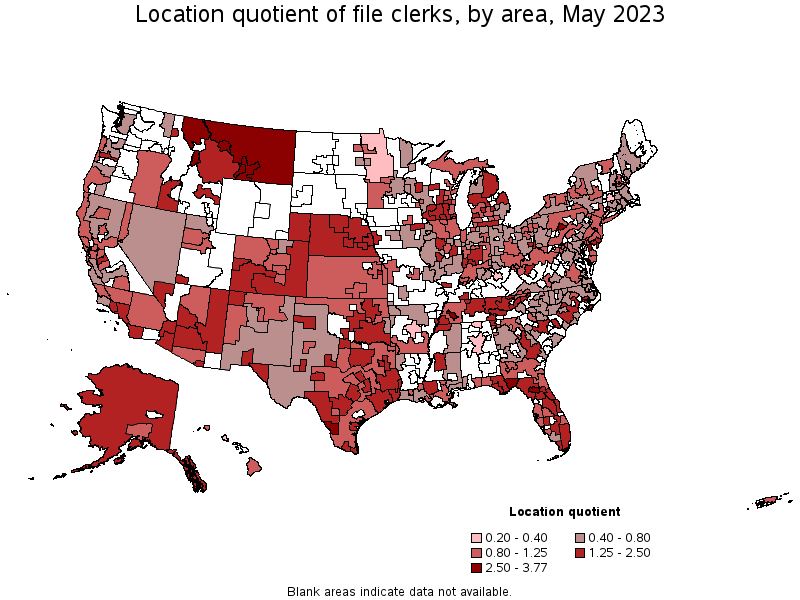
Metropolitan areas with the highest concentration of jobs and location quotients in File Clerks:
| Metropolitan area | Employment (1) | Employment per thousand jobs | Location quotient (9) | Hourly mean wage | Annual mean wage (2) |
|---|---|---|---|---|---|
| State College, PA | 140 | 2.04 | 3.77 | $ 20.14 | $ 41,900 |
| Tallahassee, FL | 320 | 1.77 | 3.26 | $ 17.07 | $ 35,510 |
| Dover, DE | 110 | 1.70 | 3.13 | $ 15.87 | $ 33,010 |
| Jackson, TN | 120 | 1.69 | 3.12 | $ 18.38 | $ 38,220 |
| Billings, MT | 150 | 1.68 | 3.10 | $ 14.88 | $ 30,950 |
| Gainesville, FL | 220 | 1.56 | 2.87 | $ 21.72 | $ 45,180 |
| Laredo, TX | 150 | 1.48 | 2.73 | $ 12.53 | $ 26,060 |
| Great Falls, MT | 50 | 1.42 | 2.61 | $ 16.24 | $ 33,770 |
| Las Cruces, NM | 100 | 1.31 | 2.41 | $ 15.95 | $ 33,180 |
| Ocala, FL | 150 | 1.30 | 2.39 | $ 14.83 | $ 30,850 |
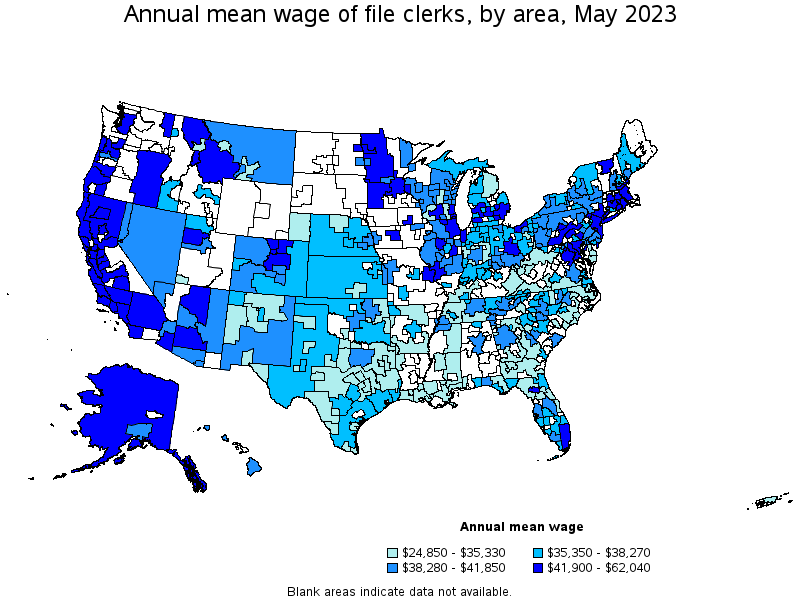
Top paying metropolitan areas for File Clerks:
| Metropolitan area | Employment (1) | Employment per thousand jobs | Location quotient (9) | Hourly mean wage | Annual mean wage (2) |
|---|---|---|---|---|---|
| San Jose-Sunnyvale-Santa Clara, CA | 430 | 0.37 | 0.69 | $ 29.83 | $ 62,040 |
| Santa Cruz-Watsonville, CA | 60 | 0.56 | 1.04 | $ 25.76 | $ 53,570 |
| San Francisco-Oakland-Hayward, CA | 1,070 | 0.44 | 0.81 | $ 25.73 | $ 53,520 |
| Medford, OR | 30 | 0.38 | 0.70 | $ 25.13 | $ 52,260 |
| Portland-Vancouver-Hillsboro, OR-WA | 490 | 0.41 | 0.76 | $ 24.85 | $ 51,690 |
| Boston-Cambridge-Nashua, MA-NH | 630 | 0.23 | 0.42 | $ 24.39 | $ 50,740 |
| Worcester, MA-CT | 60 | 0.23 | 0.42 | $ 24.20 | $ 50,330 |
| Stockton-Lodi, CA | 140 | 0.51 | 0.94 | $ 24.11 | $ 50,140 |
| Greeley, CO | 50 | 0.42 | 0.77 | $ 22.95 | $ 47,740 |
| Vallejo-Fairfield, CA | 80 | 0.56 | 1.03 | $ 22.95 | $ 47,740 |
Nonmetropolitan areas with the highest employment in File Clerks:
| Nonmetropolitan area | Employment (1) | Employment per thousand jobs | Location quotient (9) | Hourly mean wage | Annual mean wage (2) |
|---|---|---|---|---|---|
| Kansas nonmetropolitan area | 230 | 0.58 | 1.07 | $ 17.32 | $ 36,020 |
| Southeast Coastal North Carolina nonmetropolitan area | 200 | 0.80 | 1.48 | $ 16.59 | $ 34,500 |
| Southwest Montana nonmetropolitan area | 200 | 1.29 | 2.39 | $ 21.11 | $ 43,900 |
| South Nebraska nonmetropolitan area | 190 | 1.31 | 2.42 | $ 17.81 | $ 37,050 |
| Balance of Lower Peninsula of Michigan nonmetropolitan area | 190 | 0.74 | 1.36 | $ 17.67 | $ 36,760 |
Nonmetropolitan areas with the highest concentration of jobs and location quotients in File Clerks:
| Nonmetropolitan area | Employment (1) | Employment per thousand jobs | Location quotient (9) | Hourly mean wage | Annual mean wage (2) |
|---|---|---|---|---|---|
| West Montana nonmetropolitan area | 150 | 1.85 | 3.41 | $ 20.32 | $ 42,260 |
| East-Central Montana nonmetropolitan area | 90 | 1.45 | 2.67 | $ 18.43 | $ 38,340 |
| South Nebraska nonmetropolitan area | 190 | 1.31 | 2.42 | $ 17.81 | $ 37,050 |
| Southwest Montana nonmetropolitan area | 200 | 1.29 | 2.39 | $ 21.11 | $ 43,900 |
| Northwest Nebraska nonmetropolitan area | 40 | 1.11 | 2.04 | $ 16.86 | $ 35,070 |
Top paying nonmetropolitan areas for File Clerks:
| Nonmetropolitan area | Employment (1) | Employment per thousand jobs | Location quotient (9) | Hourly mean wage | Annual mean wage (2) |
|---|---|---|---|---|---|
| North Valley-Northern Mountains Region of California nonmetropolitan area | 40 | 0.42 | 0.78 | $ 24.63 | $ 51,230 |
| Alaska nonmetropolitan area | 70 | 0.68 | 1.26 | $ 22.03 | $ 45,810 |
| Southwest Montana nonmetropolitan area | 200 | 1.29 | 2.39 | $ 21.11 | $ 43,900 |
| Southwest Minnesota nonmetropolitan area | 60 | 0.50 | 0.93 | $ 21.09 | $ 43,870 |
| Eastern Oregon nonmetropolitan area | 40 | 0.53 | 0.97 | $ 21.01 | $ 43,700 |
These estimates are calculated with data collected from employers in all industry sectors, all metropolitan and nonmetropolitan areas, and all states and the District of Columbia. The top employment and wage figures are provided above. The complete list is available in the downloadable XLS files.
The percentile wage estimate is the value of a wage below which a certain percent of workers fall. The median wage is the 50th percentile wage estimate—50 percent of workers earn less than the median and 50 percent of workers earn more than the median. More about percentile wages.
(1) Estimates for detailed occupations do not sum to the totals because the totals include occupations not shown separately. Estimates do not include self-employed workers.
(2) Annual wages have been calculated by multiplying the hourly mean wage by a "year-round, full-time" hours figure of 2,080 hours; for those occupations where there is not an hourly wage published, the annual wage has been directly calculated from the reported survey data.
(3) The relative standard error (RSE) is a measure of the reliability of a survey statistic. The smaller the relative standard error, the more precise the estimate.
(7) The value is less than .005 percent of industry employment.
(9) The location quotient is the ratio of the area concentration of occupational employment to the national average concentration. A location quotient greater than one indicates the occupation has a higher share of employment than average, and a location quotient less than one indicates the occupation is less prevalent in the area than average.
Other OEWS estimates and related information:
May 2023 National Occupational Employment and Wage Estimates
May 2023 State Occupational Employment and Wage Estimates
May 2023 Metropolitan and Nonmetropolitan Area Occupational Employment and Wage Estimates
May 2023 National Industry-Specific Occupational Employment and Wage Estimates
Last Modified Date: April 3, 2024