
An official website of the United States government
An official website of the United States government
The .gov means it's official.
Federal government websites often end in .gov or .mil. Before sharing sensitive information,
make sure you're on a federal government site.
The site is secure.
The
https:// ensures that you are connecting to the official website and that any
information you provide is encrypted and transmitted securely.
Position and secure steel bars or mesh in concrete forms in order to reinforce concrete. Use a variety of fasteners, rod-bending machines, blowtorches, and hand tools. Includes rod busters.
Employment estimate and mean wage estimates for Reinforcing Iron and Rebar Workers:
| Employment (1) | Employment RSE (3) |
Mean hourly wage |
Mean annual wage (2) |
Wage RSE (3) |
|---|---|---|---|---|
| 17,400 | 6.4 % | $ 28.99 | $ 60,290 | 2.4 % |
Percentile wage estimates for Reinforcing Iron and Rebar Workers:
| Percentile | 10% | 25% | 50% (Median) |
75% | 90% |
|---|---|---|---|---|---|
| Hourly Wage | $ 18.40 | $ 22.34 | $ 26.37 | $ 31.49 | $ 46.33 |
| Annual Wage (2) | $ 38,260 | $ 46,460 | $ 54,850 | $ 65,490 | $ 96,370 |
Industries with the highest published employment and wages for Reinforcing Iron and Rebar Workers are provided. For a list of all industries with employment in Reinforcing Iron and Rebar Workers, see the Create Customized Tables function.
Industries with the highest levels of employment in Reinforcing Iron and Rebar Workers:
| Industry | Employment (1) | Percent of industry employment | Hourly mean wage | Annual mean wage (2) |
|---|---|---|---|---|
| Foundation, Structure, and Building Exterior Contractors | 10,700 | 1.09 | $ 29.54 | $ 61,450 |
| Nonresidential Building Construction | 1,430 | 0.17 | $ 28.45 | $ 59,180 |
| Highway, Street, and Bridge Construction | 1,180 | 0.32 | $ 27.37 | $ 56,920 |
| Employment Services | 890 | 0.02 | $ 25.62 | $ 53,290 |
| Other Specialty Trade Contractors | 690 | 0.09 | $ 23.67 | $ 49,230 |
Industries with the highest concentration of employment in Reinforcing Iron and Rebar Workers:
| Industry | Employment (1) | Percent of industry employment | Hourly mean wage | Annual mean wage (2) |
|---|---|---|---|---|
| Foundation, Structure, and Building Exterior Contractors | 10,700 | 1.09 | $ 29.54 | $ 61,450 |
| Highway, Street, and Bridge Construction | 1,180 | 0.32 | $ 27.37 | $ 56,920 |
| Other Heavy and Civil Engineering Construction | 240 | 0.19 | $ 26.20 | $ 54,500 |
| Nonresidential Building Construction | 1,430 | 0.17 | $ 28.45 | $ 59,180 |
| Fabricated Metal Product Manufacturing (3323 and 3324 only) | 550 | 0.11 | $ 24.87 | $ 51,720 |
Top paying industries for Reinforcing Iron and Rebar Workers:
| Industry | Employment (1) | Percent of industry employment | Hourly mean wage | Annual mean wage (2) |
|---|---|---|---|---|
| Merchant Wholesalers, Durable Goods (4232, 4233, 4235, 4236, 4237, and 4239 only) | (8) | (8) | $ 39.85 | $ 82,890 |
| Foundation, Structure, and Building Exterior Contractors | 10,700 | 1.09 | $ 29.54 | $ 61,450 |
| Utility System Construction | 360 | 0.06 | $ 29.43 | $ 61,210 |
| Nonresidential Building Construction | 1,430 | 0.17 | $ 28.45 | $ 59,180 |
| Highway, Street, and Bridge Construction | 1,180 | 0.32 | $ 27.37 | $ 56,920 |
States and areas with the highest published employment, location quotients, and wages for Reinforcing Iron and Rebar Workers are provided. For a list of all areas with employment in Reinforcing Iron and Rebar Workers, see the Create Customized Tables function.
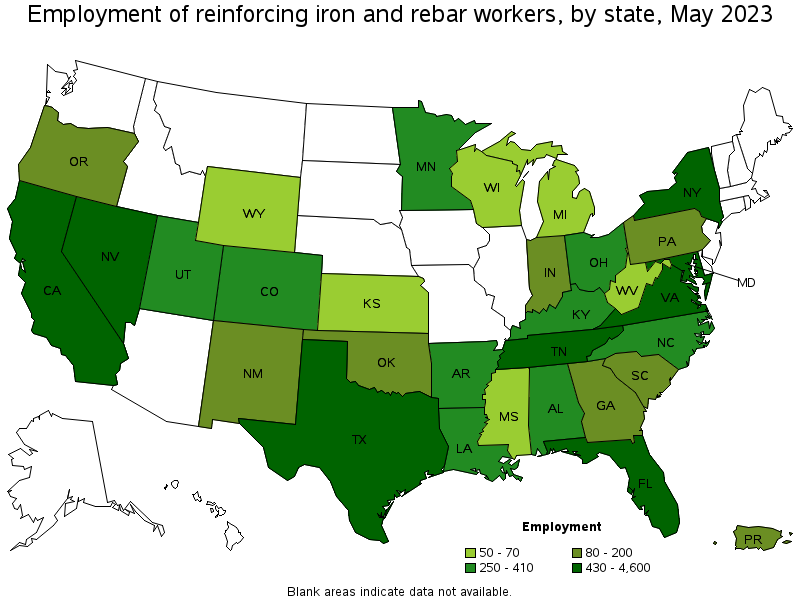
States with the highest employment level in Reinforcing Iron and Rebar Workers:
| State | Employment (1) | Employment per thousand jobs | Location quotient (9) | Hourly mean wage | Annual mean wage (2) |
|---|---|---|---|---|---|
| Texas | 4,600 | 0.34 | 2.96 | $ 22.88 | $ 47,590 |
| California | 2,400 | 0.13 | 1.17 | $ 31.78 | $ 66,110 |
| Maryland | 1,020 | 0.38 | 3.34 | $ 31.78 | $ 66,090 |
| Virginia | 870 | 0.22 | 1.90 | $ 26.98 | $ 56,110 |
| Florida | 630 | 0.07 | 0.58 | $ 23.26 | $ 48,390 |
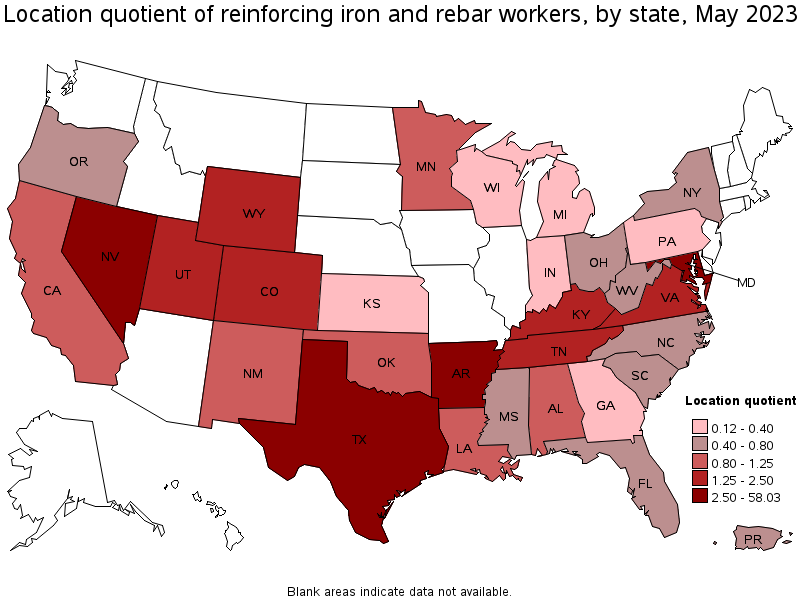
States with the highest concentration of jobs and location quotients in Reinforcing Iron and Rebar Workers:
| State | Employment (1) | Employment per thousand jobs | Location quotient (9) | Hourly mean wage | Annual mean wage (2) |
|---|---|---|---|---|---|
| Nevada | 570 | 0.38 | 3.34 | $ 39.83 | $ 82,840 |
| Maryland | 1,020 | 0.38 | 3.34 | $ 31.78 | $ 66,090 |
| Texas | 4,600 | 0.34 | 2.96 | $ 22.88 | $ 47,590 |
| Arkansas | 370 | 0.29 | 2.55 | $ 26.22 | $ 54,530 |
| Virginia | 870 | 0.22 | 1.90 | $ 26.98 | $ 56,110 |
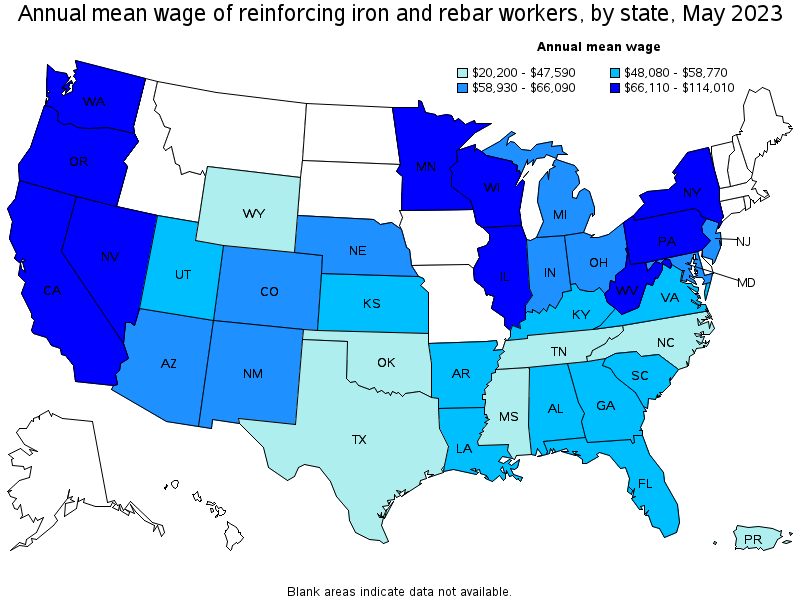
Top paying states for Reinforcing Iron and Rebar Workers:
| State | Employment (1) | Employment per thousand jobs | Location quotient (9) | Hourly mean wage | Annual mean wage (2) |
|---|---|---|---|---|---|
| Illinois | (8) | (8) | (8) | $ 54.81 | $ 114,010 |
| Washington | (8) | (8) | (8) | $ 48.84 | $ 101,590 |
| Pennsylvania | 80 | 0.01 | 0.12 | $ 44.20 | $ 91,930 |
| Minnesota | 360 | 0.12 | 1.08 | $ 40.76 | $ 84,780 |
| Nevada | 570 | 0.38 | 3.34 | $ 39.83 | $ 82,840 |
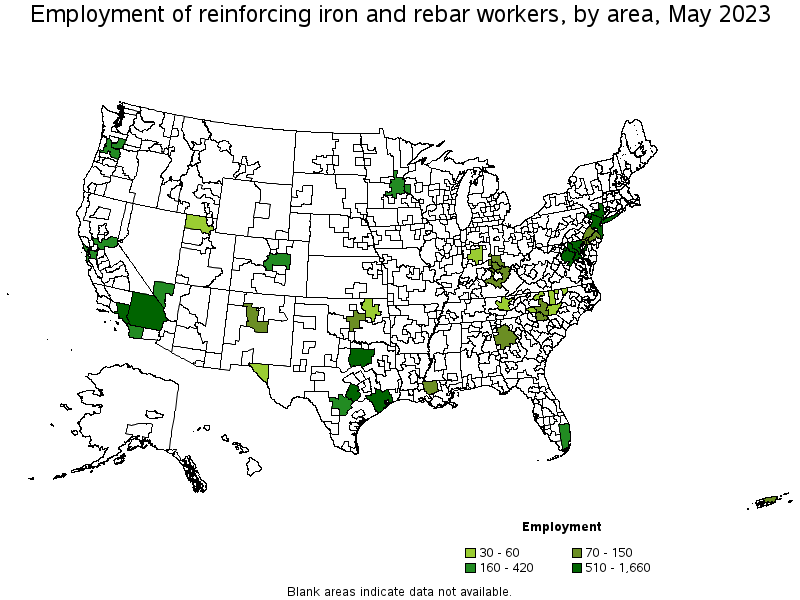
Metropolitan areas with the highest employment level in Reinforcing Iron and Rebar Workers:
| Metropolitan area | Employment (1) | Employment per thousand jobs | Location quotient (9) | Hourly mean wage | Annual mean wage (2) |
|---|---|---|---|---|---|
| Houston-The Woodlands-Sugar Land, TX | 1,660 | 0.52 | 4.57 | $ 23.08 | $ 48,010 |
| Dallas-Fort Worth-Arlington, TX | 1,430 | 0.36 | 3.14 | $ 23.39 | $ 48,660 |
| Washington-Arlington-Alexandria, DC-VA-MD-WV | 750 | 0.24 | 2.11 | $ 30.87 | $ 64,220 |
| New York-Newark-Jersey City, NY-NJ-PA | 730 | 0.08 | 0.68 | $ 37.80 | $ 78,610 |
| Riverside-San Bernardino-Ontario, CA | 730 | 0.44 | 3.84 | $ 32.75 | $ 68,130 |
| Los Angeles-Long Beach-Anaheim, CA | 730 | 0.12 | 1.03 | $ 32.12 | $ 66,820 |
| Austin-Round Rock, TX | 530 | 0.43 | 3.76 | $ 22.11 | $ 46,000 |
| Baltimore-Columbia-Towson, MD | 510 | 0.39 | 3.38 | $ 31.58 | $ 65,680 |
| Las Vegas-Henderson-Paradise, NV | 420 | 0.39 | 3.41 | $ 40.06 | $ 83,320 |
| San Antonio-New Braunfels, TX | 300 | 0.28 | 2.40 | $ 22.88 | $ 47,590 |
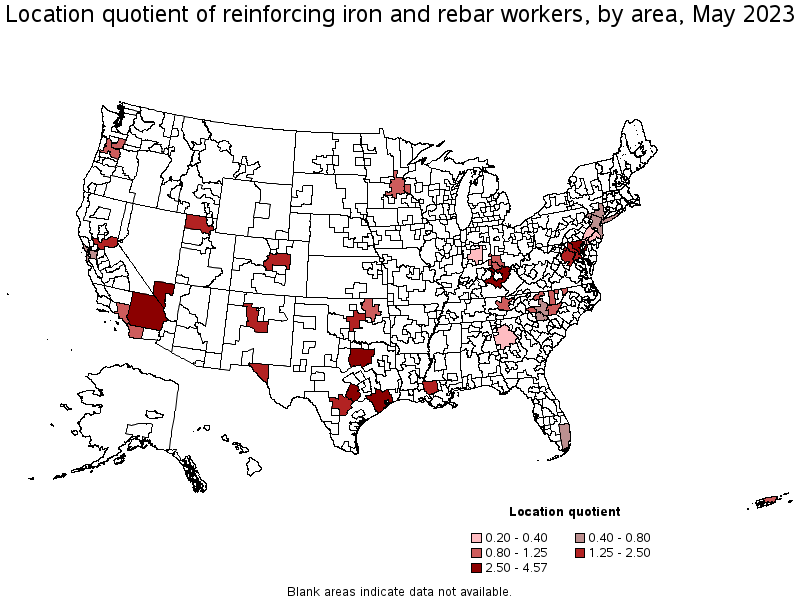
Metropolitan areas with the highest concentration of jobs and location quotients in Reinforcing Iron and Rebar Workers:
| Metropolitan area | Employment (1) | Employment per thousand jobs | Location quotient (9) | Hourly mean wage | Annual mean wage (2) |
|---|---|---|---|---|---|
| Houston-The Woodlands-Sugar Land, TX | 1,660 | 0.52 | 4.57 | $ 23.08 | $ 48,010 |
| Riverside-San Bernardino-Ontario, CA | 730 | 0.44 | 3.84 | $ 32.75 | $ 68,130 |
| Austin-Round Rock, TX | 530 | 0.43 | 3.76 | $ 22.11 | $ 46,000 |
| Las Vegas-Henderson-Paradise, NV | 420 | 0.39 | 3.41 | $ 40.06 | $ 83,320 |
| Baltimore-Columbia-Towson, MD | 510 | 0.39 | 3.38 | $ 31.58 | $ 65,680 |
| Dallas-Fort Worth-Arlington, TX | 1,430 | 0.36 | 3.14 | $ 23.39 | $ 48,660 |
| San Antonio-New Braunfels, TX | 300 | 0.28 | 2.40 | $ 22.88 | $ 47,590 |
| Washington-Arlington-Alexandria, DC-VA-MD-WV | 750 | 0.24 | 2.11 | $ 30.87 | $ 64,220 |
| Baton Rouge, LA | 90 | 0.23 | 2.03 | $ 26.53 | $ 55,190 |
| Sacramento--Roseville--Arden-Arcade, CA | 240 | 0.23 | 2.02 | $ 30.60 | $ 63,650 |
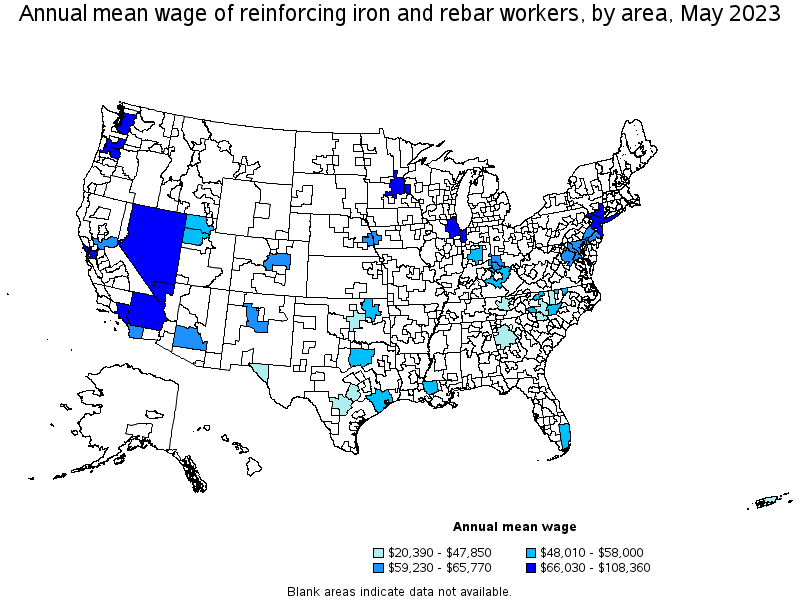
Top paying metropolitan areas for Reinforcing Iron and Rebar Workers:
| Metropolitan area | Employment (1) | Employment per thousand jobs | Location quotient (9) | Hourly mean wage | Annual mean wage (2) |
|---|---|---|---|---|---|
| Chicago-Naperville-Elgin, IL-IN-WI | (8) | (8) | (8) | $ 52.09 | $ 108,360 |
| Seattle-Tacoma-Bellevue, WA | (8) | (8) | (8) | $ 50.47 | $ 104,990 |
| Minneapolis-St. Paul-Bloomington, MN-WI | 270 | 0.14 | 1.24 | $ 41.80 | $ 86,930 |
| Portland-Vancouver-Hillsboro, OR-WA | 160 | 0.13 | 1.14 | $ 41.33 | $ 85,970 |
| Las Vegas-Henderson-Paradise, NV | 420 | 0.39 | 3.41 | $ 40.06 | $ 83,320 |
| New York-Newark-Jersey City, NY-NJ-PA | 730 | 0.08 | 0.68 | $ 37.80 | $ 78,610 |
| Riverside-San Bernardino-Ontario, CA | 730 | 0.44 | 3.84 | $ 32.75 | $ 68,130 |
| Los Angeles-Long Beach-Anaheim, CA | 730 | 0.12 | 1.03 | $ 32.12 | $ 66,820 |
| San Francisco-Oakland-Hayward, CA | 170 | 0.07 | 0.61 | $ 31.75 | $ 66,030 |
| Omaha-Council Bluffs, NE-IA | (8) | (8) | (8) | $ 31.62 | $ 65,770 |
Nonmetropolitan areas with the highest employment in Reinforcing Iron and Rebar Workers:
| Nonmetropolitan area | Employment (1) | Employment per thousand jobs | Location quotient (9) | Hourly mean wage | Annual mean wage (2) |
|---|---|---|---|---|---|
| Central Kentucky nonmetropolitan area | 90 | 0.47 | 4.07 | $ 26.57 | $ 55,270 |
| Piedmont North Carolina nonmetropolitan area | 30 | 0.13 | 1.15 | $ 24.96 | $ 51,920 |
Nonmetropolitan areas with the highest concentration of jobs and location quotients in Reinforcing Iron and Rebar Workers:
| Nonmetropolitan area | Employment (1) | Employment per thousand jobs | Location quotient (9) | Hourly mean wage | Annual mean wage (2) |
|---|---|---|---|---|---|
| Central Kentucky nonmetropolitan area | 90 | 0.47 | 4.07 | $ 26.57 | $ 55,270 |
| Piedmont North Carolina nonmetropolitan area | 30 | 0.13 | 1.15 | $ 24.96 | $ 51,920 |
Top paying nonmetropolitan areas for Reinforcing Iron and Rebar Workers:
| Nonmetropolitan area | Employment (1) | Employment per thousand jobs | Location quotient (9) | Hourly mean wage | Annual mean wage (2) |
|---|---|---|---|---|---|
| Nevada nonmetropolitan area | (8) | (8) | (8) | $ 38.95 | $ 81,010 |
| Central Kentucky nonmetropolitan area | 90 | 0.47 | 4.07 | $ 26.57 | $ 55,270 |
| Piedmont North Carolina nonmetropolitan area | 30 | 0.13 | 1.15 | $ 24.96 | $ 51,920 |
These estimates are calculated with data collected from employers in all industry sectors, all metropolitan and nonmetropolitan areas, and all states and the District of Columbia. The top employment and wage figures are provided above. The complete list is available in the downloadable XLS files.
The percentile wage estimate is the value of a wage below which a certain percent of workers fall. The median wage is the 50th percentile wage estimate—50 percent of workers earn less than the median and 50 percent of workers earn more than the median. More about percentile wages.
(1) Estimates for detailed occupations do not sum to the totals because the totals include occupations not shown separately. Estimates do not include self-employed workers.
(2) Annual wages have been calculated by multiplying the hourly mean wage by a "year-round, full-time" hours figure of 2,080 hours; for those occupations where there is not an hourly wage published, the annual wage has been directly calculated from the reported survey data.
(3) The relative standard error (RSE) is a measure of the reliability of a survey statistic. The smaller the relative standard error, the more precise the estimate.
(8) Estimate not released.
(9) The location quotient is the ratio of the area concentration of occupational employment to the national average concentration. A location quotient greater than one indicates the occupation has a higher share of employment than average, and a location quotient less than one indicates the occupation is less prevalent in the area than average.
Other OEWS estimates and related information:
May 2023 National Occupational Employment and Wage Estimates
May 2023 State Occupational Employment and Wage Estimates
May 2023 Metropolitan and Nonmetropolitan Area Occupational Employment and Wage Estimates
May 2023 National Industry-Specific Occupational Employment and Wage Estimates
Last Modified Date: April 3, 2024