
An official website of the United States government
An official website of the United States government
The .gov means it's official.
Federal government websites often end in .gov or .mil. Before sharing sensitive information,
make sure you're on a federal government site.
The site is secure.
The
https:// ensures that you are connecting to the official website and that any
information you provide is encrypted and transmitted securely.
Inspect structures using engineering skills to determine structural soundness and compliance with specifications, building codes, and other regulations. Inspections may be general in nature or may be limited to a specific area, such as electrical systems or plumbing.
Employment estimate and mean wage estimates for Construction and Building Inspectors:
| Employment (1) | Employment RSE (3) |
Mean hourly wage |
Mean annual wage (2) |
Wage RSE (3) |
|---|---|---|---|---|
| 133,640 | 1.3 % | $ 35.04 | $ 72,880 | 0.6 % |
Percentile wage estimates for Construction and Building Inspectors:
| Percentile | 10% | 25% | 50% (Median) |
75% | 90% |
|---|---|---|---|---|---|
| Hourly Wage | $ 21.03 | $ 25.67 | $ 32.55 | $ 41.60 | $ 51.06 |
| Annual Wage (2) | $ 43,740 | $ 53,400 | $ 67,700 | $ 86,530 | $ 106,200 |
Industries with the highest published employment and wages for Construction and Building Inspectors are provided. For a list of all industries with employment in Construction and Building Inspectors, see the Create Customized Tables function.
Industries with the highest levels of employment in Construction and Building Inspectors:
| Industry | Employment (1) | Percent of industry employment | Hourly mean wage | Annual mean wage (2) |
|---|---|---|---|---|
| Local Government, excluding Schools and Hospitals (OEWS Designation) | 48,800 | 0.89 | $ 34.54 | $ 71,840 |
| Architectural, Engineering, and Related Services | 40,640 | 2.47 | $ 35.45 | $ 73,740 |
| Other Professional, Scientific, and Technical Services | 6,090 | 0.71 | $ 35.43 | $ 73,690 |
| State Government, excluding Schools and Hospitals (OEWS Designation) | 5,350 | 0.25 | $ 33.15 | $ 68,950 |
| Building Equipment Contractors | 4,900 | 0.20 | $ 29.92 | $ 62,230 |
Industries with the highest concentration of employment in Construction and Building Inspectors:
| Industry | Employment (1) | Percent of industry employment | Hourly mean wage | Annual mean wage (2) |
|---|---|---|---|---|
| Architectural, Engineering, and Related Services | 40,640 | 2.47 | $ 35.45 | $ 73,740 |
| Natural Gas Distribution | 1,030 | 0.92 | $ 50.97 | $ 106,010 |
| Local Government, excluding Schools and Hospitals (OEWS Designation) | 48,800 | 0.89 | $ 34.54 | $ 71,840 |
| Other Professional, Scientific, and Technical Services | 6,090 | 0.71 | $ 35.43 | $ 73,690 |
| Utility System Construction | 2,800 | 0.49 | $ 40.30 | $ 83,830 |
Top paying industries for Construction and Building Inspectors:
| Industry | Employment (1) | Percent of industry employment | Hourly mean wage | Annual mean wage (2) |
|---|---|---|---|---|
| Natural Gas Distribution | 1,030 | 0.92 | $ 50.97 | $ 106,010 |
| Electric Power Generation, Transmission and Distribution | 1,600 | 0.41 | $ 50.82 | $ 105,700 |
| Pipeline Transportation of Natural Gas | 130 | 0.40 | $ 46.10 | $ 95,880 |
| Scientific Research and Development Services | 60 | 0.01 | $ 44.45 | $ 92,460 |
| Agencies, Brokerages, and Other Insurance Related Activities | 150 | 0.01 | $ 44.11 | $ 91,750 |
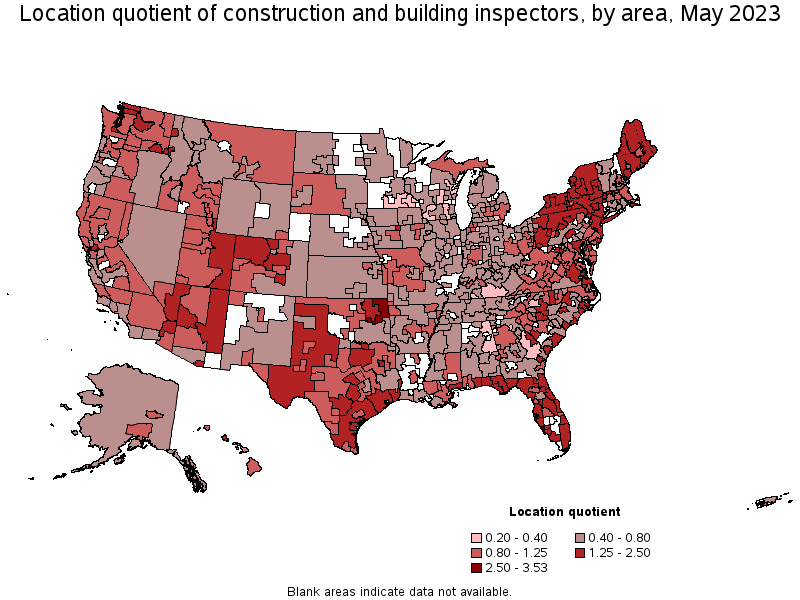
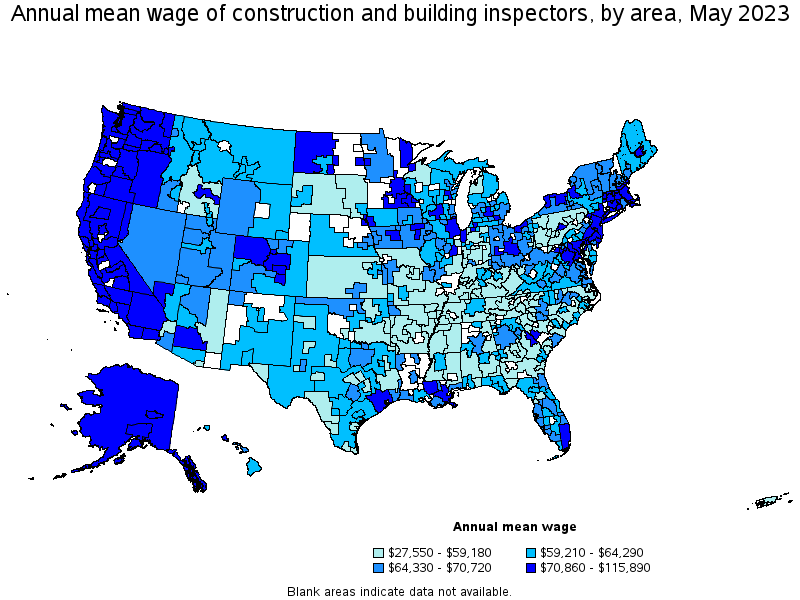
States and areas with the highest published employment, location quotients, and wages for Construction and Building Inspectors are provided. For a list of all areas with employment in Construction and Building Inspectors, see the Create Customized Tables function.
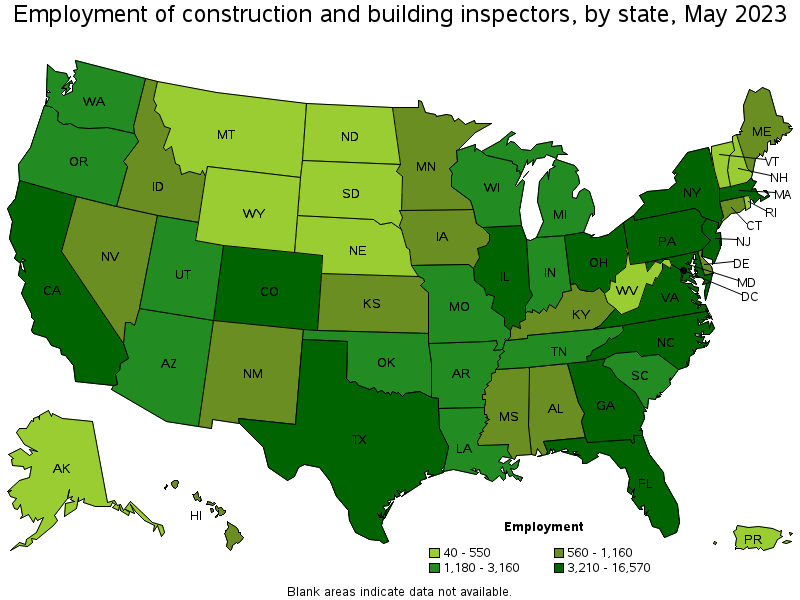
States with the highest employment level in Construction and Building Inspectors:
| State | Employment (1) | Employment per thousand jobs | Location quotient (9) | Hourly mean wage | Annual mean wage (2) |
|---|---|---|---|---|---|
| Texas | 16,570 | 1.22 | 1.39 | $ 32.03 | $ 66,610 |
| California | 12,850 | 0.72 | 0.81 | $ 46.37 | $ 96,460 |
| Florida | 12,050 | 1.26 | 1.43 | $ 31.80 | $ 66,130 |
| New York | 10,580 | 1.13 | 1.28 | $ 40.12 | $ 83,450 |
| New Jersey | 6,620 | 1.57 | 1.79 | $ 39.23 | $ 81,600 |
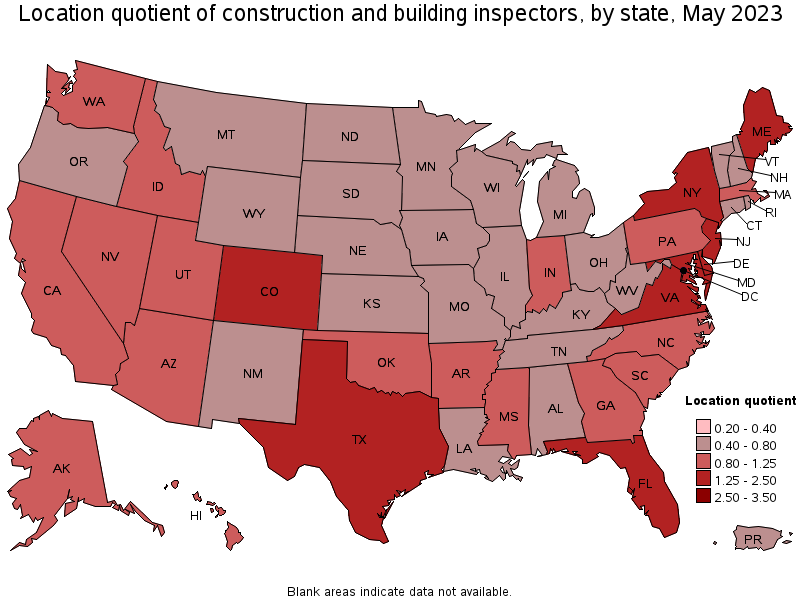
States with the highest concentration of jobs and location quotients in Construction and Building Inspectors:
| State | Employment (1) | Employment per thousand jobs | Location quotient (9) | Hourly mean wage | Annual mean wage (2) |
|---|---|---|---|---|---|
| New Jersey | 6,620 | 1.57 | 1.79 | $ 39.23 | $ 81,600 |
| Delaware | 640 | 1.37 | 1.56 | $ 33.35 | $ 69,360 |
| Maryland | 3,590 | 1.34 | 1.53 | $ 34.17 | $ 71,070 |
| Maine | 810 | 1.30 | 1.48 | $ 31.89 | $ 66,330 |
| Florida | 12,050 | 1.26 | 1.43 | $ 31.80 | $ 66,130 |
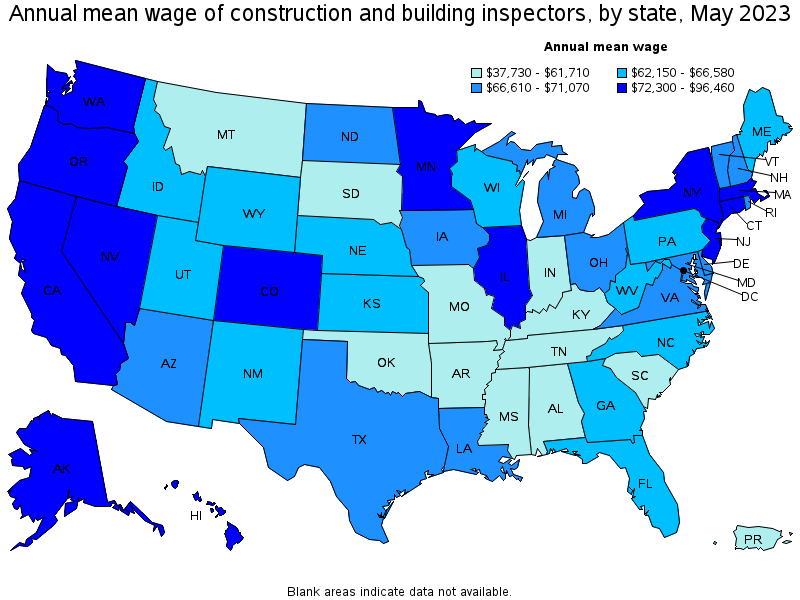
Top paying states for Construction and Building Inspectors:
| State | Employment (1) | Employment per thousand jobs | Location quotient (9) | Hourly mean wage | Annual mean wage (2) |
|---|---|---|---|---|---|
| California | 12,850 | 0.72 | 0.81 | $ 46.37 | $ 96,460 |
| District of Columbia | 310 | 0.44 | 0.50 | $ 45.06 | $ 93,730 |
| Connecticut | 850 | 0.51 | 0.58 | $ 43.69 | $ 90,880 |
| Alaska | 230 | 0.72 | 0.82 | $ 42.65 | $ 88,720 |
| Washington | 3,160 | 0.90 | 1.03 | $ 40.88 | $ 85,040 |
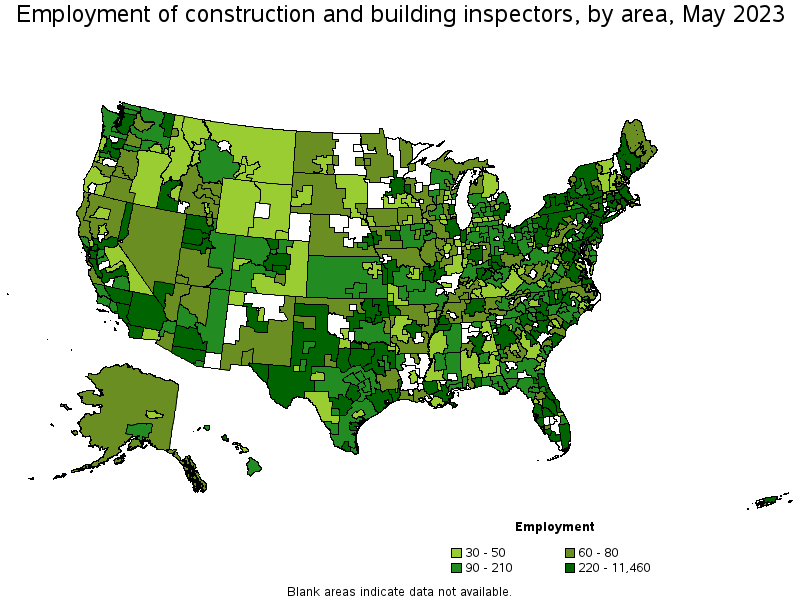
Metropolitan areas with the highest employment level in Construction and Building Inspectors:
| Metropolitan area | Employment (1) | Employment per thousand jobs | Location quotient (9) | Hourly mean wage | Annual mean wage (2) |
|---|---|---|---|---|---|
| New York-Newark-Jersey City, NY-NJ-PA | 11,460 | 1.21 | 1.37 | $ 42.01 | $ 87,380 |
| Houston-The Woodlands-Sugar Land, TX | 4,850 | 1.53 | 1.73 | $ 34.57 | $ 71,900 |
| Dallas-Fort Worth-Arlington, TX | 4,460 | 1.13 | 1.28 | $ 33.05 | $ 68,750 |
| Los Angeles-Long Beach-Anaheim, CA | 3,880 | 0.63 | 0.71 | $ 46.05 | $ 95,790 |
| Miami-Fort Lauderdale-West Palm Beach, FL | 3,130 | 1.15 | 1.31 | $ 35.04 | $ 72,890 |
| Washington-Arlington-Alexandria, DC-VA-MD-WV | 2,820 | 0.91 | 1.04 | $ 36.50 | $ 75,910 |
| Chicago-Naperville-Elgin, IL-IN-WI | 2,710 | 0.60 | 0.68 | $ 37.53 | $ 78,070 |
| Atlanta-Sandy Springs-Roswell, GA | 2,390 | 0.85 | 0.96 | $ 33.05 | $ 68,750 |
| Philadelphia-Camden-Wilmington, PA-NJ-DE-MD | 2,310 | 0.82 | 0.93 | $ 34.55 | $ 71,870 |
| Baltimore-Columbia-Towson, MD | 2,300 | 1.76 | 2.00 | $ 35.23 | $ 73,270 |
Metropolitan areas with the highest concentration of jobs and location quotients in Construction and Building Inspectors:
| Metropolitan area | Employment (1) | Employment per thousand jobs | Location quotient (9) | Hourly mean wage | Annual mean wage (2) |
|---|---|---|---|---|---|
| Trenton, NJ | 650 | 2.70 | 3.07 | $ 37.76 | $ 78,540 |
| Augusta-Richmond County, GA-SC | 460 | 2.01 | 2.29 | $ 34.16 | $ 71,040 |
| Vallejo-Fairfield, CA | 270 | 1.98 | 2.25 | $ 49.46 | $ 102,870 |
| Panama City, FL | 170 | 1.97 | 2.24 | $ 30.35 | $ 63,120 |
| Dover, DE | 130 | 1.97 | 2.23 | $ 31.86 | $ 66,270 |
| Cape Coral-Fort Myers, FL | 570 | 1.95 | 2.22 | $ 31.02 | $ 64,520 |
| Beaumont-Port Arthur, TX | 300 | 1.95 | 2.22 | $ 33.30 | $ 69,260 |
| Watertown-Fort Drum, NY | 70 | 1.89 | 2.14 | $ 32.77 | $ 68,160 |
| Altoona, PA | 110 | 1.88 | 2.13 | $ 27.67 | $ 57,560 |
| Baltimore-Columbia-Towson, MD | 2,300 | 1.76 | 2.00 | $ 35.23 | $ 73,270 |
Top paying metropolitan areas for Construction and Building Inspectors:
| Metropolitan area | Employment (1) | Employment per thousand jobs | Location quotient (9) | Hourly mean wage | Annual mean wage (2) |
|---|---|---|---|---|---|
| San Francisco-Oakland-Hayward, CA | 2,150 | 0.89 | 1.01 | $ 55.72 | $ 115,890 |
| San Jose-Sunnyvale-Santa Clara, CA | 740 | 0.65 | 0.74 | $ 52.83 | $ 109,880 |
| Santa Cruz-Watsonville, CA | 60 | 0.63 | 0.72 | $ 51.74 | $ 107,620 |
| Santa Rosa, CA | 150 | 0.74 | 0.84 | $ 51.72 | $ 107,570 |
| Santa Maria-Santa Barbara, CA | 130 | 0.62 | 0.71 | $ 49.89 | $ 103,770 |
| Vallejo-Fairfield, CA | 270 | 1.98 | 2.25 | $ 49.46 | $ 102,870 |
| Napa, CA | 40 | 0.57 | 0.65 | $ 47.59 | $ 98,990 |
| Bridgeport-Stamford-Norwalk, CT | 160 | 0.41 | 0.46 | $ 46.55 | $ 96,820 |
| Los Angeles-Long Beach-Anaheim, CA | 3,880 | 0.63 | 0.71 | $ 46.05 | $ 95,790 |
| Stockton-Lodi, CA | 160 | 0.58 | 0.66 | $ 45.83 | $ 95,320 |
Nonmetropolitan areas with the highest employment in Construction and Building Inspectors:
| Nonmetropolitan area | Employment (1) | Employment per thousand jobs | Location quotient (9) | Hourly mean wage | Annual mean wage (2) |
|---|---|---|---|---|---|
| Northeast Oklahoma nonmetropolitan area | 360 | 3.10 | 3.53 | $ 28.47 | $ 59,210 |
| West Texas Region of Texas nonmetropolitan area | 300 | 1.53 | 1.74 | $ 30.75 | $ 63,950 |
| Southwest Maine nonmetropolitan area | 270 | 1.41 | 1.61 | $ 29.84 | $ 62,060 |
| Central East New York nonmetropolitan area | 250 | 1.58 | 1.79 | $ 30.90 | $ 64,280 |
| Southwest New York nonmetropolitan area | 250 | 1.45 | 1.65 | $ 32.83 | $ 68,290 |
Nonmetropolitan areas with the highest concentration of jobs and location quotients in Construction and Building Inspectors:
| Nonmetropolitan area | Employment (1) | Employment per thousand jobs | Location quotient (9) | Hourly mean wage | Annual mean wage (2) |
|---|---|---|---|---|---|
| Northeast Oklahoma nonmetropolitan area | 360 | 3.10 | 3.53 | $ 28.47 | $ 59,210 |
| Capital/Northern New York nonmetropolitan area | 230 | 1.65 | 1.87 | $ 31.13 | $ 64,750 |
| Western Pennsylvania nonmetropolitan area | 220 | 1.61 | 1.83 | $ 27.40 | $ 57,000 |
| Central East New York nonmetropolitan area | 250 | 1.58 | 1.79 | $ 30.90 | $ 64,280 |
| Eastern Utah nonmetropolitan area | 140 | 1.57 | 1.78 | $ 31.70 | $ 65,930 |
Top paying nonmetropolitan areas for Construction and Building Inspectors:
| Nonmetropolitan area | Employment (1) | Employment per thousand jobs | Location quotient (9) | Hourly mean wage | Annual mean wage (2) |
|---|---|---|---|---|---|
| Eastern Washington nonmetropolitan area | 90 | 0.86 | 0.98 | $ 40.85 | $ 84,970 |
| Eastern Oregon nonmetropolitan area | 50 | 0.65 | 0.74 | $ 40.69 | $ 84,640 |
| Eastern Sierra-Mother Lode Region of California nonmetropolitan area | 50 | 0.80 | 0.91 | $ 40.61 | $ 84,460 |
| Alaska nonmetropolitan area | 70 | 0.64 | 0.73 | $ 40.45 | $ 84,140 |
| Coast Oregon nonmetropolitan area | 40 | 0.35 | 0.40 | $ 40.32 | $ 83,860 |
These estimates are calculated with data collected from employers in all industry sectors, all metropolitan and nonmetropolitan areas, and all states and the District of Columbia. The top employment and wage figures are provided above. The complete list is available in the downloadable XLS files.
The percentile wage estimate is the value of a wage below which a certain percent of workers fall. The median wage is the 50th percentile wage estimate—50 percent of workers earn less than the median and 50 percent of workers earn more than the median. More about percentile wages.
(1) Estimates for detailed occupations do not sum to the totals because the totals include occupations not shown separately. Estimates do not include self-employed workers.
(2) Annual wages have been calculated by multiplying the hourly mean wage by a "year-round, full-time" hours figure of 2,080 hours; for those occupations where there is not an hourly wage published, the annual wage has been directly calculated from the reported survey data.
(3) The relative standard error (RSE) is a measure of the reliability of a survey statistic. The smaller the relative standard error, the more precise the estimate.
(9) The location quotient is the ratio of the area concentration of occupational employment to the national average concentration. A location quotient greater than one indicates the occupation has a higher share of employment than average, and a location quotient less than one indicates the occupation is less prevalent in the area than average.
Other OEWS estimates and related information:
May 2023 National Occupational Employment and Wage Estimates
May 2023 State Occupational Employment and Wage Estimates
May 2023 Metropolitan and Nonmetropolitan Area Occupational Employment and Wage Estimates
May 2023 National Industry-Specific Occupational Employment and Wage Estimates
Last Modified Date: April 3, 2024