
An official website of the United States government
An official website of the United States government
The .gov means it's official.
Federal government websites often end in .gov or .mil. Before sharing sensitive information,
make sure you're on a federal government site.
The site is secure.
The
https:// ensures that you are connecting to the official website and that any
information you provide is encrypted and transmitted securely.
Repair, maintain, or install computers, word processing systems, automated teller machines, and electronic office machines, such as duplicating and fax machines.
Employment estimate and mean wage estimates for Computer, Automated Teller, and Office Machine Repairers:
| Employment (1) | Employment RSE (3) |
Mean hourly wage |
Mean annual wage (2) |
Wage RSE (3) |
|---|---|---|---|---|
| 77,580 | 2.0 % | $ 23.22 | $ 48,290 | 0.6 % |
Percentile wage estimates for Computer, Automated Teller, and Office Machine Repairers:
| Percentile | 10% | 25% | 50% (Median) |
75% | 90% |
|---|---|---|---|---|---|
| Hourly Wage | $ 16.07 | $ 17.89 | $ 22.00 | $ 28.00 | $ 31.64 |
| Annual Wage (2) | $ 33,430 | $ 37,210 | $ 45,760 | $ 58,240 | $ 65,820 |
Industries with the highest published employment and wages for Computer, Automated Teller, and Office Machine Repairers are provided. For a list of all industries with employment in Computer, Automated Teller, and Office Machine Repairers, see the Create Customized Tables function.
Industries with the highest levels of employment in Computer, Automated Teller, and Office Machine Repairers:
| Industry | Employment (1) | Percent of industry employment | Hourly mean wage | Annual mean wage (2) |
|---|---|---|---|---|
| Electronics and Appliance Retailers | 23,100 | 5.60 | $ 20.93 | $ 43,540 |
| Professional and Commercial Equipment and Supplies Merchant Wholesalers | 19,900 | 2.70 | $ 24.56 | $ 51,090 |
| Electronic and Precision Equipment Repair and Maintenance | 11,980 | 11.38 | $ 22.87 | $ 47,560 |
| Computer Systems Design and Related Services | 6,470 | 0.26 | $ 24.41 | $ 50,770 |
| Miscellaneous Store Retailers (4594 and 4595 only) | 2,630 | 0.64 | $ 21.36 | $ 44,430 |
Industries with the highest concentration of employment in Computer, Automated Teller, and Office Machine Repairers:
| Industry | Employment (1) | Percent of industry employment | Hourly mean wage | Annual mean wage (2) |
|---|---|---|---|---|
| Electronic and Precision Equipment Repair and Maintenance | 11,980 | 11.38 | $ 22.87 | $ 47,560 |
| Electronics and Appliance Retailers | 23,100 | 5.60 | $ 20.93 | $ 43,540 |
| Professional and Commercial Equipment and Supplies Merchant Wholesalers | 19,900 | 2.70 | $ 24.56 | $ 51,090 |
| Computer and Peripheral Equipment Manufacturing | 1,120 | 0.70 | $ 28.80 | $ 59,890 |
| Miscellaneous Store Retailers (4594 and 4595 only) | 2,630 | 0.64 | $ 21.36 | $ 44,430 |
Top paying industries for Computer, Automated Teller, and Office Machine Repairers:
| Industry | Employment (1) | Percent of industry employment | Hourly mean wage | Annual mean wage (2) |
|---|---|---|---|---|
| Navigational, Measuring, Electromedical, and Control Instruments Manufacturing | 40 | 0.01 | $ 41.05 | $ 85,390 |
| Communications Equipment Manufacturing | 180 | 0.21 | $ 35.80 | $ 74,470 |
| Securities, Commodity Contracts, and Other Financial Investments and Related Activities | 70 | 0.01 | $ 32.91 | $ 68,450 |
| Architectural, Engineering, and Related Services | (8) | (8) | $ 31.43 | $ 65,370 |
| Semiconductor and Other Electronic Component Manufacturing | (8) | (8) | $ 31.08 | $ 64,650 |
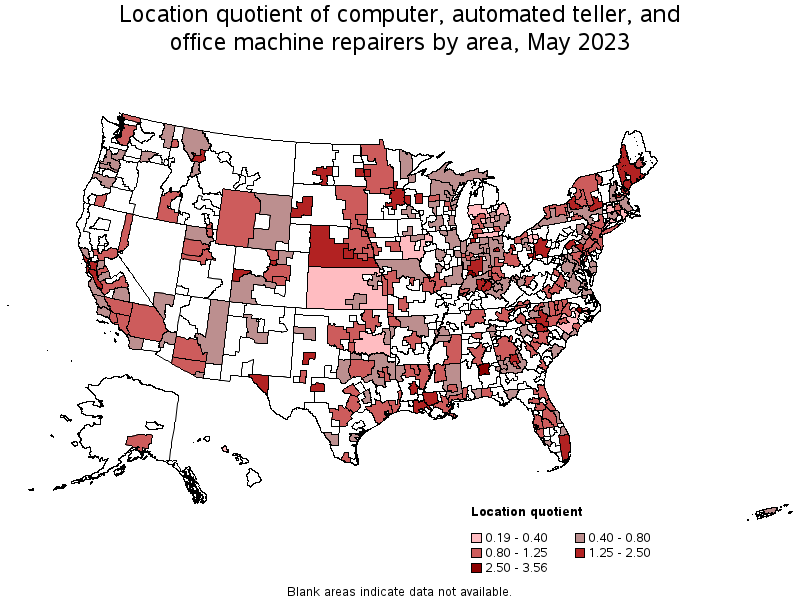
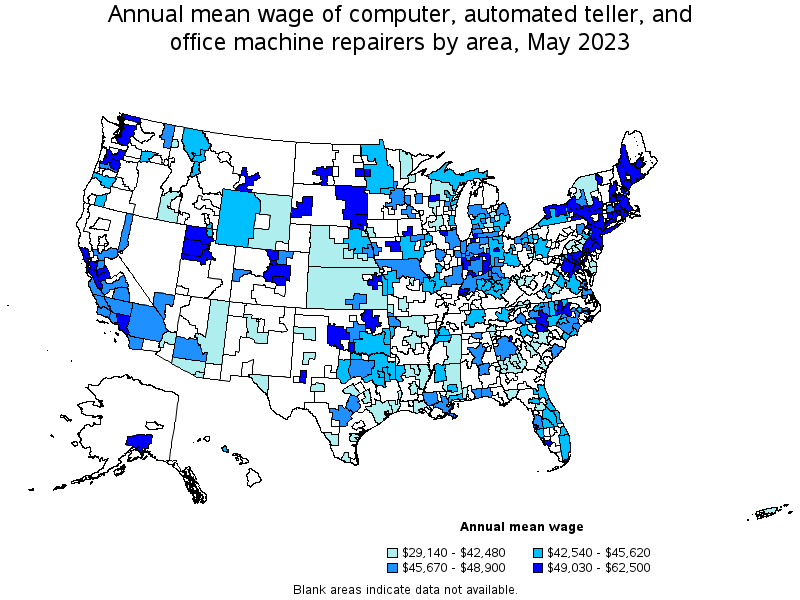
States and areas with the highest published employment, location quotients, and wages for Computer, Automated Teller, and Office Machine Repairers are provided. For a list of all areas with employment in Computer, Automated Teller, and Office Machine Repairers, see the Create Customized Tables function.
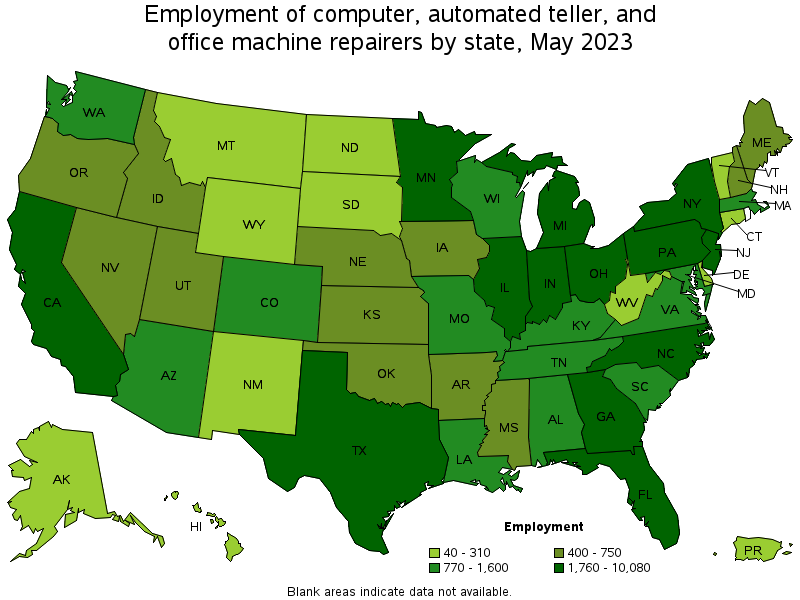
States with the highest employment level in Computer, Automated Teller, and Office Machine Repairers:
| State | Employment (1) | Employment per thousand jobs | Location quotient (9) | Hourly mean wage | Annual mean wage (2) |
|---|---|---|---|---|---|
| California | 10,080 | 0.56 | 1.10 | $ 25.43 | $ 52,900 |
| Texas | 7,520 | 0.55 | 1.09 | $ 21.01 | $ 43,690 |
| New York | 6,090 | 0.65 | 1.27 | $ 27.49 | $ 57,170 |
| Florida | 5,880 | 0.61 | 1.20 | $ 21.80 | $ 45,350 |
| New Jersey | 3,040 | 0.72 | 1.42 | $ 27.09 | $ 56,350 |
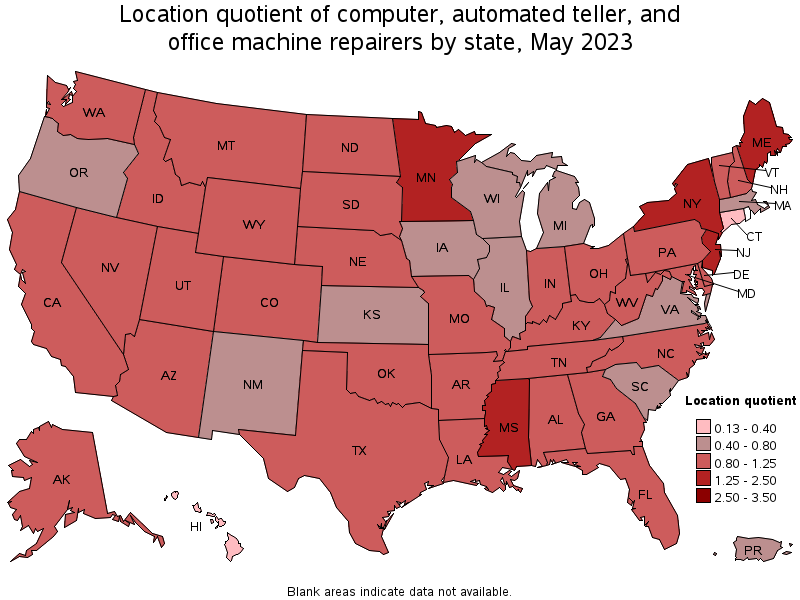
States with the highest concentration of jobs and location quotients in Computer, Automated Teller, and Office Machine Repairers:
| State | Employment (1) | Employment per thousand jobs | Location quotient (9) | Hourly mean wage | Annual mean wage (2) |
|---|---|---|---|---|---|
| Minnesota | 2,370 | 0.82 | 1.61 | $ 20.34 | $ 42,300 |
| New Jersey | 3,040 | 0.72 | 1.42 | $ 27.09 | $ 56,350 |
| Maine | 410 | 0.65 | 1.28 | $ 26.70 | $ 55,530 |
| New York | 6,090 | 0.65 | 1.27 | $ 27.49 | $ 57,170 |
| Mississippi | 750 | 0.65 | 1.27 | $ 21.69 | $ 45,110 |
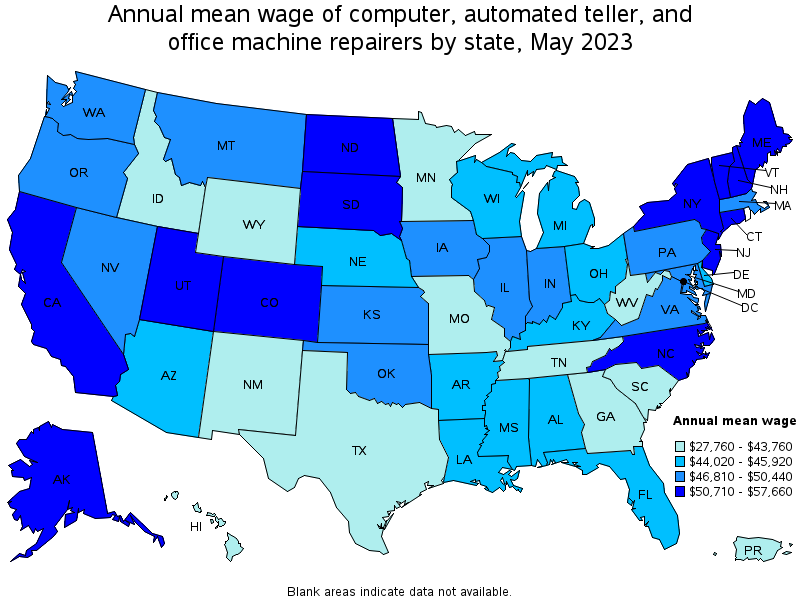
Top paying states for Computer, Automated Teller, and Office Machine Repairers:
| State | Employment (1) | Employment per thousand jobs | Location quotient (9) | Hourly mean wage | Annual mean wage (2) |
|---|---|---|---|---|---|
| Alaska | 140 | 0.45 | 0.88 | $ 27.72 | $ 57,660 |
| New York | 6,090 | 0.65 | 1.27 | $ 27.49 | $ 57,170 |
| New Jersey | 3,040 | 0.72 | 1.42 | $ 27.09 | $ 56,350 |
| Maine | 410 | 0.65 | 1.28 | $ 26.70 | $ 55,530 |
| South Dakota | 240 | 0.53 | 1.04 | $ 26.36 | $ 54,830 |
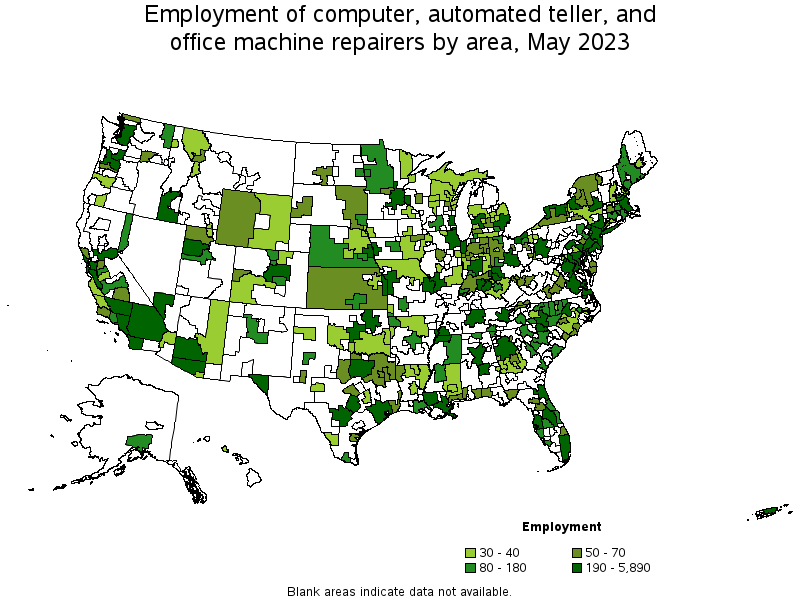
Metropolitan areas with the highest employment level in Computer, Automated Teller, and Office Machine Repairers:
| Metropolitan area | Employment (1) | Employment per thousand jobs | Location quotient (9) | Hourly mean wage | Annual mean wage (2) |
|---|---|---|---|---|---|
| New York-Newark-Jersey City, NY-NJ-PA | 5,890 | 0.62 | 1.21 | $ 28.69 | $ 59,680 |
| Los Angeles-Long Beach-Anaheim, CA | 2,570 | 0.42 | 0.81 | $ 24.11 | $ 50,150 |
| Dallas-Fort Worth-Arlington, TX | 2,440 | 0.62 | 1.21 | $ 22.11 | $ 45,990 |
| San Francisco-Oakland-Hayward, CA | 2,420 | 1.00 | 1.95 | $ 28.98 | $ 60,290 |
| Miami-Fort Lauderdale-West Palm Beach, FL | 2,010 | 0.74 | 1.45 | $ 21.62 | $ 44,970 |
| Houston-The Woodlands-Sugar Land, TX | 1,800 | 0.56 | 1.11 | $ 19.75 | $ 41,070 |
| Chicago-Naperville-Elgin, IL-IN-WI | 1,690 | 0.37 | 0.73 | $ 23.45 | $ 48,780 |
| Atlanta-Sandy Springs-Roswell, GA | 1,670 | 0.59 | 1.16 | $ 21.96 | $ 45,670 |
| Philadelphia-Camden-Wilmington, PA-NJ-DE-MD | 1,530 | 0.54 | 1.06 | $ 25.13 | $ 52,280 |
| Minneapolis-St. Paul-Bloomington, MN-WI | 1,270 | 0.66 | 1.30 | $ 22.50 | $ 46,800 |
Metropolitan areas with the highest concentration of jobs and location quotients in Computer, Automated Teller, and Office Machine Repairers:
| Metropolitan area | Employment (1) | Employment per thousand jobs | Location quotient (9) | Hourly mean wage | Annual mean wage (2) |
|---|---|---|---|---|---|
| Montgomery, AL | 290 | 1.82 | 3.56 | $ 23.05 | $ 47,930 |
| Bloomington, IN | 130 | 1.74 | 3.41 | $ 24.41 | $ 50,770 |
| Greenville, NC | 100 | 1.30 | 2.55 | $ 21.75 | $ 45,250 |
| Mansfield, OH | 50 | 1.14 | 2.22 | $ 21.12 | $ 43,930 |
| Wheeling, WV-OH | 60 | 1.09 | 2.14 | $ 18.28 | $ 38,020 |
| Lubbock, TX | 160 | 1.06 | 2.08 | $ 18.77 | $ 39,040 |
| San Francisco-Oakland-Hayward, CA | 2,420 | 1.00 | 1.95 | $ 28.98 | $ 60,290 |
| San Jose-Sunnyvale-Santa Clara, CA | 1,140 | 0.99 | 1.95 | $ 28.45 | $ 59,180 |
| Missoula, MT | 60 | 0.94 | 1.83 | $ 21.90 | $ 45,550 |
| Manchester, NH | 100 | 0.93 | 1.83 | $ 26.93 | $ 56,000 |
Top paying metropolitan areas for Computer, Automated Teller, and Office Machine Repairers:
| Metropolitan area | Employment (1) | Employment per thousand jobs | Location quotient (9) | Hourly mean wage | Annual mean wage (2) |
|---|---|---|---|---|---|
| San Francisco-Oakland-Hayward, CA | 2,420 | 1.00 | 1.95 | $ 28.98 | $ 60,290 |
| New York-Newark-Jersey City, NY-NJ-PA | 5,890 | 0.62 | 1.21 | $ 28.69 | $ 59,680 |
| Charlotte-Concord-Gastonia, NC-SC | 880 | 0.67 | 1.31 | $ 28.56 | $ 59,410 |
| San Jose-Sunnyvale-Santa Clara, CA | 1,140 | 0.99 | 1.95 | $ 28.45 | $ 59,180 |
| Anchorage, AK | 110 | 0.62 | 1.21 | $ 28.40 | $ 59,070 |
| Boulder, CO | 150 | 0.79 | 1.54 | $ 28.19 | $ 58,640 |
| Portland-South Portland, ME | 130 | 0.65 | 1.27 | $ 28.05 | $ 58,340 |
| Trenton, NJ | 110 | 0.45 | 0.89 | $ 27.35 | $ 56,900 |
| Sioux Falls, SD | 90 | 0.55 | 1.07 | $ 27.14 | $ 56,460 |
| Fort Collins, CO | 90 | 0.52 | 1.01 | $ 26.92 | $ 56,000 |
Nonmetropolitan areas with the highest employment in Computer, Automated Teller, and Office Machine Repairers:
| Nonmetropolitan area | Employment (1) | Employment per thousand jobs | Location quotient (9) | Hourly mean wage | Annual mean wage (2) |
|---|---|---|---|---|---|
| Southwest Maine nonmetropolitan area | 130 | 0.69 | 1.36 | $ 25.72 | $ 53,490 |
| Northeast Mississippi nonmetropolitan area | 130 | 0.56 | 1.09 | $ 18.52 | $ 38,520 |
| South Nebraska nonmetropolitan area | 110 | 0.74 | 1.45 | $ 20.39 | $ 42,410 |
| Piedmont North Carolina nonmetropolitan area | 100 | 0.41 | 0.80 | $ 21.16 | $ 44,010 |
| Northwest Minnesota nonmetropolitan area | 90 | 0.45 | 0.88 | $ 21.15 | $ 44,000 |
Nonmetropolitan areas with the highest concentration of jobs and location quotients in Computer, Automated Teller, and Office Machine Repairers:
| Nonmetropolitan area | Employment (1) | Employment per thousand jobs | Location quotient (9) | Hourly mean wage | Annual mean wage (2) |
|---|---|---|---|---|---|
| South Nebraska nonmetropolitan area | 110 | 0.74 | 1.45 | $ 20.39 | $ 42,410 |
| Southwest Maine nonmetropolitan area | 130 | 0.69 | 1.36 | $ 25.72 | $ 53,490 |
| Northeast Mississippi nonmetropolitan area | 130 | 0.56 | 1.09 | $ 18.52 | $ 38,520 |
| Southwest Oklahoma nonmetropolitan area | 30 | 0.56 | 1.09 | $ 30.05 | $ 62,500 |
| Capital/Northern New York nonmetropolitan area | 70 | 0.52 | 1.03 | $ 19.44 | $ 40,430 |
Top paying nonmetropolitan areas for Computer, Automated Teller, and Office Machine Repairers:
| Nonmetropolitan area | Employment (1) | Employment per thousand jobs | Location quotient (9) | Hourly mean wage | Annual mean wage (2) |
|---|---|---|---|---|---|
| Southwest Oklahoma nonmetropolitan area | 30 | 0.56 | 1.09 | $ 30.05 | $ 62,500 |
| East South Dakota nonmetropolitan area | 70 | 0.50 | 0.98 | $ 26.22 | $ 54,530 |
| Southwest Maine nonmetropolitan area | 130 | 0.69 | 1.36 | $ 25.72 | $ 53,490 |
| West Central-Southwest New Hampshire nonmetropolitan area | 40 | 0.38 | 0.74 | $ 24.77 | $ 51,520 |
| Central East New York nonmetropolitan area | 40 | 0.23 | 0.45 | $ 24.73 | $ 51,440 |
These estimates are calculated with data collected from employers in all industry sectors, all metropolitan and nonmetropolitan areas, and all states and the District of Columbia. The top employment and wage figures are provided above. The complete list is available in the downloadable XLS files.
The percentile wage estimate is the value of a wage below which a certain percent of workers fall. The median wage is the 50th percentile wage estimate—50 percent of workers earn less than the median and 50 percent of workers earn more than the median. More about percentile wages.
(1) Estimates for detailed occupations do not sum to the totals because the totals include occupations not shown separately. Estimates do not include self-employed workers.
(2) Annual wages have been calculated by multiplying the hourly mean wage by a "year-round, full-time" hours figure of 2,080 hours; for those occupations where there is not an hourly wage published, the annual wage has been directly calculated from the reported survey data.
(3) The relative standard error (RSE) is a measure of the reliability of a survey statistic. The smaller the relative standard error, the more precise the estimate.
(8) Estimate not released.
(9) The location quotient is the ratio of the area concentration of occupational employment to the national average concentration. A location quotient greater than one indicates the occupation has a higher share of employment than average, and a location quotient less than one indicates the occupation is less prevalent in the area than average.
Other OEWS estimates and related information:
May 2023 National Occupational Employment and Wage Estimates
May 2023 State Occupational Employment and Wage Estimates
May 2023 Metropolitan and Nonmetropolitan Area Occupational Employment and Wage Estimates
May 2023 National Industry-Specific Occupational Employment and Wage Estimates
Last Modified Date: April 3, 2024