
An official website of the United States government
An official website of the United States government
The .gov means it's official.
Federal government websites often end in .gov or .mil. Before sharing sensitive information,
make sure you're on a federal government site.
The site is secure.
The
https:// ensures that you are connecting to the official website and that any
information you provide is encrypted and transmitted securely.
Repair, test, adjust, or install electronic equipment, such as industrial controls, transmitters, and antennas. Excludes �Avionics Technicians� (49-2091), �Electrical and Electronics Installers and Repairers, Transportation Equipment� (49-2093), and �Electronic Equipment Installers and Repairers, Motor Vehicles� (49-2096).
Employment estimate and mean wage estimates for Electrical and Electronics Repairers, Commercial and Industrial Equipment:
| Employment (1) | Employment RSE (3) |
Mean hourly wage |
Mean annual wage (2) |
Wage RSE (3) |
|---|---|---|---|---|
| 58,320 | 2.0 % | $ 33.56 | $ 69,810 | 0.7 % |
Percentile wage estimates for Electrical and Electronics Repairers, Commercial and Industrial Equipment:
| Percentile | 10% | 25% | 50% (Median) |
75% | 90% |
|---|---|---|---|---|---|
| Hourly Wage | $ 20.00 | $ 25.65 | $ 32.06 | $ 39.10 | $ 48.32 |
| Annual Wage (2) | $ 41,600 | $ 53,350 | $ 66,680 | $ 81,330 | $ 100,510 |
Industries with the highest published employment and wages for Electrical and Electronics Repairers, Commercial and Industrial Equipment are provided. For a list of all industries with employment in Electrical and Electronics Repairers, Commercial and Industrial Equipment, see the Create Customized Tables function.
Industries with the highest levels of employment in Electrical and Electronics Repairers, Commercial and Industrial Equipment:
| Industry | Employment (1) | Percent of industry employment | Hourly mean wage | Annual mean wage (2) |
|---|---|---|---|---|
| Federal, State, and Local Government, excluding State and Local Government Schools and Hospitals and the U.S. Postal Service (OEWS Designation) | 7,850 | 0.37 | $ 35.85 | $ 74,570 |
| Warehousing and Storage | 3,860 | 0.20 | $ 32.28 | $ 67,140 |
| Electronic and Precision Equipment Repair and Maintenance | 2,940 | 2.79 | $ 24.35 | $ 50,650 |
| Merchant Wholesalers, Durable Goods (4232, 4233, 4235, 4236, 4237, and 4239 only) | 2,550 | 0.17 | $ 25.35 | $ 52,730 |
| Local Government, excluding Schools and Hospitals (OEWS Designation) | 2,520 | 0.05 | $ 36.20 | $ 75,300 |
Industries with the highest concentration of employment in Electrical and Electronics Repairers, Commercial and Industrial Equipment:
| Industry | Employment (1) | Percent of industry employment | Hourly mean wage | Annual mean wage (2) |
|---|---|---|---|---|
| Electronic and Precision Equipment Repair and Maintenance | 2,940 | 2.79 | $ 24.35 | $ 50,650 |
| Pipeline Transportation of Natural Gas | 450 | 1.37 | $ 47.94 | $ 99,720 |
| Pulp, Paper, and Paperboard Mills | 1,100 | 1.24 | $ 37.70 | $ 78,410 |
| Oil and Gas Extraction | 1,010 | 0.93 | $ 47.76 | $ 99,350 |
| Petroleum and Coal Products Manufacturing | 850 | 0.78 | $ 50.38 | $ 104,790 |
Top paying industries for Electrical and Electronics Repairers, Commercial and Industrial Equipment:
| Industry | Employment (1) | Percent of industry employment | Hourly mean wage | Annual mean wage (2) |
|---|---|---|---|---|
| Natural Gas Distribution | 360 | 0.32 | $ 53.02 | $ 110,270 |
| Personal and Household Goods Repair and Maintenance | 380 | 0.45 | $ 52.78 | $ 109,770 |
| Petroleum and Coal Products Manufacturing | 850 | 0.78 | $ 50.38 | $ 104,790 |
| Electric Power Generation, Transmission and Distribution | 1,050 | 0.27 | $ 49.77 | $ 103,530 |
| Other Pipeline Transportation | 60 | 0.68 | $ 49.00 | $ 101,920 |
States and areas with the highest published employment, location quotients, and wages for Electrical and Electronics Repairers, Commercial and Industrial Equipment are provided. For a list of all areas with employment in Electrical and Electronics Repairers, Commercial and Industrial Equipment, see the Create Customized Tables function.
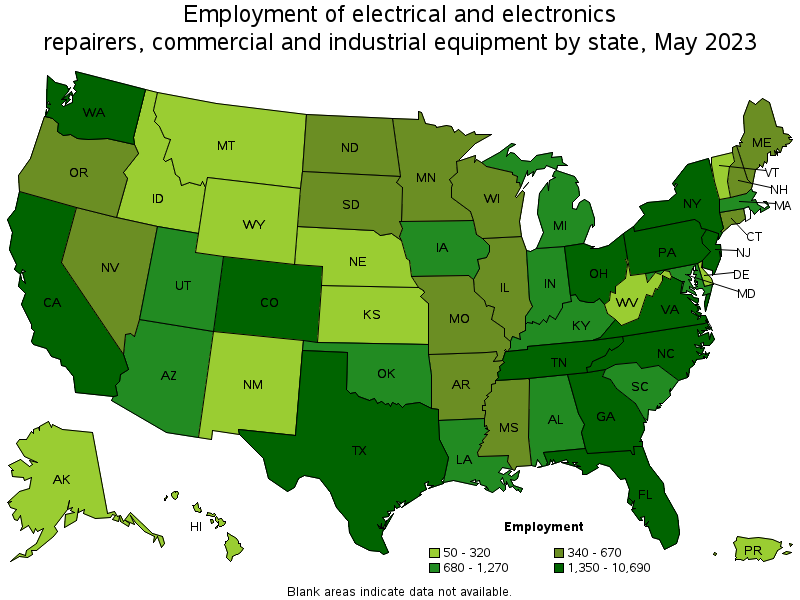
States with the highest employment level in Electrical and Electronics Repairers, Commercial and Industrial Equipment:
| State | Employment (1) | Employment per thousand jobs | Location quotient (9) | Hourly mean wage | Annual mean wage (2) |
|---|---|---|---|---|---|
| Texas | 10,690 | 0.79 | 2.05 | $ 35.80 | $ 74,470 |
| California | 6,360 | 0.35 | 0.92 | $ 35.22 | $ 73,250 |
| Florida | 3,860 | 0.40 | 1.05 | $ 28.45 | $ 59,170 |
| Pennsylvania | 3,240 | 0.55 | 1.42 | $ 31.59 | $ 65,710 |
| Georgia | 2,300 | 0.48 | 1.26 | $ 32.53 | $ 67,660 |
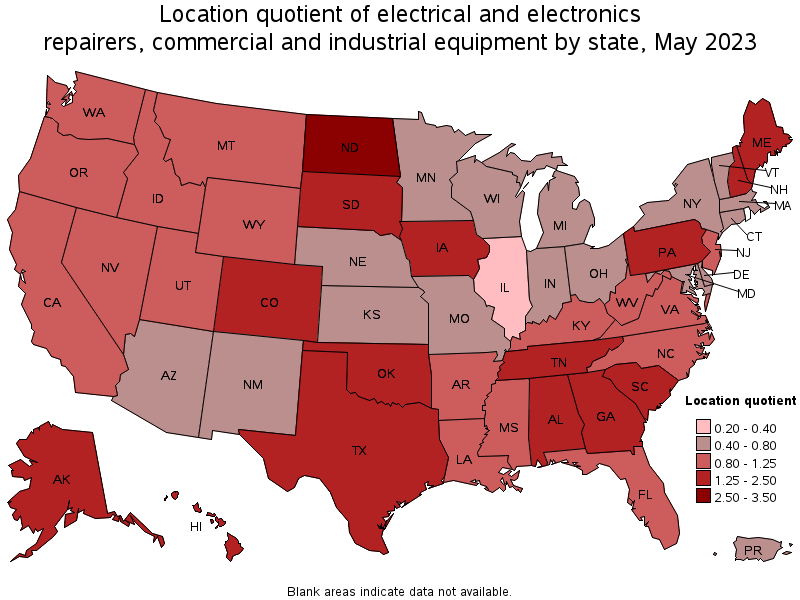
States with the highest concentration of jobs and location quotients in Electrical and Electronics Repairers, Commercial and Industrial Equipment:
| State | Employment (1) | Employment per thousand jobs | Location quotient (9) | Hourly mean wage | Annual mean wage (2) |
|---|---|---|---|---|---|
| North Dakota | 430 | 1.04 | 2.70 | $ 43.68 | $ 90,850 |
| Texas | 10,690 | 0.79 | 2.05 | $ 35.80 | $ 74,470 |
| South Dakota | 340 | 0.77 | 2.00 | $ 29.88 | $ 62,150 |
| Maine | 470 | 0.76 | 1.97 | $ 34.88 | $ 72,550 |
| Colorado | 1,720 | 0.61 | 1.58 | $ 34.83 | $ 72,450 |
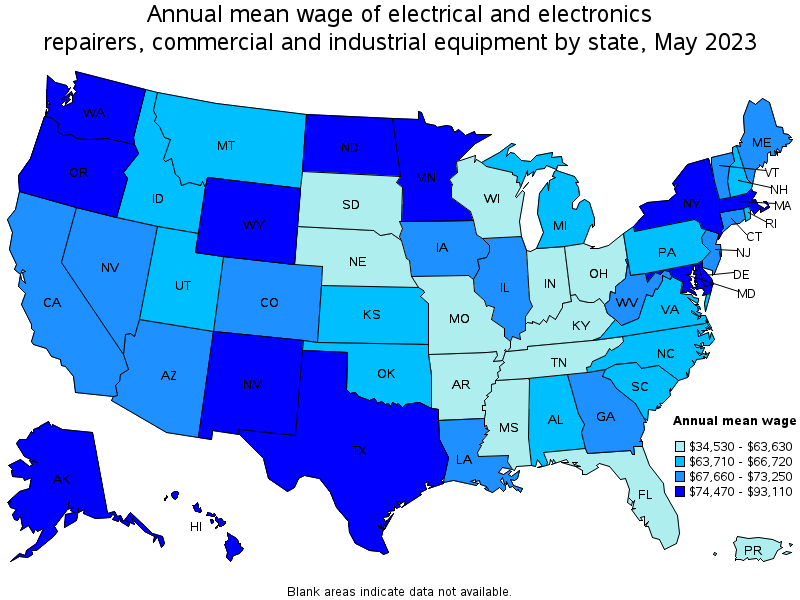
Top paying states for Electrical and Electronics Repairers, Commercial and Industrial Equipment:
| State | Employment (1) | Employment per thousand jobs | Location quotient (9) | Hourly mean wage | Annual mean wage (2) |
|---|---|---|---|---|---|
| Wyoming | 110 | 0.42 | 1.09 | $ 44.76 | $ 93,110 |
| North Dakota | 430 | 1.04 | 2.70 | $ 43.68 | $ 90,850 |
| Washington | 1,480 | 0.42 | 1.10 | $ 42.94 | $ 89,320 |
| Alaska | 180 | 0.59 | 1.52 | $ 41.12 | $ 85,540 |
| New York | 1,660 | 0.18 | 0.46 | $ 39.11 | $ 81,350 |
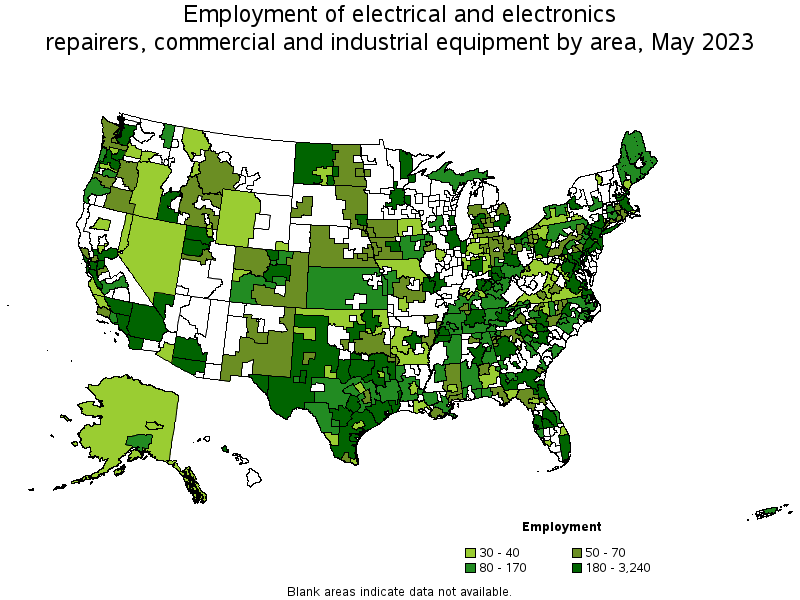
Metropolitan areas with the highest employment level in Electrical and Electronics Repairers, Commercial and Industrial Equipment:
| Metropolitan area | Employment (1) | Employment per thousand jobs | Location quotient (9) | Hourly mean wage | Annual mean wage (2) |
|---|---|---|---|---|---|
| Houston-The Woodlands-Sugar Land, TX | 3,240 | 1.02 | 2.66 | $ 40.84 | $ 84,950 |
| Dallas-Fort Worth-Arlington, TX | 2,540 | 0.64 | 1.66 | $ 32.64 | $ 67,900 |
| Los Angeles-Long Beach-Anaheim, CA | 2,000 | 0.32 | 0.84 | $ 32.01 | $ 66,570 |
| New York-Newark-Jersey City, NY-NJ-PA | 1,600 | 0.17 | 0.44 | $ 39.43 | $ 82,000 |
| Philadelphia-Camden-Wilmington, PA-NJ-DE-MD | 1,260 | 0.45 | 1.16 | $ 34.66 | $ 72,100 |
| Riverside-San Bernardino-Ontario, CA | 1,100 | 0.66 | 1.72 | $ 33.45 | $ 69,580 |
| Miami-Fort Lauderdale-West Palm Beach, FL | 970 | 0.36 | 0.93 | $ 28.43 | $ 59,130 |
| Warner Robins, GA | 810 | 10.48 | 27.30 | $ 29.52 | $ 61,400 |
| Seattle-Tacoma-Bellevue, WA | 780 | 0.38 | 0.98 | $ 45.01 | $ 93,610 |
| Boston-Cambridge-Nashua, MA-NH | 740 | 0.27 | 0.70 | $ 37.29 | $ 77,570 |
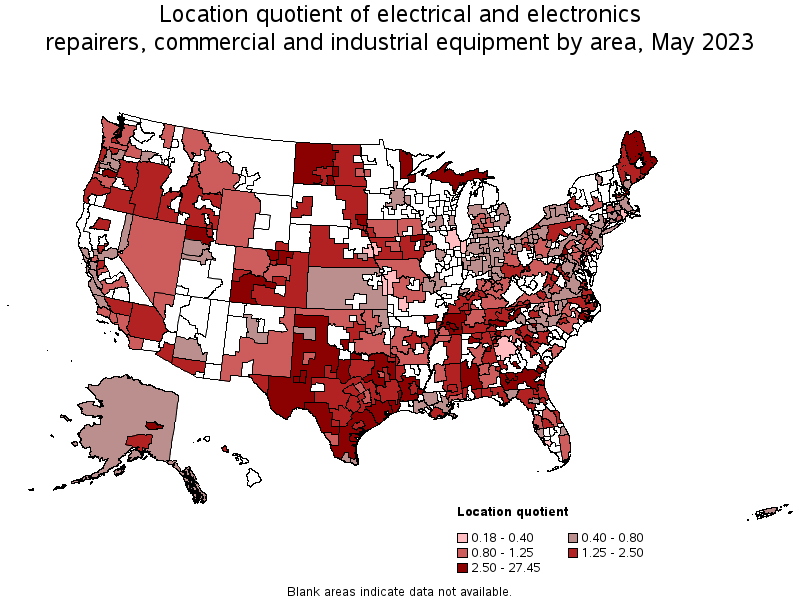
Metropolitan areas with the highest concentration of jobs and location quotients in Electrical and Electronics Repairers, Commercial and Industrial Equipment:
| Metropolitan area | Employment (1) | Employment per thousand jobs | Location quotient (9) | Hourly mean wage | Annual mean wage (2) |
|---|---|---|---|---|---|
| East Stroudsburg, PA | 580 | 10.54 | 27.45 | $ 30.56 | $ 63,560 |
| Warner Robins, GA | 810 | 10.48 | 27.30 | $ 29.52 | $ 61,400 |
| Chambersburg-Waynesboro, PA | 240 | 4.12 | 10.73 | $ 32.74 | $ 68,100 |
| Anniston-Oxford-Jacksonville, AL | 150 | 3.32 | 8.64 | $ 27.77 | $ 57,750 |
| Bremerton-Silverdale, WA | 250 | 2.66 | 6.94 | $ 37.11 | $ 77,180 |
| Hinesville, GA | 50 | 2.65 | 6.90 | $ 33.30 | $ 69,260 |
| Midland, TX | 300 | 2.60 | 6.78 | $ 35.45 | $ 73,730 |
| New Bern, NC | 110 | 2.36 | 6.15 | $ 35.07 | $ 72,940 |
| Portsmouth, NH-ME | 210 | 2.26 | 5.88 | $ 32.64 | $ 67,900 |
| Parkersburg-Vienna, WV | 70 | 2.05 | 5.34 | $ 39.30 | $ 81,730 |
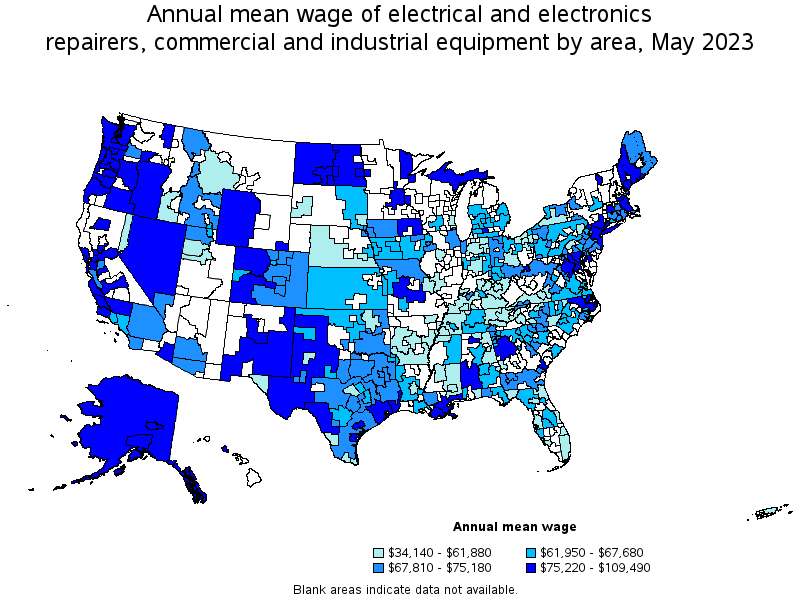
Top paying metropolitan areas for Electrical and Electronics Repairers, Commercial and Industrial Equipment:
| Metropolitan area | Employment (1) | Employment per thousand jobs | Location quotient (9) | Hourly mean wage | Annual mean wage (2) |
|---|---|---|---|---|---|
| Redding, CA | 40 | 0.57 | 1.48 | $ 52.64 | $ 109,490 |
| San Luis Obispo-Paso Robles-Arroyo Grande, CA | 30 | 0.29 | 0.75 | $ 49.53 | $ 103,030 |
| Kennewick-Richland, WA | 30 | 0.26 | 0.68 | $ 47.36 | $ 98,520 |
| Longview, WA | 30 | 0.76 | 1.98 | $ 46.06 | $ 95,800 |
| Seattle-Tacoma-Bellevue, WA | 780 | 0.38 | 0.98 | $ 45.01 | $ 93,610 |
| Fresno, CA | 140 | 0.35 | 0.92 | $ 43.52 | $ 90,510 |
| Beaumont-Port Arthur, TX | 290 | 1.84 | 4.79 | $ 42.81 | $ 89,050 |
| Fairbanks, AK | 30 | 0.97 | 2.54 | $ 42.73 | $ 88,880 |
| Victoria, TX | 30 | 0.81 | 2.10 | $ 41.86 | $ 87,070 |
| San Francisco-Oakland-Hayward, CA | 580 | 0.24 | 0.63 | $ 41.76 | $ 86,870 |
Nonmetropolitan areas with the highest employment in Electrical and Electronics Repairers, Commercial and Industrial Equipment:
| Nonmetropolitan area | Employment (1) | Employment per thousand jobs | Location quotient (9) | Hourly mean wage | Annual mean wage (2) |
|---|---|---|---|---|---|
| North Texas Region of Texas nonmetropolitan area | 330 | 1.18 | 3.07 | $ 34.93 | $ 72,650 |
| West Texas Region of Texas nonmetropolitan area | 320 | 1.61 | 4.20 | $ 37.97 | $ 78,980 |
| West North Dakota nonmetropolitan area | 260 | 2.30 | 5.98 | $ 46.80 | $ 97,340 |
| Coastal Plains Region of Texas nonmetropolitan area | 210 | 1.38 | 3.60 | $ 34.31 | $ 71,360 |
| South Georgia nonmetropolitan area | 210 | 1.07 | 2.78 | $ 35.50 | $ 73,840 |
Nonmetropolitan areas with the highest concentration of jobs and location quotients in Electrical and Electronics Repairers, Commercial and Industrial Equipment:
| Nonmetropolitan area | Employment (1) | Employment per thousand jobs | Location quotient (9) | Hourly mean wage | Annual mean wage (2) |
|---|---|---|---|---|---|
| West North Dakota nonmetropolitan area | 260 | 2.30 | 5.98 | $ 46.80 | $ 97,340 |
| Southwest Alabama nonmetropolitan area | 150 | 2.27 | 5.92 | $ 40.40 | $ 84,020 |
| West Texas Region of Texas nonmetropolitan area | 320 | 1.61 | 4.20 | $ 37.97 | $ 78,980 |
| Border Region of Texas nonmetropolitan area | 90 | 1.52 | 3.96 | $ 39.65 | $ 82,470 |
| Coastal Plains Region of Texas nonmetropolitan area | 210 | 1.38 | 3.60 | $ 34.31 | $ 71,360 |
Top paying nonmetropolitan areas for Electrical and Electronics Repairers, Commercial and Industrial Equipment:
| Nonmetropolitan area | Employment (1) | Employment per thousand jobs | Location quotient (9) | Hourly mean wage | Annual mean wage (2) |
|---|---|---|---|---|---|
| Western Wyoming nonmetropolitan area | 40 | 0.35 | 0.92 | $ 46.98 | $ 97,710 |
| West North Dakota nonmetropolitan area | 260 | 2.30 | 5.98 | $ 46.80 | $ 97,340 |
| Eastern Oregon nonmetropolitan area | 40 | 0.51 | 1.34 | $ 44.02 | $ 91,560 |
| Central Oregon nonmetropolitan area | 50 | 0.74 | 1.93 | $ 43.15 | $ 89,760 |
| Southwest Colorado nonmetropolitan area | 100 | 0.97 | 2.52 | $ 41.88 | $ 87,110 |
These estimates are calculated with data collected from employers in all industry sectors, all metropolitan and nonmetropolitan areas, and all states and the District of Columbia. The top employment and wage figures are provided above. The complete list is available in the downloadable XLS files.
The percentile wage estimate is the value of a wage below which a certain percent of workers fall. The median wage is the 50th percentile wage estimate—50 percent of workers earn less than the median and 50 percent of workers earn more than the median. More about percentile wages.
(1) Estimates for detailed occupations do not sum to the totals because the totals include occupations not shown separately. Estimates do not include self-employed workers.
(2) Annual wages have been calculated by multiplying the hourly mean wage by a "year-round, full-time" hours figure of 2,080 hours; for those occupations where there is not an hourly wage published, the annual wage has been directly calculated from the reported survey data.
(3) The relative standard error (RSE) is a measure of the reliability of a survey statistic. The smaller the relative standard error, the more precise the estimate.
(9) The location quotient is the ratio of the area concentration of occupational employment to the national average concentration. A location quotient greater than one indicates the occupation has a higher share of employment than average, and a location quotient less than one indicates the occupation is less prevalent in the area than average.
Other OEWS estimates and related information:
May 2023 National Occupational Employment and Wage Estimates
May 2023 State Occupational Employment and Wage Estimates
May 2023 Metropolitan and Nonmetropolitan Area Occupational Employment and Wage Estimates
May 2023 National Industry-Specific Occupational Employment and Wage Estimates
Last Modified Date: April 3, 2024