
An official website of the United States government
An official website of the United States government
The .gov means it's official.
Federal government websites often end in .gov or .mil. Before sharing sensitive information,
make sure you're on a federal government site.
The site is secure.
The
https:// ensures that you are connecting to the official website and that any
information you provide is encrypted and transmitted securely.
Diagnose, adjust, repair, or overhaul farm machinery and vehicles, such as tractors, harvesters, dairy equipment, and irrigation systems. Excludes �Bus and Truck Mechanics and Diesel Engine Specialists� (49-3031).
Employment estimate and mean wage estimates for Farm Equipment Mechanics and Service Technicians:
| Employment (1) | Employment RSE (3) |
Mean hourly wage |
Mean annual wage (2) |
Wage RSE (3) |
|---|---|---|---|---|
| 36,830 | 1.4 % | $ 25.06 | $ 52,120 | 0.5 % |
Percentile wage estimates for Farm Equipment Mechanics and Service Technicians:
| Percentile | 10% | 25% | 50% (Median) |
75% | 90% |
|---|---|---|---|---|---|
| Hourly Wage | $ 16.76 | $ 19.85 | $ 23.66 | $ 29.47 | $ 34.83 |
| Annual Wage (2) | $ 34,870 | $ 41,290 | $ 49,210 | $ 61,310 | $ 72,450 |
Industries with the highest published employment and wages for Farm Equipment Mechanics and Service Technicians are provided. For a list of all industries with employment in Farm Equipment Mechanics and Service Technicians, see the Create Customized Tables function.
Industries with the highest levels of employment in Farm Equipment Mechanics and Service Technicians:
| Industry | Employment (1) | Percent of industry employment | Hourly mean wage | Annual mean wage (2) |
|---|---|---|---|---|
| Machinery, Equipment, and Supplies Merchant Wholesalers | 25,650 | 3.45 | $ 25.43 | $ 52,900 |
| Support Activities for Crop Production | 3,030 | 0.90 | $ 22.97 | $ 47,770 |
| Commercial and Industrial Machinery and Equipment (except Automotive and Electronic) Repair and Maintenance | 1,930 | 0.82 | $ 25.07 | $ 52,150 |
| Merchant Wholesalers, Nondurable Goods (4241, 4247, and 4249 only) | 1,500 | 0.28 | $ 23.59 | $ 49,060 |
| Lawn and Garden Equipment and Supplies Retailers | 1,100 | 0.57 | $ 23.49 | $ 48,870 |
Industries with the highest concentration of employment in Farm Equipment Mechanics and Service Technicians:
| Industry | Employment (1) | Percent of industry employment | Hourly mean wage | Annual mean wage (2) |
|---|---|---|---|---|
| Machinery, Equipment, and Supplies Merchant Wholesalers | 25,650 | 3.45 | $ 25.43 | $ 52,900 |
| Support Activities for Crop Production | 3,030 | 0.90 | $ 22.97 | $ 47,770 |
| Commercial and Industrial Machinery and Equipment (except Automotive and Electronic) Repair and Maintenance | 1,930 | 0.82 | $ 25.07 | $ 52,150 |
| Lawn and Garden Equipment and Supplies Retailers | 1,100 | 0.57 | $ 23.49 | $ 48,870 |
| Merchant Wholesalers, Nondurable Goods (4241, 4247, and 4249 only) | 1,500 | 0.28 | $ 23.59 | $ 49,060 |
Top paying industries for Farm Equipment Mechanics and Service Technicians:
| Industry | Employment (1) | Percent of industry employment | Hourly mean wage | Annual mean wage (2) |
|---|---|---|---|---|
| Motor Vehicle and Motor Vehicle Parts and Supplies Merchant Wholesalers | 80 | 0.02 | $ 28.43 | $ 59,140 |
| Fruit and Vegetable Preserving and Specialty Food Manufacturing | 180 | 0.11 | $ 27.94 | $ 58,120 |
| Automotive Repair and Maintenance | 110 | 0.01 | $ 27.72 | $ 57,660 |
| Support Activities for Animal Production | 50 | 0.15 | $ 27.53 | $ 57,270 |
| Management of Companies and Enterprises | 170 | 0.01 | $ 26.77 | $ 55,690 |
States and areas with the highest published employment, location quotients, and wages for Farm Equipment Mechanics and Service Technicians are provided. For a list of all areas with employment in Farm Equipment Mechanics and Service Technicians, see the Create Customized Tables function.
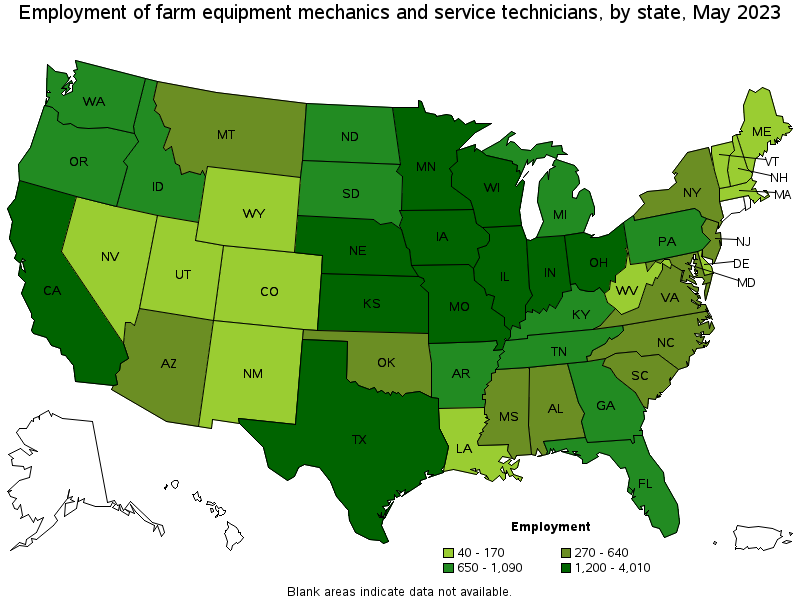
States with the highest employment level in Farm Equipment Mechanics and Service Technicians:
| State | Employment (1) | Employment per thousand jobs | Location quotient (9) | Hourly mean wage | Annual mean wage (2) |
|---|---|---|---|---|---|
| California | 4,010 | 0.22 | 0.92 | $ 26.92 | $ 56,000 |
| Texas | 2,150 | 0.16 | 0.66 | $ 20.95 | $ 43,570 |
| Iowa | 2,100 | 1.36 | 5.62 | $ 26.18 | $ 54,450 |
| Kansas | 1,700 | 1.21 | 4.97 | $ 25.08 | $ 52,170 |
| Minnesota | 1,630 | 0.57 | 2.33 | $ 26.82 | $ 55,780 |
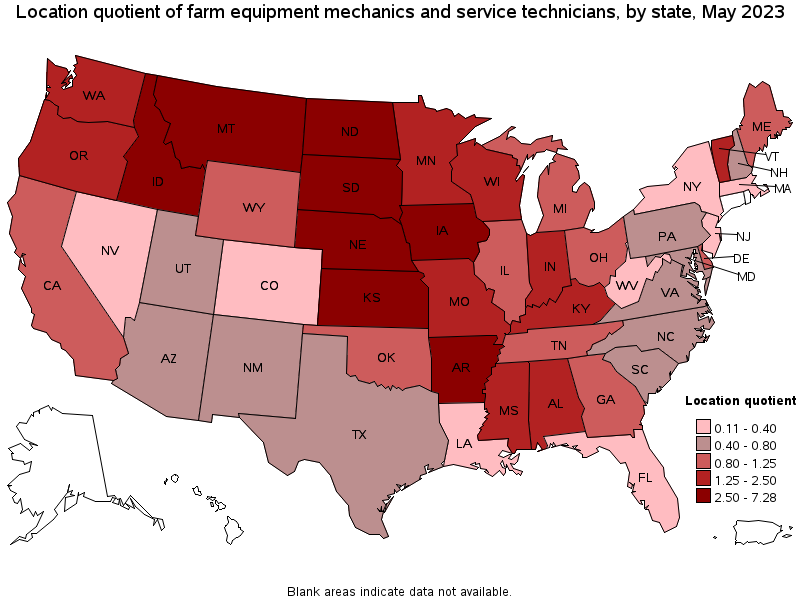
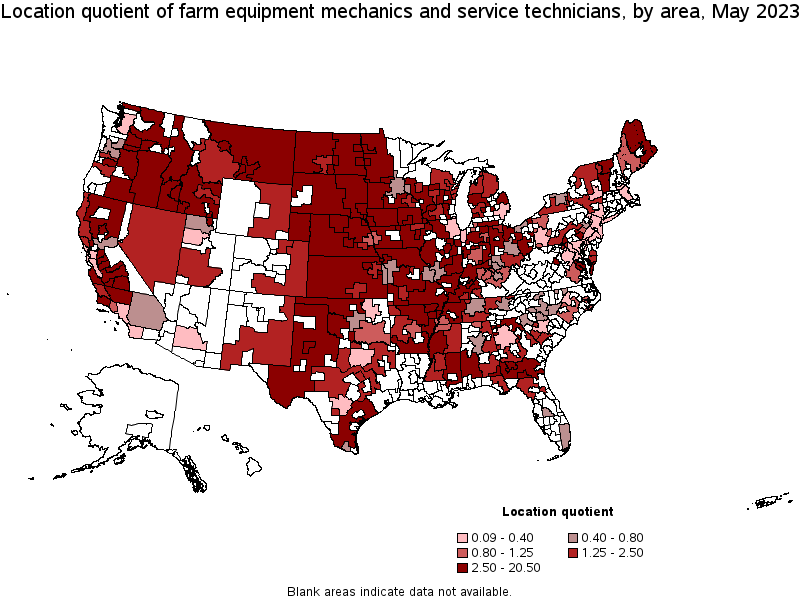
States with the highest concentration of jobs and location quotients in Farm Equipment Mechanics and Service Technicians:
| State | Employment (1) | Employment per thousand jobs | Location quotient (9) | Hourly mean wage | Annual mean wage (2) |
|---|---|---|---|---|---|
| North Dakota | 740 | 1.77 | 7.28 | $ 30.03 | $ 62,460 |
| South Dakota | 780 | 1.75 | 7.21 | $ 29.88 | $ 62,150 |
| Nebraska | 1,600 | 1.60 | 6.61 | $ 25.27 | $ 52,550 |
| Iowa | 2,100 | 1.36 | 5.62 | $ 26.18 | $ 54,450 |
| Kansas | 1,700 | 1.21 | 4.97 | $ 25.08 | $ 52,170 |
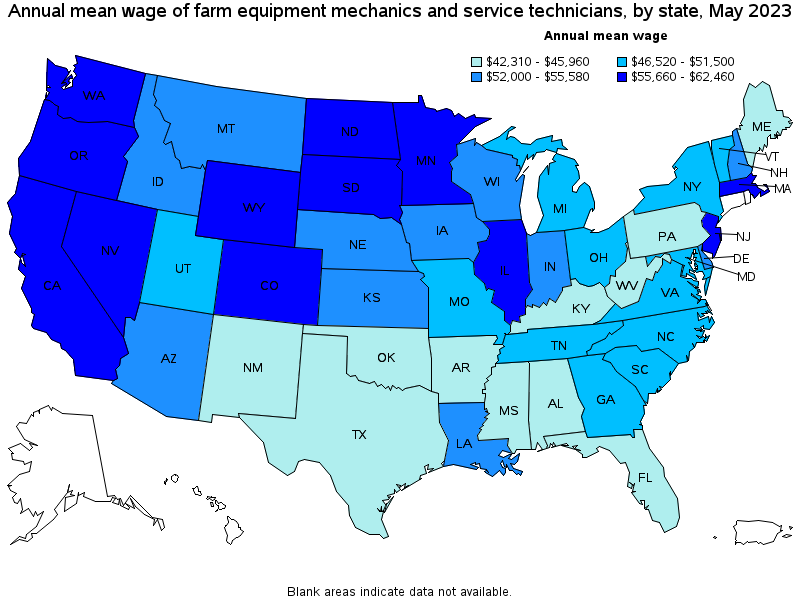
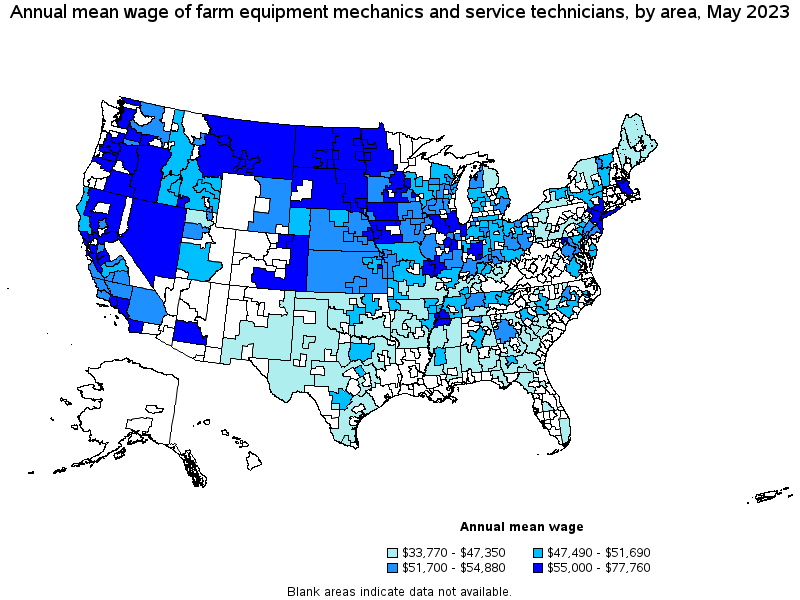
Top paying states for Farm Equipment Mechanics and Service Technicians:
| State | Employment (1) | Employment per thousand jobs | Location quotient (9) | Hourly mean wage | Annual mean wage (2) |
|---|---|---|---|---|---|
| North Dakota | 740 | 1.77 | 7.28 | $ 30.03 | $ 62,460 |
| South Dakota | 780 | 1.75 | 7.21 | $ 29.88 | $ 62,150 |
| Illinois | 1,610 | 0.27 | 1.10 | $ 29.51 | $ 61,370 |
| Nevada | 90 | 0.06 | 0.24 | $ 28.90 | $ 60,110 |
| Oregon | 650 | 0.34 | 1.38 | $ 28.60 | $ 59,490 |
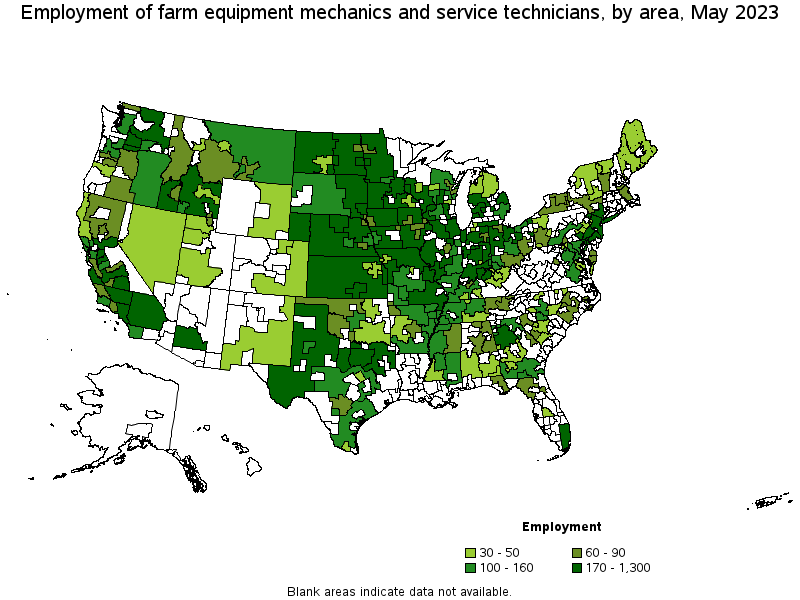
Metropolitan areas with the highest employment level in Farm Equipment Mechanics and Service Technicians:
| Metropolitan area | Employment (1) | Employment per thousand jobs | Location quotient (9) | Hourly mean wage | Annual mean wage (2) |
|---|---|---|---|---|---|
| Fresno, CA | 390 | 0.95 | 3.91 | $ 24.69 | $ 51,340 |
| Bakersfield, CA | 370 | 1.11 | 4.59 | $ 25.05 | $ 52,100 |
| Chicago-Naperville-Elgin, IL-IN-WI | 370 | 0.08 | 0.34 | $ 37.39 | $ 77,760 |
| Minneapolis-St. Paul-Bloomington, MN-WI | 360 | 0.19 | 0.78 | $ 28.45 | $ 59,180 |
| Dallas-Fort Worth-Arlington, TX | 330 | 0.08 | 0.34 | $ 23.70 | $ 49,290 |
| Salinas, CA | 310 | 1.72 | 7.07 | $ 25.23 | $ 52,480 |
| Visalia-Porterville, CA | 290 | 1.74 | 7.17 | $ 25.68 | $ 53,410 |
| Indianapolis-Carmel-Anderson, IN | 270 | 0.25 | 1.05 | $ 26.69 | $ 55,510 |
| Miami-Fort Lauderdale-West Palm Beach, FL | 270 | 0.10 | 0.41 | $ 21.39 | $ 44,490 |
| Sioux Falls, SD | 250 | 1.49 | 6.15 | $ 30.27 | $ 62,970 |
Metropolitan areas with the highest concentration of jobs and location quotients in Farm Equipment Mechanics and Service Technicians:
| Metropolitan area | Employment (1) | Employment per thousand jobs | Location quotient (9) | Hourly mean wage | Annual mean wage (2) |
|---|---|---|---|---|---|
| Valdosta, GA | 160 | 3.01 | 12.41 | $ 22.59 | $ 46,990 |
| Twin Falls, ID | 130 | 2.74 | 11.30 | $ 27.11 | $ 56,400 |
| Grand Island, NE | 110 | 2.65 | 10.93 | $ 26.05 | $ 54,190 |
| Merced, CA | 150 | 1.95 | 8.02 | $ 27.55 | $ 57,300 |
| Jonesboro, AR | 110 | 1.86 | 7.68 | $ 23.88 | $ 49,670 |
| Yakima, WA | 180 | 1.83 | 7.56 | $ 27.36 | $ 56,920 |
| Madera, CA | 90 | 1.79 | 7.37 | $ 25.01 | $ 52,010 |
| Visalia-Porterville, CA | 290 | 1.74 | 7.17 | $ 25.68 | $ 53,410 |
| Salinas, CA | 310 | 1.72 | 7.07 | $ 25.23 | $ 52,480 |
| Ames, IA | 80 | 1.65 | 6.80 | $ 27.62 | $ 57,450 |
Top paying metropolitan areas for Farm Equipment Mechanics and Service Technicians:
| Metropolitan area | Employment (1) | Employment per thousand jobs | Location quotient (9) | Hourly mean wage | Annual mean wage (2) |
|---|---|---|---|---|---|
| Chicago-Naperville-Elgin, IL-IN-WI | 370 | 0.08 | 0.34 | $ 37.39 | $ 77,760 |
| San Francisco-Oakland-Hayward, CA | 150 | 0.06 | 0.25 | $ 34.72 | $ 72,220 |
| Bloomington, IL | 90 | 0.96 | 3.94 | $ 33.90 | $ 70,510 |
| San Jose-Sunnyvale-Santa Clara, CA | 60 | 0.05 | 0.22 | $ 31.91 | $ 66,370 |
| Bismarck, ND | 40 | 0.54 | 2.22 | $ 31.45 | $ 65,410 |
| Columbus, IN | 50 | 0.92 | 3.78 | $ 31.45 | $ 65,410 |
| Champaign-Urbana, IL | 100 | 0.98 | 4.03 | $ 30.38 | $ 63,200 |
| Sioux Falls, SD | 250 | 1.49 | 6.15 | $ 30.27 | $ 62,970 |
| Eugene, OR | 50 | 0.34 | 1.38 | $ 30.16 | $ 62,730 |
| Portland-Vancouver-Hillsboro, OR-WA | 160 | 0.13 | 0.54 | $ 30.16 | $ 62,730 |
Nonmetropolitan areas with the highest employment in Farm Equipment Mechanics and Service Technicians:
| Nonmetropolitan area | Employment (1) | Employment per thousand jobs | Location quotient (9) | Hourly mean wage | Annual mean wage (2) |
|---|---|---|---|---|---|
| Kansas nonmetropolitan area | 1,300 | 3.34 | 13.77 | $ 25.07 | $ 52,150 |
| South Nebraska nonmetropolitan area | 710 | 4.81 | 19.84 | $ 25.19 | $ 52,380 |
| Southwest Minnesota nonmetropolitan area | 490 | 4.12 | 16.98 | $ 26.18 | $ 54,450 |
| Northwest Iowa nonmetropolitan area | 470 | 3.48 | 14.36 | $ 26.71 | $ 55,550 |
| Northeast Nebraska nonmetropolitan area | 410 | 4.40 | 18.14 | $ 25.09 | $ 52,180 |
Nonmetropolitan areas with the highest concentration of jobs and location quotients in Farm Equipment Mechanics and Service Technicians:
| Nonmetropolitan area | Employment (1) | Employment per thousand jobs | Location quotient (9) | Hourly mean wage | Annual mean wage (2) |
|---|---|---|---|---|---|
| Northwest Nebraska nonmetropolitan area | 190 | 4.97 | 20.50 | $ 24.60 | $ 51,170 |
| South Nebraska nonmetropolitan area | 710 | 4.81 | 19.84 | $ 25.19 | $ 52,380 |
| Northeast Nebraska nonmetropolitan area | 410 | 4.40 | 18.14 | $ 25.09 | $ 52,180 |
| East North Dakota nonmetropolitan area | 260 | 4.23 | 17.46 | $ 28.59 | $ 59,470 |
| Southwest Minnesota nonmetropolitan area | 490 | 4.12 | 16.98 | $ 26.18 | $ 54,450 |
Top paying nonmetropolitan areas for Farm Equipment Mechanics and Service Technicians:
| Nonmetropolitan area | Employment (1) | Employment per thousand jobs | Location quotient (9) | Hourly mean wage | Annual mean wage (2) |
|---|---|---|---|---|---|
| West North Dakota nonmetropolitan area | 240 | 2.06 | 8.49 | $ 30.93 | $ 64,340 |
| East South Dakota nonmetropolitan area | 350 | 2.62 | 10.82 | $ 30.35 | $ 63,130 |
| Nevada nonmetropolitan area | 50 | 0.54 | 2.21 | $ 29.28 | $ 60,900 |
| East North Dakota nonmetropolitan area | 260 | 4.23 | 17.46 | $ 28.59 | $ 59,470 |
| Northwest Illinois nonmetropolitan area | 170 | 1.31 | 5.40 | $ 28.33 | $ 58,930 |
These estimates are calculated with data collected from employers in all industry sectors, all metropolitan and nonmetropolitan areas, and all states and the District of Columbia. The top employment and wage figures are provided above. The complete list is available in the downloadable XLS files.
The percentile wage estimate is the value of a wage below which a certain percent of workers fall. The median wage is the 50th percentile wage estimate—50 percent of workers earn less than the median and 50 percent of workers earn more than the median. More about percentile wages.
(1) Estimates for detailed occupations do not sum to the totals because the totals include occupations not shown separately. Estimates do not include self-employed workers.
(2) Annual wages have been calculated by multiplying the hourly mean wage by a "year-round, full-time" hours figure of 2,080 hours; for those occupations where there is not an hourly wage published, the annual wage has been directly calculated from the reported survey data.
(3) The relative standard error (RSE) is a measure of the reliability of a survey statistic. The smaller the relative standard error, the more precise the estimate.
(9) The location quotient is the ratio of the area concentration of occupational employment to the national average concentration. A location quotient greater than one indicates the occupation has a higher share of employment than average, and a location quotient less than one indicates the occupation is less prevalent in the area than average.
Other OEWS estimates and related information:
May 2023 National Occupational Employment and Wage Estimates
May 2023 State Occupational Employment and Wage Estimates
May 2023 Metropolitan and Nonmetropolitan Area Occupational Employment and Wage Estimates
May 2023 National Industry-Specific Occupational Employment and Wage Estimates
Last Modified Date: April 3, 2024