
An official website of the United States government
An official website of the United States government
The .gov means it's official.
Federal government websites often end in .gov or .mil. Before sharing sensitive information,
make sure you're on a federal government site.
The site is secure.
The
https:// ensures that you are connecting to the official website and that any
information you provide is encrypted and transmitted securely.
Operate or control petroleum refining or processing units. May specialize in controlling manifold and pumping systems, gauging or testing oil in storage tanks, or regulating the flow of oil into pipelines.
Employment estimate and mean wage estimates for Petroleum Pump System Operators, Refinery Operators, and Gaugers:
| Employment (1) | Employment RSE (3) |
Mean hourly wage |
Mean annual wage (2) |
Wage RSE (3) |
|---|---|---|---|---|
| 33,360 | 3.3 % | $ 42.36 | $ 88,120 | 0.8 % |
Percentile wage estimates for Petroleum Pump System Operators, Refinery Operators, and Gaugers:
| Percentile | 10% | 25% | 50% (Median) |
75% | 90% |
|---|---|---|---|---|---|
| Hourly Wage | $ 27.87 | $ 36.60 | $ 45.47 | $ 49.24 | $ 52.99 |
| Annual Wage (2) | $ 57,970 | $ 76,130 | $ 94,580 | $ 102,410 | $ 110,220 |
Industries with the highest published employment and wages for Petroleum Pump System Operators, Refinery Operators, and Gaugers are provided. For a list of all industries with employment in Petroleum Pump System Operators, Refinery Operators, and Gaugers, see the Create Customized Tables function.
Industries with the highest levels of employment in Petroleum Pump System Operators, Refinery Operators, and Gaugers:
| Industry | Employment (1) | Percent of industry employment | Hourly mean wage | Annual mean wage (2) |
|---|---|---|---|---|
| Petroleum and Coal Products Manufacturing | 17,310 | 15.98 | $ 44.35 | $ 92,240 |
| Pipeline Transportation of Natural Gas | 4,540 | 13.85 | $ 43.70 | $ 90,900 |
| Pipeline Transportation of Crude Oil | 2,280 | 19.20 | $ 44.98 | $ 93,550 |
| Other Pipeline Transportation | 2,190 | 25.88 | $ 42.43 | $ 88,260 |
| Oil and Gas Extraction | 2,190 | 2.02 | $ 40.09 | $ 83,380 |
Industries with the highest concentration of employment in Petroleum Pump System Operators, Refinery Operators, and Gaugers:
| Industry | Employment (1) | Percent of industry employment | Hourly mean wage | Annual mean wage (2) |
|---|---|---|---|---|
| Other Pipeline Transportation | 2,190 | 25.88 | $ 42.43 | $ 88,260 |
| Pipeline Transportation of Crude Oil | 2,280 | 19.20 | $ 44.98 | $ 93,550 |
| Petroleum and Coal Products Manufacturing | 17,310 | 15.98 | $ 44.35 | $ 92,240 |
| Pipeline Transportation of Natural Gas | 4,540 | 13.85 | $ 43.70 | $ 90,900 |
| Oil and Gas Extraction | 2,190 | 2.02 | $ 40.09 | $ 83,380 |
Top paying industries for Petroleum Pump System Operators, Refinery Operators, and Gaugers:
| Industry | Employment (1) | Percent of industry employment | Hourly mean wage | Annual mean wage (2) |
|---|---|---|---|---|
| Electric Power Generation, Transmission and Distribution | 110 | 0.03 | $ 48.44 | $ 100,750 |
| Pipeline Transportation of Crude Oil | 2,280 | 19.20 | $ 44.98 | $ 93,550 |
| Natural Gas Distribution | 130 | 0.11 | $ 44.88 | $ 93,350 |
| Petroleum and Coal Products Manufacturing | 17,310 | 15.98 | $ 44.35 | $ 92,240 |
| Pipeline Transportation of Natural Gas | 4,540 | 13.85 | $ 43.70 | $ 90,900 |
States and areas with the highest published employment, location quotients, and wages for Petroleum Pump System Operators, Refinery Operators, and Gaugers are provided. For a list of all areas with employment in Petroleum Pump System Operators, Refinery Operators, and Gaugers, see the Create Customized Tables function.
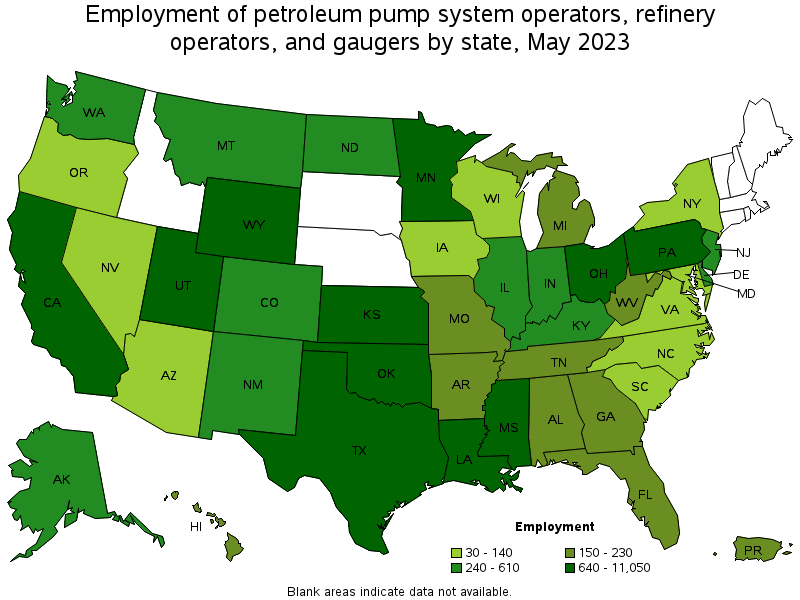
States with the highest employment level in Petroleum Pump System Operators, Refinery Operators, and Gaugers:
| State | Employment (1) | Employment per thousand jobs | Location quotient (9) | Hourly mean wage | Annual mean wage (2) |
|---|---|---|---|---|---|
| Texas | 11,050 | 0.81 | 3.71 | $ 42.14 | $ 87,660 |
| California | 3,680 | 0.21 | 0.93 | $ 48.65 | $ 101,190 |
| Louisiana | 3,660 | 1.98 | 9.00 | $ 43.32 | $ 90,110 |
| Oklahoma | 1,820 | 1.09 | 4.97 | $ 42.26 | $ 87,900 |
| Ohio | 990 | 0.18 | 0.82 | $ 44.42 | $ 92,390 |
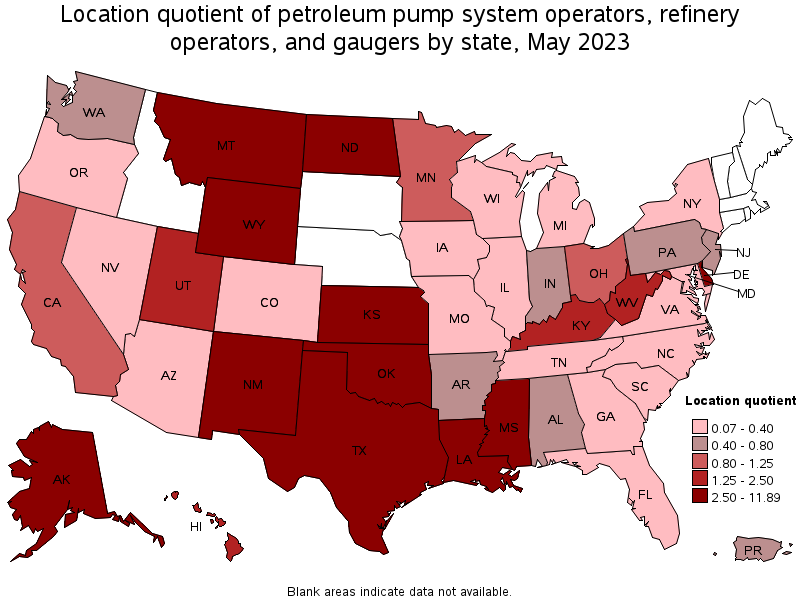
States with the highest concentration of jobs and location quotients in Petroleum Pump System Operators, Refinery Operators, and Gaugers:
| State | Employment (1) | Employment per thousand jobs | Location quotient (9) | Hourly mean wage | Annual mean wage (2) |
|---|---|---|---|---|---|
| Wyoming | 710 | 2.61 | 11.89 | $ 43.34 | $ 90,150 |
| Louisiana | 3,660 | 1.98 | 9.00 | $ 43.32 | $ 90,110 |
| Oklahoma | 1,820 | 1.09 | 4.97 | $ 42.26 | $ 87,900 |
| Alaska | 330 | 1.05 | 4.76 | $ 47.76 | $ 99,340 |
| Texas | 11,050 | 0.81 | 3.71 | $ 42.14 | $ 87,660 |
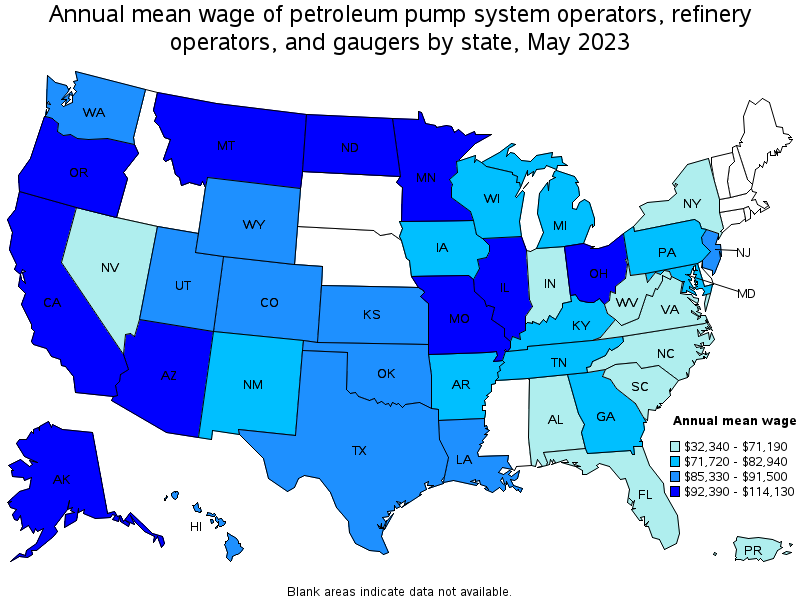
Top paying states for Petroleum Pump System Operators, Refinery Operators, and Gaugers:
| State | Employment (1) | Employment per thousand jobs | Location quotient (9) | Hourly mean wage | Annual mean wage (2) |
|---|---|---|---|---|---|
| Illinois | 450 | 0.08 | 0.34 | $ 54.87 | $ 114,130 |
| Minnesota | 640 | 0.22 | 1.01 | $ 49.14 | $ 102,200 |
| California | 3,680 | 0.21 | 0.93 | $ 48.65 | $ 101,190 |
| Alaska | 330 | 1.05 | 4.76 | $ 47.76 | $ 99,340 |
| Montana | 390 | 0.77 | 3.50 | $ 47.61 | $ 99,030 |
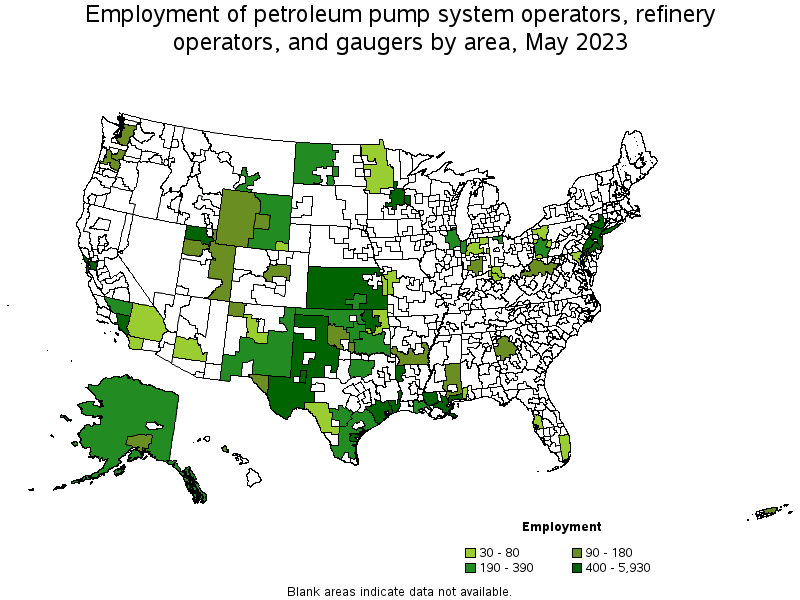
Metropolitan areas with the highest employment level in Petroleum Pump System Operators, Refinery Operators, and Gaugers:
| Metropolitan area | Employment (1) | Employment per thousand jobs | Location quotient (9) | Hourly mean wage | Annual mean wage (2) |
|---|---|---|---|---|---|
| Houston-The Woodlands-Sugar Land, TX | 5,930 | 1.87 | 8.49 | $ 44.53 | $ 92,620 |
| Los Angeles-Long Beach-Anaheim, CA | 1,810 | 0.29 | 1.33 | $ 48.52 | $ 100,920 |
| Beaumont-Port Arthur, TX | 1,520 | 9.80 | 44.63 | $ 40.73 | $ 84,720 |
| New Orleans-Metairie, LA | 1,460 | 2.83 | 12.90 | $ 46.64 | $ 97,000 |
| San Francisco-Oakland-Hayward, CA | 1,110 | 0.46 | 2.09 | $ 54.36 | $ 113,060 |
| Corpus Christi, TX | 860 | 4.62 | 21.02 | $ 39.75 | $ 82,670 |
| Baton Rouge, LA | 750 | 1.94 | 8.81 | (8) | (8) |
| Tulsa, OK | 710 | 1.61 | 7.33 | $ 45.32 | $ 94,260 |
| Philadelphia-Camden-Wilmington, PA-NJ-DE-MD | 610 | 0.22 | 0.98 | $ 47.62 | $ 99,040 |
| Minneapolis-St. Paul-Bloomington, MN-WI | 550 | 0.29 | 1.31 | $ 50.34 | $ 104,710 |
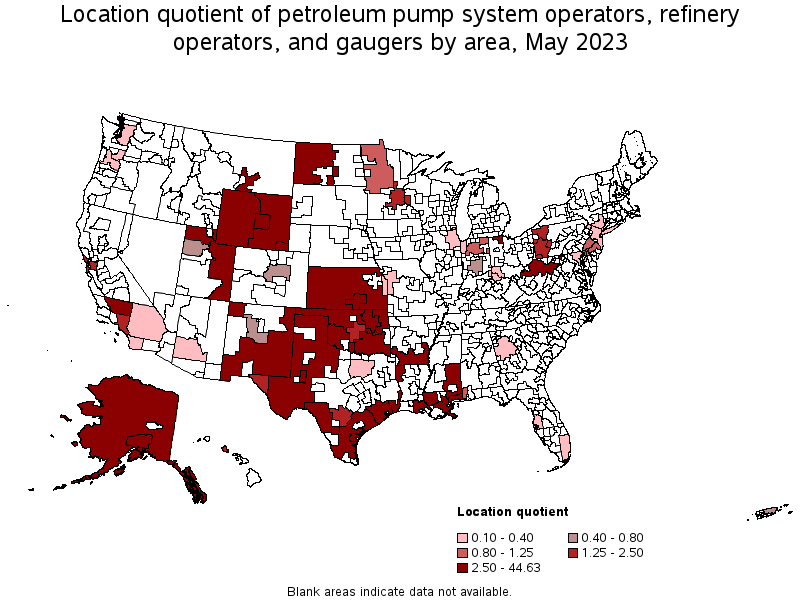
Metropolitan areas with the highest concentration of jobs and location quotients in Petroleum Pump System Operators, Refinery Operators, and Gaugers:
| Metropolitan area | Employment (1) | Employment per thousand jobs | Location quotient (9) | Hourly mean wage | Annual mean wage (2) |
|---|---|---|---|---|---|
| Beaumont-Port Arthur, TX | 1,520 | 9.80 | 44.63 | $ 40.73 | $ 84,720 |
| Corpus Christi, TX | 860 | 4.62 | 21.02 | $ 39.75 | $ 82,670 |
| Casper, WY | 140 | 3.61 | 16.43 | $ 40.50 | $ 84,240 |
| Billings, MT | 320 | 3.54 | 16.11 | $ 49.11 | $ 102,150 |
| Midland, TX | 410 | 3.53 | 16.07 | $ 43.41 | $ 90,300 |
| New Orleans-Metairie, LA | 1,460 | 2.83 | 12.90 | $ 46.64 | $ 97,000 |
| Gulfport-Biloxi-Pascagoula, MS | 410 | 2.69 | 12.26 | (8) | (8) |
| Shreveport-Bossier City, LA | 410 | 2.39 | 10.90 | $ 37.95 | $ 78,930 |
| Farmington, NM | 110 | 2.36 | 10.77 | $ 35.84 | $ 74,560 |
| Baton Rouge, LA | 750 | 1.94 | 8.81 | (8) | (8) |
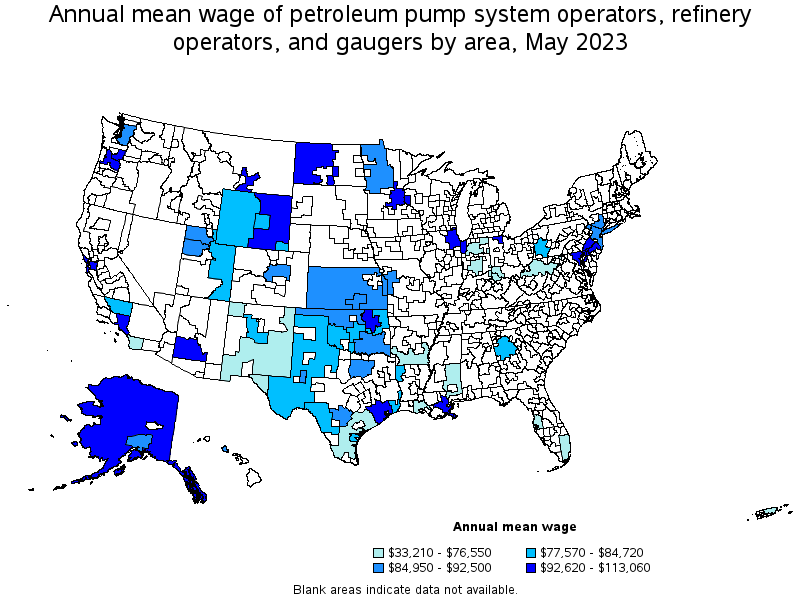
Top paying metropolitan areas for Petroleum Pump System Operators, Refinery Operators, and Gaugers:
| Metropolitan area | Employment (1) | Employment per thousand jobs | Location quotient (9) | Hourly mean wage | Annual mean wage (2) |
|---|---|---|---|---|---|
| San Francisco-Oakland-Hayward, CA | 1,110 | 0.46 | 2.09 | $ 54.36 | $ 113,060 |
| Chicago-Naperville-Elgin, IL-IN-WI | 360 | 0.08 | 0.37 | $ 50.89 | $ 105,840 |
| Minneapolis-St. Paul-Bloomington, MN-WI | 550 | 0.29 | 1.31 | $ 50.34 | $ 104,710 |
| Toledo, OH | 340 | 1.17 | 5.32 | $ 49.40 | $ 102,740 |
| Billings, MT | 320 | 3.54 | 16.11 | $ 49.11 | $ 102,150 |
| Los Angeles-Long Beach-Anaheim, CA | 1,810 | 0.29 | 1.33 | $ 48.52 | $ 100,920 |
| Philadelphia-Camden-Wilmington, PA-NJ-DE-MD | 610 | 0.22 | 0.98 | $ 47.62 | $ 99,040 |
| Baltimore-Columbia-Towson, MD | 30 | 0.02 | 0.11 | $ 47.25 | $ 98,270 |
| Phoenix-Mesa-Scottsdale, AZ | 70 | 0.03 | 0.13 | $ 46.71 | $ 97,160 |
| New Orleans-Metairie, LA | 1,460 | 2.83 | 12.90 | $ 46.64 | $ 97,000 |
Nonmetropolitan areas with the highest employment in Petroleum Pump System Operators, Refinery Operators, and Gaugers:
| Nonmetropolitan area | Employment (1) | Employment per thousand jobs | Location quotient (9) | Hourly mean wage | Annual mean wage (2) |
|---|---|---|---|---|---|
| Kansas nonmetropolitan area | 570 | 1.47 | 6.70 | $ 43.91 | $ 91,330 |
| West Texas Region of Texas nonmetropolitan area | 570 | 2.88 | 13.13 | $ 37.92 | $ 78,870 |
| Southeast Oklahoma nonmetropolitan area | 390 | 2.27 | 10.33 | $ 42.11 | $ 87,590 |
| Eastern Wyoming nonmetropolitan area | 320 | 3.86 | 17.56 | $ 46.88 | $ 97,510 |
| West North Dakota nonmetropolitan area | 280 | 2.43 | 11.05 | $ 47.46 | $ 98,720 |
Nonmetropolitan areas with the highest concentration of jobs and location quotients in Petroleum Pump System Operators, Refinery Operators, and Gaugers:
| Nonmetropolitan area | Employment (1) | Employment per thousand jobs | Location quotient (9) | Hourly mean wage | Annual mean wage (2) |
|---|---|---|---|---|---|
| Eastern Wyoming nonmetropolitan area | 320 | 3.86 | 17.56 | $ 46.88 | $ 97,510 |
| West Texas Region of Texas nonmetropolitan area | 570 | 2.88 | 13.13 | $ 37.92 | $ 78,870 |
| West North Dakota nonmetropolitan area | 280 | 2.43 | 11.05 | $ 47.46 | $ 98,720 |
| Northwest Oklahoma nonmetropolitan area | 220 | 2.29 | 10.43 | $ 41.01 | $ 85,300 |
| Southeast Oklahoma nonmetropolitan area | 390 | 2.27 | 10.33 | $ 42.11 | $ 87,590 |
Top paying nonmetropolitan areas for Petroleum Pump System Operators, Refinery Operators, and Gaugers:
| Nonmetropolitan area | Employment (1) | Employment per thousand jobs | Location quotient (9) | Hourly mean wage | Annual mean wage (2) |
|---|---|---|---|---|---|
| Alaska nonmetropolitan area | 200 | 1.92 | 8.72 | $ 51.15 | $ 106,390 |
| West North Dakota nonmetropolitan area | 280 | 2.43 | 11.05 | $ 47.46 | $ 98,720 |
| Eastern Wyoming nonmetropolitan area | 320 | 3.86 | 17.56 | $ 46.88 | $ 97,510 |
| Northwest Minnesota nonmetropolitan area | 50 | 0.25 | 1.12 | $ 44.11 | $ 91,750 |
| Kansas nonmetropolitan area | 570 | 1.47 | 6.70 | $ 43.91 | $ 91,330 |
These estimates are calculated with data collected from employers in all industry sectors, all metropolitan and nonmetropolitan areas, and all states and the District of Columbia. The top employment and wage figures are provided above. The complete list is available in the downloadable XLS files.
The percentile wage estimate is the value of a wage below which a certain percent of workers fall. The median wage is the 50th percentile wage estimate—50 percent of workers earn less than the median and 50 percent of workers earn more than the median. More about percentile wages.
(1) Estimates for detailed occupations do not sum to the totals because the totals include occupations not shown separately. Estimates do not include self-employed workers.
(2) Annual wages have been calculated by multiplying the hourly mean wage by a "year-round, full-time" hours figure of 2,080 hours; for those occupations where there is not an hourly wage published, the annual wage has been directly calculated from the reported survey data.
(3) The relative standard error (RSE) is a measure of the reliability of a survey statistic. The smaller the relative standard error, the more precise the estimate.
(8) Estimate not released.
(9) The location quotient is the ratio of the area concentration of occupational employment to the national average concentration. A location quotient greater than one indicates the occupation has a higher share of employment than average, and a location quotient less than one indicates the occupation is less prevalent in the area than average.
Other OEWS estimates and related information:
May 2023 National Occupational Employment and Wage Estimates
May 2023 State Occupational Employment and Wage Estimates
May 2023 Metropolitan and Nonmetropolitan Area Occupational Employment and Wage Estimates
May 2023 National Industry-Specific Occupational Employment and Wage Estimates
Last Modified Date: April 3, 2024